Copyright © 2002, American Society for Microbiology. All Rights Reserved.
Quantification of Substance P mRNA in Human Immune Cells
by Real-Time Reverse Transcriptase PCR Assay
Jian-Ping Lai,
1Steven D. Douglas,
1Farida Shaheen,
2David E. Pleasure,
3and Wen-Zhe Ho
1*
Division of Immunologic and Infectious Diseases
1and Division of Neurology and Neurology Research,
3Department of
Pediatrics, Joseph Stokes, Jr., Research Institute at the Children’s Hospital of Philadelphia, and Center for AIDS
Research, University of Pennsylvania Medical School,
2Philadelphia, Pennsylvania 19104
Received 30 July 2001/Returned for modification 24 September 2001/Accepted 15 October 2001
We have applied a newly developed real-time reverse transcriptase (RT) PCR (RT-PCR) assay for
quanti-fication of substance P (SP) mRNA expression (the SP real-time RT-PCR assay) in human blood
monocyte-derived macrophages, peripheral blood lymphocytes, and microglia isolated from fetal brain. The SP real-time
RT-PCR assay had a sensitivity of 60 mRNA copies, with a dynamic range of detection between 60 and 600,000
copies of the SP gene transcript per reaction mixture. The coefficient of variation of the threshold cycle number
between the SP real-time RT-PCR assays was less than 1.16%. This assay with an SP-specific primer pair
efficiently recognizes all four isoforms of preprotachykinin A (the SP precursor) gene transcripts. In order to
use this assay to measure the levels of SP mRNA in the human immune cells quantitatively, we designed a
specific probe (molecular beacon) derived from exon 3 of the SP gene. We demonstrated that the real-time
RT-PCR quantitatively detected SP mRNA in the human immune cells, among which the microglia isolated
from fetal brain had the highest levels of SP mRNA. The SP real-time PCR assay yielded reproducible data,
as the intra-assay variation was less than 1%. Thus, it is feasible to apply the real-time RT-PCR assay for
quantification of SP mRNA levels in human immune cells, as well as in other nonneuronal cells. Since SP is
a major modulator of neuroimmunoregulation, this assay has the potential for widespread application for
basic and clinical investigations.
Substance P (SP), a major modulator in
neuroimmunoregu-lation, is the most studied member of the tachykinin peptide
family (2, 22). SP has been described almost exclusively as a
peptide of neural origin (24, 27). SP, however, has also been
identified in nonneuronal cell types, including murine
macro-phages (3, 26), human endothelial cells (20, 23), eosinophils
(1), and Leydig cells of human and mouse testes (4). We have
recently demonstrated that human immune cells (monocytes,
T lymphocytes, and microglia) express the SP gene and the SP
receptor (12, 15, 18).
SP is synthesized from four preprotachykinin A (PPT-A)
mRNAs (
␣
,

,
␥
, and
␦
) (21). These isoforms of mRNA are the
result of alternative mRNA splicing of the primary transcript
of the PPT-A gene (6). The sequence in exon 3 encodes SP,
while the sequence in exon 6 encodes neurokinin A (NKA).
The SP sequence is encoded by all four isoforms (
␣
,

,
␥
, and
␦
) of PPT-A mRNA, whereas the NKA precursor sequence is
present only in

and
␥
PPT-A mRNAs. These four isoforms of
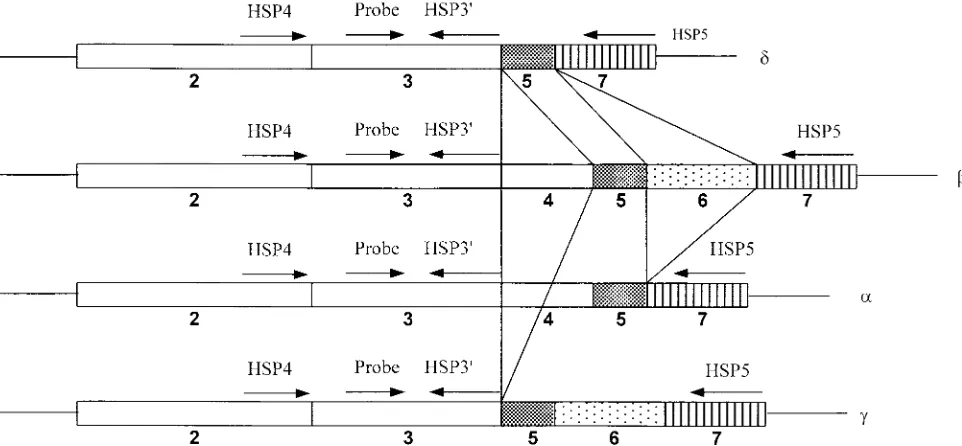
PPT-A mRNA differ in their exon combinations (Fig. 1).

PPT-A mRNA contains all seven exons of the corresponding
gene, while
␣
PPT-A mRNA lacks exon 6,
␥
PPT-A mRNA
lacks exon 4 (14, 25), and
␦
PPT-A mRNA lacks both exon 4
and exon 6 (6, 13).
In an attempt to identify SP gene expression in human
im-mune cells, we have recently characterized the splicing
prod-ucts of the PPT-A gene transcript in human blood monocytes,
monocyte-derived macrophages (MDMs) (12), lymphocytes
(15), and microglia (18) by reverse transcriptase (RT) PCR
(RT-PCR). We then developed a strategy of designing a
spe-cific primer pair (primer pair human SP4 [HSP4]-HSP3) to
amplify SP mRNA-derived cDNA that reflects all four
iso-forms (
␣
,

,
␥
, and
␦
) of PPT-A mRNA transcripts, resulting in
a single 121-bp fragment that can be measured quantitatively
by the SP mimic-based PCR assay (17). Establishment of the
SP mimic-based PCR assay, however, is laborious and needs
several dilutions from 1:10 to 10:1 (its dynamic range) for each
unknown sample in order to determine a target-to-mimic ratio.
Although this assay can determine the number of SP mRNA
transcripts in a sample, the differences in SP mRNA copy
numbers between samples must be twofold or higher. In
addi-tion, the mimic-based PCR quantification involves post-PCR
manipulations which are laborious and time-consuming.
Re-cently, a real-time PCR analysis has been developed (10, 31).
The time PCR method solved these problems with
real-time monitoring of the PCR amplification process. The
mon-itoring of the entire reaction rather than just the end product
permits the quantification to be based on the early, exponential
phase of the reaction. Most importantly, the real-time system
for PCR quantification is a probe-based analysis. The
molec-ular beacon [MB] probe has been reported to be used for the
construction of probes that are critical for real-time detection
of nucleic acid hybridization events (31). Recent studies have
successfully used the MB probe for a variety of real-time PCR
applications (5, 28, 30–32). The MB probe is a single-stranded
nucleic acid molecule that possesses a stem-and-loop structure.
In real-time PCR, the MB probe as well as the primers
hybrid-* Corresponding author. Mailing address: Division of Immunologic
and Infectious Diseases, Children’s Hospital of Philadelphia, 34th &
Civic Center Blvd., Philadelphia, PA 19104. Phone: (215) 590-4462.
Fax: (215) 590-2025. E-mail: [email protected].
138
on August 17, 2020 by guest
http://cvi.asm.org/
ize to the templates during the annealing stage. As the target
strands synthesized in a reaction accumulate, the fraction of
the MB probe that binds to the targets increases, resulting in a
brighter fluorescent signal. Here, we describe a rapid and
re-producible RT-PCR method with specific SP primers and a
probe that allows the quantification of SP mRNA copies in
human immune cells with the ABI Prism 7700 real-time
se-quence detection system (the SP real-time RT-PCR assay).
MATERIALS AND METHODS
Cells.Peripheral blood was obtained from healthy adult donors (ages, 24 to 45 years) recruited locally. The blood samples were identified as human immuno-deficiency virus type 1 antibody negative by anonymous testing by the enzyme-linked immunosorbent assay method (Coulter Immunology, Hialeah, Fla.). In-formed consent was obtained, and the institutional review board of the Children’s Hospital of Philadelphia has approved the present study. Blood was obtained and was used within 4 h of collection. Monocytes were purified by our previously described techniques (7, 9). Freshly isolated monocytes were plated in 24-well culture plates at a density of 106cells/well in Dulbecco modified Eagle
medium containing 10% fetal calf serum. The total length of time in culture for the MDMs was 7 to 10 days. The viabilities of the MDMs were monitored by trypan blue exclusion and cell adherence to the wells. Nonadherent peripheral blood lymphocytes (PBLs) were collected from gelatin-coated flasks, washed three times with phosphate-buffered saline, and cultured in RPMI 1640 medium containing 10% fetal calf serum and 1g of phytohemagglutinin P per ml for 72 h. PBL viability was measured by a cell proliferation assay. Human fetal brain microglia were isolated and cultured as described previously (8, 18). NT-2N cells were derived from Ntera2/cl.D1 (NT2) cells, a human teratocarcinoma cell line, and consisted of⬎95% pure neuronal cells (29). NT-2N cells were used as a positive control for SP mRNA. TheLimulus amebocyte lysate assay demon-strated that all media and reagents were free of endotoxin.
RNA extraction.Total RNA was extracted from MDMs, PBLs (stimulated with phytohemagglutinin P for 72 h), fetal brain microglia, and NT-2N cells (106
cells) with Tri-Reagent (Molecular Research Center, Cincinnati, Ohio), as in-structed by the manufacturer. In brief, the total RNA was extracted in a single step by guanidinium thiocyanate-phenol-chloroform extraction. After centrifu-gation at 13,000⫻gfor 15 min, the RNA-containing aqueous phase was pre-cipitated in isopropanol. The RNA precipitates were then washed once in 75% ethanol and resuspended in 50l of RNase-free water.
Cloning of PPT-A cDNA.The four isoforms of PPT-A mRNA were cloned and identified with primer pairs HSP4-HSP5 and HSP4-HSP7, as reported earlier (16, 17) (Fig. 1). Briefly, the PCR products amplified with these primers were separated on a 4% agarose gel and then purified with a Wizard PCR Preps DNA purification system (Promega, Madison, Wis.). The purified cDNAs of the PPT-A isoforms (␣,,␥,␦) were then cloned into a plasmid with a Eukaryotic TA cloning kit (Invitrogen Corporation, San Diego, Calif.). The cloned plasmids containing the cDNAs of the PPT-A isoforms were then purified with a Wizard Plus Minipreps DNA purification system (Promega). The presence and orienta-tion of the PPT-A isoform inserts were determined by restricorienta-tion analysis by usingEcoRV digestion and DNA sequencing. The purified plasmids were lin-earized byEcoRI restriction enzyme digestion and were purified by phenol-chloroform extraction and alcohol precipitation. These cloned PPT-A isoform-containing plasmids were used as a standard control for determination of the accuracy of the quantitative real-time PCR and as a template for the synthesis of mRNA in vitro to evaluate the sensitivity of the real-time RT-PCR and to make a standard curve for the real-time RT-PCR.
In vitro mRNA synthesis.PPT-A mRNA transcripts were obtained by tran-scription from the plasmid containing the -isoform cDNA insert with a MEGAshortscript kit (Ambion, Austin, Tex.). After digestion with RNase-free DNase (Promega), the resulting RNA transcripts were purified by phenol-chlo-roform extraction and alcohol precipitation as reported previously (16, 17). The purified mRNA was used as a standard to quantitatively measure the SP mRNA transcripts in MDMs, PBLs, and the microglia by the real-time RT-PCR with primer pair HSP4-HSP3⬘.
Design of molecular beacons and primers.The PCR primers and the MB probes used were designed with Primer Express software (PE Applied Biosys-tems) and were synthesized by Integrated DNA Technologies, Inc. (Coralville, Iowa). The HSP4-HSP3⬘primer pair (HSP4, 5⬘-CGACCAGATCAAGGAGGA ACTG-3⬘; HSP3⬘, 5⬘-CAGCATCCCGTTTGCCCATT-3⬘), which is specific for a 121-bp fragment of the SP transcript, was described previously (17), but with modification by the addition of 4 additional nucleotides at the 3⬘end of primer HSP3 (underlined) because of the design obtained with the Primer Express software. The sequences of the primers and the MB probe were selected from the sequences of exons 2 and 3 of the PPT-A gene (16) (Fig. 1) so that they amplify a single cDNA fragment that represents the total SP from transcripts of all four isoforms of PPT-A mRNA (17). The primer pair specific for glyceral-dehyde-3-phosphate dehydrogenase (GAPDH) is 5⬘-GGTGGTCTCCTCTGAC TTCAACA-3⬘ (sense) and 5⬘-GTTGCTGTAGCCAAATTCGTTGT-3⬘ (anti-sense). The sequences of the MB probes specific for SP and GAPDH were designed to be perfectly complementary to the target sequence in exon 3 of the SP gene and to be complementary to the sequence between the sequence of each
FIG. 1. Alternative splicing products of PPT-A mRNA transcripts. Exons 2, 3, 4, 5, 6, and 7 are indicated. Exon 3 encodes SP, and exon 6
encodes NKA. The locations and orientations (arrows) of primers HSP3
⬘
, HSP4, HSP5, and the SP MB probe are indicated.
on August 17, 2020 by guest
http://cvi.asm.org/
primer in the primer pair for GAPDH, respectively. The following are the sequences of the two MB probes: SP, 5⬘-FAM-GCGAGCAGA-ATCGCCCGG AGACCCAAGCGCTCGC-DABCYL-3⬘; GAPDH, 5⬘-FAM-GCGAGCC-TG GCATTGCCCTCAACGACCACGCTCGC-DABCYL-3⬘. The underlined se-quences are the stem sese-quences, FAM is 6-carboxyfluorescein, and DABCYL is 4-(4⬘-dimethylaminophenylaso) benzoic acid. The stem sequences were selected such that they would not complement the sequences within the loop region. The lengths of the MB probes were designed such that the annealing temperature is slightly higher than those for the PCR primers. The MB probes were labeled at the 5⬘end with FAM and the quencher DABCYL at the 3⬘end. The primers and MB probes were resuspended in TE (Tris-EDTA) buffer and stored at⫺30°C. Reverse transcription.Total RNA (1g) was subjected to reverse transcrip-tion with a reverse transcriptranscrip-tion system (Promega) with random primer p(dN)6
(Roche Molecular Biochemicals, Indianapolis, Ind.) and specific primer (anti-sense) HSP5 (5⬘-GCATTGCACTCCTTTCATAAGCCA-3⬘) for 1 h at 42°C. The reaction was terminated by incubation of the reaction mixture at 99°C for 5 min. One-tenth (100 ng) of the resulting cDNA was used as a template for PCR amplification.
Real-time PCR assay.The Perkin-Elmer ABI Prism 7700 sequence detection system was used for real-time analysis. Thermal cycling conditions were designed as follows: initial denaturation at 95°C for 10 min, followed by 45 cycles of 95°C for 15 s and 60°C for 1 min. Fluorescence measurements were recorded during each annealing step. At the end of each PCR run, the data were automatically analyzed by the system and amplification plots were obtained. For each PCR, 2 l of cDNA template was added to 48l of the PCR master mixture (5l of 1⫻ PCR buffer II, 5 mM MgCl2, 300 nM deoxynucleoside triphosphates, 400 nM
each primer, 1.5 U of AmpliTaq Gold DNA polymerase, 400 nM MB probes, 24.7l of water). The PCR buffer contained 5-carboxy-X-rhodamine (ROX) (500 nM) as the reference dye for normalization of the reactions. Any possible fluctuations in the ROX signal are used to correct the sample signal. All ampli-fication reactions were performed in duplicate. To control for the recovery of intact cellular RNA and for the uniform efficiency of each reverse transcription reaction, a GAPDH fragment was amplified by real-time RT-PCR on the same plate as that with SP cDNA. A standard curve was generated with 10-fold dilutions of total RNA quantified with a spectrophotometer. The final results were expressed as the mean number of copies of SP mRNA per microgram of total RNA. In order to prepare a standard curve for SP mRNA, 10-fold serial dilutions of-isoform PPT-A RNA transcripts ranging from 6⫻101to 6⫻106
copies/2l were amplified.
Amplification efficiency.The efficiency of real-time amplification was deter-mined by running a standard curve with serial dilutions of a known amount of cloned SP plasmid cDNA. A PCR that amplifies the target sequence with 100% efficiency (E) can double the amount of PCR products in each cycle. The amount of PCR products (Y) from input target molecules (Z) afterncycles can be calculated by the formulas⫽ ⫺1/log(1⫹E) (wheresis the slope), and after transformation,Eis equal to 101/⫺s⫺1 (19).
RESULTS
Sensitivity of real-time RT-PCR.
The analytical sensitivity of
the real-time RT-PCR was determined with a series of
dilu-tions of PPT-A

-isoform RNA transcripts containing 0, 6
⫻
10
1, 6
⫻
10
2, 6
⫻
10
3, 6
⫻
10
4, 6
⫻
10
5, and 6
⫻
10
6molecules.
Each assay was performed five times, in duplicate. The
real-time RT-PCR could detect as few as 6 SP mRNA copies,
although the detection rate was only 60% (6 of 10 replicates)
(data not shown). The detection rate, however, was 100% for
PPT-A mRNA copy numbers of 60 or higher (10 of 10
repli-cates). The detection limit, therefore, was 60 RNA molecules
per reaction mixture. A representative result is shown in Fig. 2.
Linearity, range of quantification, and precision.
Amplifi-cation of PPT-A

-isoform RNA transcripts at different
con-FIG. 2. Sensitivity and linearity of real-time RT-PCR with RNA
transcripts derived from plasmid with

-isoform mRNA. A reading of
the change in fluorescence (Rn) as a function of the cycle number is
demonstrated for a range of known input numbers of copies of the SP
RNA transcript. Tenfold serial dilutions of the RNA starting from 60
to 6
⫻
10
6molecules per reaction mixture were amplified by the
real-time RT-PCR. (A) Standard curve of serial dilutions of SP RNA
(
R
2⫽
0.98). (B) Amplification plot of serial dilutions of SP RNA
showing the dynamic detection range of 6 orders of magnitude from 60
to 6
⫻
10
6molecules and the sensitivity of detection of 60 SP mRNA
copies per reaction mixture. NC, negative control which lacked
PCR-amplified product when RT was omitted from the reverse transcription
reaction with 6
⫻
10
6molecules of SP mRNA transcripts.
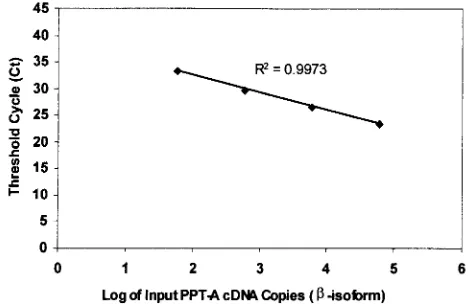
FIG. 3. Standard curves of PPT-A

-isoform plasmid cDNA. The
curve was made on the basis of the data from Table 1, and the
C
Tvalues are the means for five runs. Tenfold serial dilutions of the
cDNA ranging from 60 to 6
⫻
10
4copies per reaction mixture were
amplified by the real-time PCR. The correlation coefficient was 0.9973.
on August 17, 2020 by guest
http://cvi.asm.org/
centrations showed linearity over a range of 6 orders of
mag-nitude (Fig. 2), and
R
2was 0.98. In order to determine the
variations in repetitive measurements of the real-time PCR
between different runs, 10-fold serial dilutions of PPT-A

-iso-form cDNA-containing plasmids (range, 6
⫻
10
1to 6
⫻
10
4copies per reaction mixture) were examined by real-time PCR
in five different experiments. The coefficients of variation
(CVs) of the values of the threshold cycle number (
C
T)
be-tween runs were bebe-tween 0.54 and 1.16% (Table 1 and Fig. 3).
The intrarun CV was even lower than the interassay CV (data
not shown).
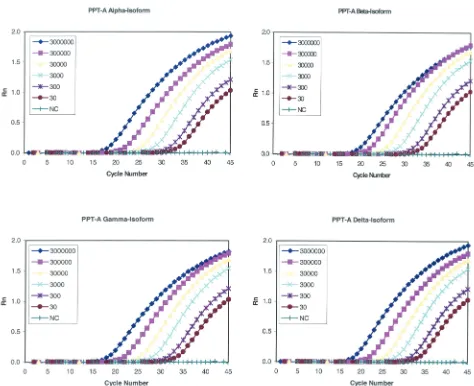
Amplification efficiency of different isoforms of PPT-A gene.
In order to determine whether SP can be amplified from
tran-scripts of all four isoforms of PPT-A mRNA by the real-time
PCR with similar efficiencies, each of the four plasmids that
contained the PPT-A
␣
,

,
␦
, and
␥
isoform sequences,
respec-tively, was used as a template for the real-time PCR. As shown
in Fig. 4 and Table 2, the SP sequence was efficiently amplified
by the real-time PCR from plasmids containing all four
iso-forms of PPT-A. The slopes of the four curves were generated
to compare the efficiencies of amplification among the four
isoforms of PPT-A cDNA. The efficiencies of the PCR
ampli-fications for these isoforms were between 98 and 110% (Table 2).
FIG. 4. Real-time PCR amplification plot of the four isoforms of PPT-A cDNA. A reading of a change in fluorescence (Rn) as a function of
the cycle numbers is demonstrated for a range of known input copy numbers of plasmids containing the four isoforms of PPT-A. Tenfold serial
dilutions of the four plasmids were amplified. The input amounts of targets were 30 to 3
⫻
10
6copies per reaction mixture for plasmids containing
the
␣
,

,
␥
, and
␦
isoforms of PPT-A, as indicated. NC, negative control, which lacked PCR-amplified product when the template was omitted.
TABLE 1. Reproducibility of SP real-time PCR assay
aRun CTfor the following no. of input copies
b:
60 600 6,000 60,000
1
33.38
29.94
26.37
23.05
2
33.44
29.72
26.56
23.46
3
33.97
29.68
26.27
23.58
4
33.45
29.58
26.60
22.70
5
32.88
29.36
26.56
23.42
Mean
⫾
SD 33.42
⫾
0.38 29.66
⫾
0.21 26.47
⫾
0.14 23.44
⫾
0.24
CV(%)
1.16
0.71
0.54
1.05
aThe data are for five separate assays performed on different days. bInput numbers of copies of plasmid DNA with theisoform of PPT-A.
on August 17, 2020 by guest
http://cvi.asm.org/
Real-time RT-PCR detection of SP mRNA.
In order to
mea-sure the expression of SP mRNA in NT-2N cells, MDMs,
PBLs, and microglia, total RNAs isolated from these cells from
different healthy donors and a brain specimen were reverse
transcribed. The cDNAs were then amplified by the real-time
PCR with the specific primers and MB probes. MDMs, PBLs,
and the microglia expressed SP mRNA transcripts, as shown in
Table 3. As expected, the neuronal (NT-2N) cells express
much higher levels of SP mRNA than human immune cells.
The cultured fetal brain-derived microglia expressed higher
levels of SP mRNA compared with the amount expressed by
blood MDMs (Table 3). In order to prove the reproducibility
of the SP real-time PCR assay with these immune cells, four
cDNA samples from each cell type (PBLs, MDMs, microglia,
and NT-2N cells) were run in the assay. The data in Table 4
demonstrate that the SP real-time PCR has excellent
repro-ducibility, with an intra-assay variability of less than 1%.
DISCUSSION
We have recently identified and characterized four isoforms
(
␣
,

,
␥
, and
␦
) of PPT-A mRNA in human immune cells (12,
15, 16, 18). In order to determine the total SP mRNA
tran-script levels, we developed a mimic-based PCR to amplify SP
mRNA from all four isoforms of PPT-A mRNA transcripts in
a single cDNA product with the HSP4-HSP3 primer pair (17).
The HSP3 primer sequence is from within the exon 3 sequence
of the SP gene (16) (Fig. 1). However, quantification of SP
mRNA levels by the mimic-based PCR can be problematic due
to the exponential nature of PCR analyses, since small
varia-tions in amplification efficiency can lead to dramatic changes in
product yields, which obscures differences in the levels of SP
mRNA during amplification. This is particularly true for the
quantification of low levels of SP mRNA in human immune
cells. In the present study, we have successfully used the
real-time PCR for the quantification of SP mRNA in human
MDMs, PBLs, and microglia (Table 3). The microglia had the
highest levels of SP mRNA transcripts among the three types
of cells tested, which is in agreement with our previous
com-parisons with these cell types by mimic-based PCR (18).
The ability to monitor the real-time progress of the
ampli-fication completely revolutionizes the PCR-based
quantifica-tion of DNA and RNA. In real-time PCR, reacquantifica-tions are
char-acterized by the point in time during cycling when the
amplification of a PCR product is first detected rather than the
amount of PCR product accumulated at the end of the entire
PCR process. The higher the numbers of copies of the nucleic
acid target at the start of the reaction, the sooner a significant
increase in fluorescence is observed (11) and the lower the
C
Tvalue is. Real-time PCR allows the
C
Tvalue to be observed
when the PCR amplification is still in the exponential phase.
Therefore, the
C
Tvalue is a more reliable measurement of the
number of copies of mRNA or DNA at the start of the
reac-tion.
Thus, we have developed an MB probe-based real-time
RT-PCR assay for the quantification of SP mRNA copy numbers in
human immune cells. We designed an SP-specific MB probe
and a pair of SP-specific primers to target the sequence of a
single cDNA fragment that reflects total SP mRNA from all
four isoforms of PPT-A mRNA. Since it has a wide dynamic
detection range (6
⫻
10
1to 6
⫻
10
5copies per reaction), there
is no need to dilute or concentrate the samples, which was one
of the problems encountered with the mimic-based SP PCR
(17). This SP MB-based RT-PCR is much less cumbersome,
and the costs associated with the use of this system are the
same as those associated with the use of the regular RT-PCR.
Because this system allows processing of multiple samples with
minimal labor time, the risk of carryover contamination due to
post-PCR sample manipulation is minimal. In addition, this
assay is highly specific, since the assay uses both specific
prim-ers and a probe (the MB probe) to identify SP mRNA
tran-scripts in human immune cells. The SP MB probe-based
real-time PCR has an excellent reproducibility (Tables 1 and 4).
Furthermore, all four isoforms of PPT-A cDNA in cloned
plasmids were efficiently amplified by the SP real-time PCR
assay (Fig. 4; Table 2). Although the SP real-time PCR assay
that we have developed can amplify cDNA that reflects
tran-scripts of all four isoforms of SP mRNA, it is not feasible to
amplify a transcript of a particular SP mRNA isoform. This
limitation is due to the PPT-A genome structure and the
com-bination of the seven exons for each isoform of PPT-A mRNA
(Fig. 1) (17). However, the assay with different primer pairs has
the ability to amplify mRNA of the PPT-A
␣
and
␦
isoforms or
mRNA of the

and
␥
isoforms (17).
TABLE 2. Amplification efficiencies and slopes for four isoforms of
PPT-A
PPT-A isoform % Efficiency Slope R2
␣
103
3.25
0.9995

98
3.37
0.9991
␥
101
3.29
0.9988
␦
110
3.10
0.9983
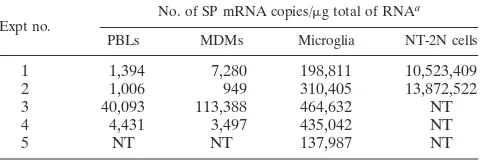
TABLE 3. Quantification of SP mRNA in human immune cells
Expt no. No. of SP mRNA copies/g total of RNA
a
PBLs MDMs Microglia NT-2N cells
1
1,394
7,280
198,811
10,523,409
2
1,006
949
310,405
13,872,522
3
40,093
113,388
464,632
NT
4
4,431
3,497
435,042
NT
5
NT
NT
137,987
NT
aHuman immune cells (PBLs, MDMs, and microglia) were from five different
samples. The SP mRNA levels were normalized on the basis of the SP mRNA/ GAPDH mRNA ratio obtained by the real-time PCR. NT, not tested.
TABLE 4. Intra-assay reproducibility of SP real-time PCR assay
aRepetition CT
PBLs MDMs Microglia NT-2N cells
1
39.71
39.78
30.86
26.0
2
39.82
39.67
30.86
25.65
3
39.75
39.55
30.75
25.67
4
39.80
39.51
30.81
25.58
Mean
⫾
SD 39.77
⫾
0.05 39.63
⫾
0.12 30.82
⫾
0.05 25.73
⫾
0.19
CV (%)
0.12
0.31
0.17
0.73
aFour cDNA samples from each cell type (PBLs, MDMs, microglia, and
NT-2N cells) were amplified by the SP real-time PCR assay.
on August 17, 2020 by guest
http://cvi.asm.org/
In summary, we have successfully used a newly developed
MB probe-based RT-PCR assay to quantitatively measure the
total levels of SP mRNA transcripts in both human neural cells
and immune cells. Our data demonstrate that this method is
precise, sensitive, highly reproducible, and particularly useful
for the quantification of SP mRNA levels in nonneuronal cells
that have very low levels of expression of the SP gene. This
method has the potential for widespread application in basic
and clinical studies in neuroimmunology.
ACKNOWLEDGMENTS
This work was supported by NIH grant MH 49981 (to S.D.D.) and
NIH grant DA12815 (to W.-Z.H.).
REFERENCES
1.Aliakbari, J., S. P. Sreedharan, C. W. Turck, and E. J. Goetzl.1987. Selective localization of vasoactive intestinal peptide and substance P in human eo-sinophils. Biochem. Biophys. Res. Commun.148:1440–1445.
2.Black, P. H.1994. Immune system-central nervous system interactions: effect and immunomodulatory consequences of immune system mediators on the brain. Antimicrob. Agents Chemother.38:7–12.
3.Bost, K. L., S. A. Breeding, and D. W. Pascual.1992. Modulation of the mRNAs encoding substance P and its receptor in rat macrophages by LPS. Reg. Immunol.4:105–112.
4.Chiwakata, C., B. Brackmann, N. Hunt, M. Davidoff, W. Schulze, and R. Ivell.1991. Tachykinin (substance-P) gene expression in Leydig cells of the human and mouse testis. Endocrinology128:2441–2448.
5.Giesendorf, B. A., J. A. Vet, S. Tyagi, E. J. Mensink, F. J. Trijbels, and H. J. Blom.1998. Molecular beacons: a new approach for semiautomated muta-tion analysis. Clin. Chem.44:482–486.
6.Harmar, A. J., V. Hyde, and K. Chapman.1990. Identification and cDNA sequence of delta-preprotachykinin, a fourth splicing variant of the rat sub-stance P precursor. FEBS Lett.275:22–24.
7.Hassan, N. F., D. E. Campbell, and S. D. Douglas.1986. Purification of human monocytes on gelatin-coated surfaces. J. Immunol. Methods95:273– 276.
8.Hassan, N. F., D. E. Campbell, S. Rifat, and S. D. Douglas.1991. Isolation and characterization of human fetal brain-derived microglia in in vitro cul-ture. Neuroscience41:149–158.
9.Hassan, N. F., J. R. Cutilli, and S. D. Douglas.1990. Isolation of highly purified human blood monocytes for in vitro HIV-1 infection studies of monocyte/macrophages. J. Immunol. Methods130:283–285.
10.Heid, C. A., J. Stevens, K. J. Livak, and P. M. Williams.1996. Real time quantitative PCR. Genome Res.6:986–994.
11.Higuchi, R., C. Fockler, G. Dollinger, and R. Watson.1993. Kinetic PCR analysis: real-time monitoring of DNA amplification reactions. Bio/Technol-ogy11:1026–1030.
12.Ho, W. Z., J. P. Lai, X. H. Zhu, M. Uvaydova, and S. D. Douglas.1997. Human monocytes and macrophages express substance P and neurokinin-1 receptor. J. Immunol.159:5654–5660.
13.Khan, I., and S. M. Collins.1994. Fourth isoform of preprotachykinin mes-senger RNA encoding for substance P in the rat intestine. Biochem. Biophys. Res. Commun.202:796–802.
14.Krause, J. E., J. M. Chirgwin, M. S. Carter, Z. S. Xu, and A. D. Hershey. 1987. Three rat preprotachykinin mRNAs encode the neuropeptides sub-stance P and neurokinin A. Proc. Natl. Acad. Sci. USA84:881–885. 15.Lai, J.-P., S. D. Douglas, and W.-Z. Ho.1998. Human lymphocytes express
substance P and its receptor. J. Neuroimmunol.86:80–86.
16.Lai, J. P., S. D. Douglas, E. Rappaport, J. M. Wu, and W. Z. Ho.1998. Identification of a delta isoform of preprotachykinin mRNA in human mononuclear phagocytes and lymphocytes. J. Neuroimmunol.91:121–128. 17.Lai, J. P., S. D. Douglas, M. Zhao, and W. Z. Ho.1999. Quantification of
substance P mRNA in human mononuclear phagocytes and lymphocytes using a mimic-based RT-PCR. J. Immunol. Methods230:149–157. 18.Lai, J. P., G. X. Zhan, D. E. Campbell, S. D. Douglas, and W. Z. Ho.2000.
Detection of substance P and its receptor in human fetal microglia. Neuro-science101:1137–1144.
19.Leutenegger, C. M., J. Higgins, T. B. Matthews, A. F. Tarantal, P. A. Luciw, N. C. Pedersen, and T. W. North.2001. Real-time TaqMan PCR as a specific and more sensitive alternative to the branched-chain DNA assay for quan-titation of simian immunodeficiency virus RNA. AIDS Res. Hum. Retrovir. 17:243–251.
20.Linnik, M. D., and M. A. Moskowitz.1989. Identification of immunoreactive substance P in human and other mammalian endothelial cells. Peptides 10:957–962.
21.MacDonald, M. R., D. W. McCourt, and J. E. Krause.1988. Posttransla-tional processing of alpha-, beta-, and gamma-preprotachykinins. Cell-free translation and early posttranslational processing events. J. Biol. Chem. 263:15176–15183.
22.McGillis, J. P., M. Mitsuhashi, and D. G. Payan.1990. Immunomodulation by tachykinin neuropeptides. Ann. N. Y. Acad. Sci.594:85–94.
23.Milner, P., V. Ralevic, A. M. Hopwood, E. Feher, J. Lincoln, K. A. Kirk-patrick, and G. Burnstock.1989. Ultrastructural localisation of substance P and choline acetyltransferase in endothelial cells of rat coronary artery and release of substance P and acetylcholine during hypoxia. Experientia45:121– 125.
24.Nakanishi, S.1987. Substance P precursor and kininogen: their structures, gene organizations, and regulation. Physiol. Rev.67:1117–1142.
25.Nawa, H., H. Kotani, and S. Nakanishi.1984. Tissue-specific generation of two preprotachykinin mRNAs from one gene by alternative RNA splicing. Nature312:729–734.
26.Pascual, D. W., and K. L. Bost.1990. Substance P production by P388D1 macrophages: a possible autocrine function for this neuropeptide. Immunol-ogy71:52–56.
27.Pernow, B.1983. Substance P. Pharmacol. Rev.35:85–141.
28.Piatek, A. S., S. Tyagi, A. C. Pol, A. Telenti, L. P. Miller, F. R. Kramer, and D. Alland.1998. Molecular beacon sequence analysis for detecting drug resistance in Mycobacterium tuberculosis. Nat. Biotechnol.16:359–363. 29.Pleasure, S. J., C. Page, and V. M. Lee.1992. Pure, postmitotic, polarized
human neurons derived from NTera 2 cells provide a system for expressing exogenous proteins in terminally differentiated neurons. J. Neurosci. 12: 1802–1815.
30.Tyagi, S., D. P. Bratu, and F. R. Kramer.1998. Multicolor molecular beacons for allele discrimination. Nat. Biotechnol.16:49–53.
31.Tyagi, S., and F. R. Kramer.1996. Molecular beacons: probes that fluoresce upon hybridization. Nat. Biotechnol.14:303–308.
32.Vet, J. A., A. R. Majithia, S. A. Marras, S. Tyagi, S. Dube, B. J. Poiesz, and F. R. Kramer.1999. Multiplex detection of four pathogenic retroviruses using molecular beacons. Proc. Natl. Acad. Sci. USA96:6394–6399.