1 Title page
Changes in expression of genes representing key biological processes after
neoadjuvant chemotherapy in breast cancer, and prognostic implications in
residual disease
Marie Klintman1,2, Richard Buus1,3, Maggie Cheang4, Amna Sheri5, Ian Smith5, and Mitch Dowsett1,3,5
1Academic Department of Biochemistry, Royal Marsden Hospital, London, United Kingdom 2Department of Clinical Sciences, Division of Oncology and Pathology, Lund University, Lund, Sweden
3Breakthrough Breast Cancer Research Centre, The Institute of Cancer Research, London, United Kingdom
4 Clinical Trials and Statistics Unit, The Institute of Cancer Research, London, United Kingdom 5 Breast Unit, Royal Marsden Hospital, London, United Kingdom
Running title: neoadjuvant chemotherapy: expression changes and prognosis
Key words: neoadjuvant chemotherapy, residual disease, chemotherapy resistance, residual disease prognosis
2 Corresponding author: Marie Klintman, Academic Department of Biochemistry, Royal Marsden Hospital, Fulham Rd, London SW3 6JJ, UK, phone: +46 (0) 730929096, fax: +44 (0) 207 376 3918, e-mail: [email protected].
Conflict of interest: The authors declare no conflict of interest
3 Translational relevance
Neoadjuvant chemotherapy offers estimation of treatment response as well as assessment of long term prognosis. In this study expression of 24 genes representing key biological processes was quantified in 126 residual tumours and 56 paired biopsies. Chemotherapy induced significant up- or downregulation of most genes, and in residual disease 14 genes representing proliferation, stromal activation, metabolism, apoptosis, stemcellness and Ras-ERK-activation predicted prognosis, suggesting a biological role in chemoresistant disease. In ER+/HER2- patients, ACACB, ERBB2, and PAWR, and in ER-/HER2- patients CD3D and PAWR, respectively,
independently predicted prognosis. Multivariable gene models, providing prognostic information independently of ER-, PgR-, and HER2-status in all patients, and in ER+/HER2- patients, were also identified. Taken together, expression of the majority of the 24 genes was affected by chemotherapy, and most were also prognostic in residual disease. The multivariable gene models could, if validated, be used to identify patients needing additional post-neoadjuvant treatment to improve prognosis.
Abstract
4 Patients and methods: Expression levels of 24 genes were quantified by NanoString nCounter on formalin-fixed paraffin-embedded residual tumours from 126 patients treated with NAC and 56 paired presurgical biopsies. Paired t-test was used for testing changes in gene expression, and Cox regression and penalised elastic-net Cox Regression for estimating hazard ratios.
Results: After NAC, 12 genes were significantly up- and 8 downregulated. Fourteen genes were significantly associated with time to recurrence in univariable analysis in residual disease. In a multivariable model ACACB, CD3D, MKI67, and TOP2A added prognostic value independent of clinical ER-, PgR-, and HER2-status. In ER+/HER2- patients ACACB, PAWR, and ERBB2 predicted outcome, whereas CD3D and PAWR were prognostic in ER-/HER2- patients. By use of elastic-net analysis, a 6-gene signature (ACACB, CD3D, DECORIN, ESR1, MKI67, PLAU)
was identified adding prognostic value independent of ER, PgR, and HER2.
5 Background
Tumour cells remaining after chemotherapy may be intrinsically resistant to chemotherapy and represent the disease which may later recur. There has, therefore, been an increasing interest in identifying genes/pathways enriched or depleted in residual tumours which may eventually be targetable and used for selection of patients to include in clinical trials on new drugs. Evidence for the clinical importance of these features may be obtained by establishing their long-term prognostic value, but this has been addressed infrequently, and many reports have focused on TNBC patients only, for whom no targetable treatment option is currently available.
Neoadjuvant chemotherapy (NAC) offers the possibility of in vivo assessments of treatment response and increases the rates of breast conserving surgery. It has increased in breast cancer, as it has been proven equally effective as adjuvant treatment. Biological studies of residual disease after chemotherapy are much more straightforward in NAC than in metastatic disease because of ready access to biopsy tissue.
6 in identifying patients with a poorer outcome who might be considered for inclusion in clinical studies with further treatment after surgery to improve outcome.
The aims of the present study were to determine whether there was clinical evidence for the involvement of one or more from a panel of candidate genes in chemotherapy resistance. We determined this by studies of changes of gene expression on treatment, as well as the impact on long-term prognosis in a cohort including both ER+ and ER- patients treated with NAC. The genes were chosen from literature review on the basis of their being identified as (i) possible prognostic factors in residual disease at protein (4, 6-10) or mRNA level (11), (ii) as significantly up- or downregulated, but of unknown prognostic value in residual disease (12-20), (iii) as predictive of chemotherapy resistance (6, 11, 16, 19, 21-29), and/or (iv) identified as possible prognostic factors over several previous datasets (26, 30-41). In addition to the previously established prognostic factors ESR1 and ERBB2, the genes were also chosen to represent different
pathways and biological processes of known implication in tumour progression or response to therapy, such as stemcellness (ALDH1A1, CD44, STAT3), proliferation (TOP2A, MKI67, AURKA), apoptosis (BCL2, BCL2L1, PAWR), immunological response (CD3D, CXCL13, STAT1), epithelial-to-mesenchymal transition (EMT) (SNAI1, SNAI2, SOX9, TWIST), stromal activation (DECORIN, SPARC, PLAU), energy metabolism (ACACB, LDHB), and ERK/Ras activation (DUSP 4). Changes in gene expression in response to NAC, as well as the long term
prognostic value of gene expression in residual disease in all patients, and in subgroups based on ER- and HER2-status were chosen as endpoints.
Material and Methods
7 The 126 patients in the present study were derived from a previously described cohort from a study on the prognostic value of Ki67 in addition to RCB in residual disease after NAC (5). That study included 220 T1-4, N0/+, M0 patients who between 2001 and 2010 received NAC followed by surgery at the Royal Marsden Hospital. Patients were excluded from further analysis due to (i) pCR (n=49), (ii) insufficient tumour due to low cellularity (n=31), (iii) unavailability of tumour blocks (n=11), or (iv) insufficient RNA yield (n=3), see REMARK flow-chart, Supplementary Figure S1. Of the remaining 126 patients, 56 also had a paired pre-surgical biopsy available with sufficient tumour available for RNA extraction, taken at the time of diagnosis before start of chemotherapy. Details on treatments and baseline patient and tumour characteristics can be found in Table 1. The median follow-up for the end-point time to recurrence (TTR) for patients alive and free from relapse at the last review of the patients´ records was 4.1 years.
Methods
Pathological assessment of the biopsies and residual tumour tissue
8 Tissue macrodissection and mRNA extraction
To identify samples and areas of interest for mRNA extraction, a 4 m section from the residual surgical FFPE block was stained with H&E, and areas with ≥40% invasive tumour cells were outlined. One to six consecutive 8 m sections were cut on to slides, baked overnight at 37 degrees and stained with a 1% solution of Nuclear Fast Red (NFR) (Sigma). The areas marked out on the H&E were identified on the NFR-stained sections, needle macrodissected, and collected into an RNAse free tube. Nucleic acid purification was performed using RecoverAll kit (Ambion) according to the manufacturer’s instructions, quantified by QubitRNA BR Assay kit (both Life Technologies) and stored at -20C.
Gene expression profiles: NanoString nCounter analysis and data processing
Expression of the 24 genes of interest (Supplementary Table S1) was assessed as part of a panel of 82 genes in which the other 58 were assessed for separate reasons and not considered
further in this study other than for the purposes of analytical normalisation. Fifty to 100
nanogram total RNA was analysed using a NanoString nCounter. Expression data was normalised with custom scripts in R. Background correction was done by subtracting the mean of the 8 negative control probes. Expression values were normalised with the three housekeeping genes that had the highest correlation amongst the housekeeping genes (ACTB, MPRL19, and TFRC). Expression values were log2 transformed and standardised within each sample. The 24
9 Statistics
10 selecting 6 genes: alpha=0.75, lambda=exp(−2.52777075921403); for the ER+/HER2- population selecting 4 genes: alpha=0.55; lambda=exp(−1.90897735668831).
Pearson´s and Spearman´s correlation tests were used to test the associations between clinical factors and/or genes, and paired t-test to assess changes in gene expression between presurgical biopsies and residual tumours. For analyses of gene expression patterns in residual disease, unsupervised two-way hierarchical clustering was performed by applying Pearson correlation and the Ward linkage method. All p-values correspond to two-sided tests and, unless otherwise stated, p<0.05 was considered significant. The statistical calculations were performed using the R 2.15 version.
Results
Patient and tumour characteristics
11 majority (64%) also received neoadjuvant taxanes. According to local practice at the time, before the routine use of neoadjvant taxanes, a proportion of patients treated with neoadjuvant anthracyclines went on to receive adjuvant taxane chemotherapy following surgery (14%). Forty-eight% of the patients were treated with breast conserving surgery.
Correlations
Details of the gene set selected can be found in Supplementary Table S1. A correlation matrix of associations between the 24 genes and the IHC assessments of presurgical ER, HER2, and residual Ki67 can be found as Supplementary Figure S2. Residual IHC Ki67 was positively correlated with the expression of other proliferation genes and LDHB, and negatively correlated with IHC ER, ESR1, ACACB, ALDH1A1, BCL2, DECORIN, and TWIST, with the opposite
correlation pattern for the same genes found for presurgical IHC ER.
Changes in gene expression following neoadjuvant chemotherapy
12 expression of ESR1, ERBB2, or the immune-related genes CD3D and CXCL13 (Table 2).
Seventeen of these 20 genes were similarly significantly up- or downregulated in the ER+/HER2- patients (see Table 2). However, in the ER-/HER2-group, only SNAI2 and STAT1 changed
significantly after chemotherapy (data not shown).
Gene expression patterns in residual disease
A heat map visualising the gene expression patterns in a dendrogram of the 24 genes in the 126 residual tumours was determined after unsupervised clustering is shown in Figure 1. The first cluster consists of mainly ER-, HER2- tumours with high residual Ki67, and in this cluster of 41 tumours the majority of relapses can be found (n=27). The cluster is characterised by overexpression of proliferation genes (MKI67, AURKA, TOP2A), and LDHB (indicating a glycolytic phenotype), the EMT genes SOX9 and SNAI1, and low expression of ESR1, ACACB (indicating an increase in fatty acid oxidation), BCL2, BCL2L1, the EMT genes TWIST and SNAI2, ALDH1A1, DUSP4 (indicating increased Ras-ERK activation), and DECORIN. In the
other three clusters the majority of tumours are ER-positive, have lower residual Ki67 levels, and fewer relapses. This is reflected in an expression pattern reverse to the first cluster with lower expression levels of proliferation genes, and higher expression levels of ESR1 and genes strongly associated to ESR1.
13 significantly associated with TTR (Table 3). The strongest HRs were found for AURKA (HR 5.2, 95%CI:1.9-14, p=0.001), LDHB (HR 4.1, 95%CI:2.0-8.1 p<0.0001), MIK67 (HR 3.9 95%CI: 2.3-6.7, p<0.0001), DECORIN (HR 0.28, 95%CI: 0.17-0.48, p<0.0001), BCL2 (HR 0.29, 95%CI: 0.17-0.49, p<0.0001), and ACACB (HR 0.32, 95%CI: 0.22-0.48, p<0.0001), (Table 3,
Figures 2a-f).
When dividing the gene expressions into tertiles, there were significant differences in 5-year TTR (log 1st tertile vs 2nd+3rd tertiles, log rank test) for ACACB (p<0.0001), ALDH1A1 (p=0.00018), BCL2 (p<0.0001), DECORIN (p<0.0001), ESR1 (p<0.0001), and MIK67 (highest 1st tertile vs
2nd+3rd tertiles, p<0.0001), Figures 2a-f, but also AURKA, BCL2L1, CD44, DUSP4, ERBB2, LDHB, TOP2A, and TWIST (Supplementary Figures 3a-x). Notably there was a clear threshold effect for the expression levels of ESR1 and the proliferation genes, especially MIKI67. A similar
pattern with threshold effects could be seen only for genes which were strongly correlated to either ESR1 or MIKI67 (ACACB, ALDA1, AURKA, TOP2A, BCL2, DECORIN, DUSP4, LDHB and TWIST), with no such effect found for genes with a weaker correlation to either MIKI67 or ESR1.
14 prognostic effect was seen for PAWR in ER+/HER2- and ER-/HER2- disease (interaction term
HR 0.018, 95%CI: 0.002-0.19, p<0.001).
Relationship between gene expression in residual disease and prognosis: Multivariable analyses
Firstly a fixed multivariable model incorporating clinical factors of previously known prognostic value (ER, PgR, and HER2) was adjusted for one gene at a time for the 118 patients who had data available for all three clinical factors. In this model, MIK67 (HR 3.4, 95%CI:1.6-7.3,
p=0.002), ACACB (HR 0.37, 95%CI:0.20-0.70 p=0.002), TOP2A (HR 2.2, 95%CI:1.2-4.2 p=0.018) and CD3D (HR 0.56, 95%CI:0.31-0.92 p=0.024) added independent prognostic value, (Table 4). As an exploratory analysis, residual IHC Ki67 was added to form an IHC4 model, and the findings were similar, with added prognostic information found for ACACB but also a retained prognostic value of MIK67 (Supplementary Table S2).
For identifying genes in residual disease predictive of long term prognosis in multivariable models in (i) all patients (n=126), as well as in the largest subgroup, (ii) the ER+/HER2- patients (n=78), the elastic net Cox regression was used. In all patients, six genes with a non-zero regression coefficient were selected: ACAB, CD3D, DECORIN, ESR1, MIK67, and PLAU, predictive of
15 ERBB2, MIK67, and PAWR predictive of TTR with a c-index of 0.71 in a multivariable Cox
regression model (data not shown).
A statistically significant association was found between protein and mRNA expression of CD3D
in the ER-/HER2- subset (n=32, p=0.008) supporting the possibility of a functional association, Supplementary Figure S4.
Discussion
The characteristics of the tumour cells surviving NAC are of major interest as they enable the study of changes in biological processes in response to chemotherapy and chemotherapy resistance, may represent the features of disease which may later recur, and are likely to provide information relevant to the long-term prognosis of patients with residual disease. Today as increasing numbers of patients are offered NAC, new prognosticators correctly identifying patients with an inferior prognosis in need of additional therapy after NAC is much needed. In this study we therefore sought to examine genes in residual disease and paired biopsies, representing different biological pathways with previously published implications for breast cancer prognosis or resistance to chemotherapy. Their relationship with long-term prognosis was examined to provide further support for their clinical relevance and to assess their potential for incorporation as a predictor of risk of recurrence. The prognostic value in subgroups based on ER- and HER2-status and multivariable models were considered secondary endpoints.
16 unchanged. As expected, the proliferation genes were all downregulated, consistent with proliferating tumour cells being more responsive to chemotherapy. However, tumours with high residual proliferation rates had a significantly worse long-term prognosis, with AURKA, TOP2A,
and MKI67 all conferring prognostic information, validating previous results of the strong negative impact of high residual Ki67 alone (4) or as part of the RCB (5). Notably, there was an apparent threshold effect for MIKI67, with a probability of remaining relapse-free at 5-years of 37%, compared with 84% for the highest and lowest tertiles, respectively. MKI67 and TOP2A
also added prognostic value independent of clinical ER, PgR, and HER2-status in multivariable models predictive of long-term outcome in all patients, as well as in ER+/HER2- patients. Interestingly, IHC Ki67 and MIK67 were strongly correlated, but in an exploratory fixed model incorporating clinical ER, PgR, HER2, and IHC Ki67, MKI67 still added independent
prognostic value to this model. Thus, while highly proliferative cells and tumours are more sensitive to chemotherapy, the persistence of highly proliferative cells in the face of chemotherapy is associated with very poor outcome.
The stroma-associated genes DECORIN and SPARC were significantly upregulated after NAC, and high residual DECORIN was a strong predictor of improved outcome. The positive prognostic value of DECORIN found here in residual disease, as well as previously in primary
ER-disease (30), could be explained by in vitro studies in which the proteoglycan decorin acts as a potent inhibitor of proliferation by interacting with transforming growth factor-β, epidermal growth factor receptor, insulin-like growth factor receptor, and low density lipoprotein receptor-related protein (43). Moreover, DECORIN was chosen to represent an activated stroma in the
17 High levels of PLAU and the corresponding protein u-PA, needed for breakdown of the
extracellular matrix, have been associated with prediction of benefit of adjuvant chemotherapy and worse outcome (23, 44), and in the present data set a similar trend with a better outcome for low levels of PLAU was found. None of the stromal genes retained independent prognostic value
in the multivariable models, which may be due to the strong correlation found with ER-status.
Genes associated with reprogramming of energy metabolism, one of the hallmarks of cancer, were represented by LDBH and ACACB; both were upregulated after NAC and significantly associated with survival. High residual levels of LDHB, expressed in the microenvironment and suggestive of
a glycolytic phenotype which bypasses oxidative phosphorylation, was associated with a poor outcome (6). This supports previous data in which high levels has been associated with a better response to NAC and impaired survival in residual TNBC (6). The Acetyl-CoA carboxylases (ACC) A and B, convert acetyl-CoA to malonyl-CoA, a rate limiting step in fatty acid synthesis. Where ACACA, localised in the cytosol, is mostly involved in fatty acid synthesis, high levels of ACACB, localised in the mitochondria, also regulate and inhibit fatty acid oxidation (45), which would account for the favourable outcome of patients with high levels of ACACB found in the present study, where inhibition of fatty acid oxidation impairs the energy requirements of the tumour cells. ACACB was, as in previous findings (14), enriched in residual disease irrespective of ER status. Even though there was a strong positive correlation between ACACB and ER-status, with the exception of ER-/HER2- patients, ACACB added independent prognostic value in all multivariable models also including ER or ESR1 status.
18 both in primary tumours (34) and residual tumours after NAC (8). There was a significant upregulation of BCL2 and downregulation of BCL2L1 following neoadjuvant chemotherapy.
Even though Bcl2 is mainly antiapoptotic, it is through the antiproliferative (46) and proapaptotic functions especially evident at higher expression levels which Bcl2 also exhibits (47), the positive prognostic value may emanate. Previous studies on the pro-apoptotic gene PAWR have found a negative prognostic value of low mRNA levels of PAWR in primary
tumours, downregulation following NAC, but an unknown prognostic impact in residual disease (16). In the present study PAWR was upregulated in response to chemotherapy, but no
significant univariable prognostic value could be found in all patients. However, there was a significant difference in the prognostic impact of PAWR in subgroups based on ER-status, where low levels of the pro-apoptotic gene PAWR in residual disease was significantly predictive of an
improved outcome in the ER-/HER2- cohort only, with the reverse results found in ER+/HER2- tumours. This difference in prognostic impact based on ER-status also corresponded to a significant term of interaction.
TWIST, SNAI1, SNAI2, and SOX9, the four EMT genes, are thought to facilitate EMT mainly
by repressing e-cadherin expression needed for cells to maintain cell-to-cell adhesion, and high protein levels have generally been associated with an impaired prognosis in primary disease (40, 41). In the present study the expression levels of all EMT genes were significantly upregulated after NAC in line with previous studies (14), however the prognostic value of high residual expression of the genes differed. Unexpectedly, high residual TWIST and SNAI2 was significantly associated with an improved outcome, whereas patients with low SNAI1 and SOX 9
19 Previous studies have only addressed the prognostic value of TWIST and SNAI2 in primary
tumours, and there may be differences in profiling primary versus residual disease. An independent validation would however be needed to further elucidate the prognostic impact of TWIST and SNAI2 after NAC before definite conclusions can be drawn.
In the present data set, of the stem cell markers CD44, STAT3, and ALDH1A1, generally
associated with self-renewal and resistance to chemotherapy when expressed by epithelial cells in primary tumours, only high ALDH1A1, which was also significantly upregulated in response to neoadjuvant chemotherapy, conveyed independent prognostic value, and contrary to the
expected, with high residual levels indicating an improved outcome. This may however be consistent with findings in another study on residual tumours, where no prognostic significance or increase in expression of epithelial ALDH1 was found after NAC, however, high residual stromal expression of ALDH1 was associated with an improved outcome (9). Moreover - even though ALDH1 is expressed at higher levels in chemotherapy resistant cancer stem cells (48), it also involved in the synthesis of retinoic acid, which has an antiproliferative effect by facilitating the action of other breast cancer cell growth inhibitors (49).
An increase in immunological response, represented by CD3D, CXCL13, and STAT1 has been associated with improved survival in several publications (50). In this data set, CD3D, as part of
20 expression (19), in residual disease were associated with in improved outcome in TNBC (50). We also found a significant statistical association between IHC CD3D and mRNA expression levels, supporting the possibility of a functional association. However, together with ESR1, ERBB2, neoadjuvant chemotherapy did not induce a significant change in either CXCL13 or CD3D
expression.
Lastly, the MAPK phosphatase DUSP4, a negative regulator of the Ras-ERK pathway was significantly enriched in response to chemotherapy, with low levels of DUSP4 in residual disease
associated with an impaired prognosis, in agreement with earlier studies on TNBC (11). Even so, there was no independent prognostic value of DUSP4 in any of the subgroups or in multivariable
analyses. We chose not to conduct analyses of the MAPK pathway by measuring phosphorylated proteins since we have reported the catastrophic loss of immunohistochemical staining of p-AKT and p-ERK1/2 in routinely fixed breast cancer excisions (52). Pre-analytical variables may also affect transcript analyses but the inclusion of housekeeper genes helps cater for artefacts. Other studies have found DUSP4 mRNA expression inversely correlated with a gene-expression based Ras-ERK-pathway score in 230 primary breast cancers (11), and in 633 breast tumours from TCGA we observed an inverse correlation with BRAF and DUSP4 mRNA expression (Supplementary Table S3) (53). Taken together, although not directly linking DUPS4 expression to the phosphoprotein levels, this may provide evidence of the link between DUSP4 and
Ras-ERK-pathway activation.
21 However, as events are few, the results should be interpreted with caution. Apoptosis (PAWR), fatty acid synthesis (ACACB), and ERBB2 did however further identify patients with an inferior outcome in ER+/HER2- disease, and immune response (CD3D) and again PAWR emerged as prognostic biomarkers in ER-/HER2- patients. Notably HER2 expression was significantly
associated with risk of relapse even in the HER2- cohort, with low rather than high expression associated with greater risk, consistent with our previous reports on the ABC and ATAC adjutant trials (54, 55). This may be partly due to a direct relationship between ER and HER2 expression in the HER2- group (with higher ER expression being linked to better prognosis) or to loss of that locus on chromosome 17 in genetically unstable, poorer prognosis tumors. Similarly, in a fixed multivariable IHC3 model including ER, PgR, and HER2, ACACB, CD3D, MKI67, and TOP2A provided independent prognostic value. Lastly, a penalised Elastic net Cox regression analysis in all patients identified six genes including ACACB, CD3D, DECORIN, ESR1, MKI67,
and PLAU, which added significant prognostic value independent of clinical ER, PgR, and HER2. Conversely, clinical ER, PgR and HER2 did not provide additional prognostic value when the 6-gene model was included in the Cox model. In ER+/HER2- patient, a 4 gene model (ACACB, ERBB2, MKI67, and PAWR) was equally predictive of time to relapse. An external
22 In conclusion, by profiling presurgical biopsies and residual disease in patients who have not achieved a pCR after NAC, the present study identified 14 genes representing ER-signalling (ESR1), proliferation (AURKA, MIK67, TOP2A), stem-cellness (ALDH1A1), EMT (TWIST, SNAI2), apoptosis (BCL2, BCL2L1, PAWR), changes in energy metabolism (LDHB, ACACB), stromal processes (DECORIN, PLAU), immunological response (CD3D), and Ras-ERK activation (DUSP4) which were all associated with an inferior prognosis. To determine their
relative importance in individual patients and provide evidence for the targeting of these processes in chemo-resistant disease would need larger numbers of patients. The multivariable gene models identified in all patients as well as in the largest subgroup, the ER+/HER2- patients, could if they are validated be used to identify patients who could be offered further treatment or inclusion in studies on new drugs to improve their prognosis.
Acknowledgements
We would like to acknowledge Professor Barry Gusterson´s advisory work on pathological assessments, as well as Andrew Dodson´s and Vera Martin´s work on immunohistochemical assessments of CD3D.
1. FDA. http://www.fda.gov/downloads/drugs/ucm310088.pdf 2012.
2. von Minckwitz G, Untch M, Blohmer JU, Costa SD, Eidtmann H, Fasching PA, et al. Definition and impact of pathologic complete response on prognosis after neoadjuvant chemotherapy in various intrinsic breast cancer subtypes. J Clin Oncol. 2012;30(15):1796-804.
23 4. von Minckwitz G, Schmitt W, Loibl S, Muller BM, Blohmer JU, Sinn B, et al. Ki67 measured after neoadjuvant chemotherapy for primary breast cancer. Clin Cancer Res. 2013.
5. Sheri A, Smith IE, Johnston SR, A'Hern R, Nerurkar A, Jones RL, et al. Residual proliferative cancer burden to predict long-term outcome following neoadjuvant chemotherapy. Annals of Oncology. 2015;Jan;26(1)(1569-8041 (Electronic)):75-80.
6. Dennison JB, Molina JR, Mitra S, Gonzalez-Angulo AM, Balko JM, Kuba MG, et al. Lactate Dehydrogenase B: A Metabolic Marker of Response to Neoadjuvant
Chemotherapy in Breast Cancer. Clin Cancer Res. 2013;19(13):3703-13.
7. Sakakibara M, Fujimori T, Miyoshi T, Nagashima T, Fujimoto H, Suzuki HT, et al. Aldehyde dehydrogenase 1-positive cells in axillary lymph node metastases after
chemotherapy as a prognostic factor in patients with lymph node-positive breast cancer. Cancer. 2012;118(16):3899-910.
8. Vargas-Roig LM, Cuello-Carrion FD, Fernandez-Escobar N, Daguerre P, Leuzzi M, Ibarra J, et al. Prognostic value of Bcl-2 in breast cancer patients treated with neoadjuvant anthracycline based chemotherapy. Mol Oncol. 2008;2(1):102-11.
9. Resetkova E, Reis-Filho JS, Jain RK, Mehta R, Thorat MA, Nakshatri H, et al. Prognostic impact of ALDH1 in breast cancer: a story of stem cells and tumor
microenvironment. Breast Cancer Res Treat. 2010;123(1):97-108.
10. Riemenschnitter C, Teleki I, Tischler V, Guo W, Varga Z. Stability and prognostic value of Slug, Sox9 and Sox10 expression in breast cancers treated with neoadjuvant chemotherapy. Springerplus. 2013;2:695.
11. Balko JM, Cook RS, Vaught DB, Kuba MG, Miller TW, Bhola NE, et al. Profiling of residual breast cancers after neoadjuvant chemotherapy identifies DUSP4 deficiency as a mechanism of drug resistance. Nat Med. 2012;18(7):1052-9.
12. Legrier M-E, Yvonnet V, Beurdeley A, Stephant G, Le Ven E, Banis S, et al. Early activation of INF/STAT signalling in tuor cells of patient-derived triple negative breast cancer xenografts predicts survivial to chemotherapy. Cancer Research. 2013;72(24 (Suppl 3)).
13. Tanei T, Morimoto K, Shimazu K, Kim SJ, Tanji Y, Taguchi T, et al.
Association of breast cancer stem cells identified by aldehyde dehydrogenase 1 expression with resistance to sequential Paclitaxel and epirubicin-based chemotherapy for breast cancers. Clin Cancer Res. 2009;15(12):4234-41.
14. Gonzalez-Angulo AM, Iwamoto T, Liu S, Chen H, Do KA, Hortobagyi GN, et al. Gene expression, molecular class changes, and pathway analysis after neoadjuvant systemic therapy for breast cancer. Clin Cancer Res. 2012;18(4):1109-19.
15. Creighton CJ, Li X, Landis M, Dixon JM, Neumeister VM, Sjolund A, et al. Residual breast cancers after conventional therapy display mesenchymal as well as tumor-initiating features. Proc Natl Acad Sci U S A. 2009;106(33):13820-5.
16. Alvarez JV, Pan TC, Ruth J, Feng Y, Zhou A, Pant D, et al. Par-4 Downregulation Promotes Breast Cancer Recurrence by Preventing Multinucleation following Targeted Therapy. Cancer Cell. 2013;24(1):30-44.
24 19. Denkert C, Loibl S, Noske A, Roller M, Muller BM, Komor M, et al. Tumor-associated lymphocytes as an independent predictor of response to neoadjuvant chemotherapy in breast cancer. J Clin Oncol. 2010;28(1):105-13.
20. Franci C, Zhou J, Jiang Z, Modrusan Z, Good Z, Jackson E, et al. Biomarkers of residual disease, disseminated tumor cells, and metastases in the MMTV-PyMT breast cancer model. PLoS One. 2013;8(3):e58183.
21. Weichselbaum RR, Ishwaran H, Yoon T, Nuyten DS, Baker SW, Khodarev N, et al. An interferon-related gene signature for DNA damage resistance is a predictive marker for chemotherapy and radiation for breast cancer. Proc Natl Acad Sci U S A.
2008;105(47):18490-5.
22. Di Leo A, Desmedt C, Bartlett JM, Piette F, Ejlertsen B, Pritchard KI, et al. HER2 and TOP2A as predictive markers for anthracycline-containing chemotherapy regimens as adjuvant treatment of breast cancer: a meta-analysis of individual patient data. Lancet Oncol. 2011;12(12):1134-42.
23. Farmer P, Bonnefoi H, Anderle P, Cameron D, Wirapati P, Becette V, et al. A stroma-related gene signature predicts resistance to neoadjuvant chemotherapy in breast cancer. Nat Med. 2009;15(1):68-74.
24. Singer CF, Klinglmuller F, Stratmann R, Staudigl C, Fink-Retter A,
Gschwantler D, et al. Response prediction to neoadjuvant chemotherapy: comparison between pre-therapeutic gene expression profiles and in vitro chemosensitivity assay. PLoS One. 2013;8(6):e66573.
25. Desmedt C, Di Leo A, de Azambuja E, Larsimont D, Haibe-Kains B, Selleslags J, et al. Multifactorial approach to predicting resistance to anthracyclines. J Clin Oncol. 2011;29(12):1578-86.
26. Azim HA, Jr., Singhal S, Ignatiadis M, Desmedt C, Fumagalli D, Veys I, et al. Association between SPARC mRNA expression, prognosis and response to neoadjuvant chemotherapy in early breast cancer: a pooled in-silico analysis. PLoS One.
2013;8(4):e62451.
27. Katayama H, Sen S. Functional significance of Aurora kinase A regulatory interactions with p53-ERalpha complex in human breast cancer cells. Horm Cancer. 2011;2(2):117-24.
28. Wirtz R, Leinonen M, Bono P, Isola J, Kellokumpu-Lehtinen P-L, Kataja V, et al. CXCL13 mRNA predicts docetaxel benefit in triple negative tumors. Cancer Research. 2012;72(24 (Suppl 3)).
29. Gianni L, Bianchini G, Valagussa P, Belusov A, Thomas M, Ross G, et al. Adaptive immune system and immune checkpoints are associated with response to pertuzumab (P) and trastuzumab (H) in the NeoSphere Study. Cancer Research. 2012;72(24 (Suppl 3)). 30. Troup S, Njue C, Kliewer EV, Parisien M, Roskelley C, Chakravarti S, et al. Reduced expression of the small leucine-rich proteoglycans, lumican, and decorin is associated with poor outcome in node-negative invasive breast cancer. Clin Cancer Res. 2003;9(1):207-14.
31. Urruticoechea A, Smith IE, Dowsett M. Proliferation marker Ki-67 in early breast cancer. J Clin Oncol. 2005;23(28):7212-20.
32. Rody A, Karn T, Ruckhaberle E, Muller V, Gehrmann M, Solbach C, et al. Gene expression of topoisomerase II alpha (TOP2A) by microarray analysis is highly prognostic in estrogen receptor (ER) positive breast cancer. Breast Cancer Res Treat. 2009;113(3):457-66.
25 34. Dawson SJ, Makretsov N, Blows FM, Driver KE, Provenzano E, Le Quesne J, et al. BCL2 in breast cancer: a favourable prognostic marker across molecular subtypes and independent of adjuvant therapy received. Br J Cancer. 2010;103(5):668-75.
35. Desmedt C, Haibe-Kains B, Wirapati P, Buyse M, Larsimont D, Bontempi G, et al. Biological processes associated with breast cancer clinical outcome depend on the
molecular subtypes. Clin Cancer Res. 2008;14(16):5158-65.
36. Yamamoto S, Yamamoto-Ibusuki M, Yamamoto Y, Fujiwara S, Iwase H. A comprehensive analysis of Aurora A; transcript levels are the most reliable in association with proliferation and prognosis in breast cancer. BMC Cancer. 2013;13:217.
37. Liu Y, Lv DL, Duan JJ, Xu SL, Zhang JF, Yang XJ, et al. ALDH1A1 expression correlates with clinicopathologic features and poor prognosis of breast cancer patients: a systematic review and meta-analysis. BMC Cancer. 2014;14:444.
38. Yau C, Esserman L, Moore DH, Waldman F, Sninsky J, Benz CC. A multigene predictor of metastatic outcome in early stage hormone receptor-negative and triple-negative breast cancer. Breast Cancer Res. 2010;12(5):R85.
39. Look MP, van Putten WL, Duffy MJ, Harbeck N, Christensen IJ, Thomssen C, et al. Pooled analysis of prognostic impact of urokinase-type plasminogen activator and its inhibitor PAI-1 in 8377 breast cancer patients. J Natl Cancer Inst. 2002;94(2):116-28. 40. Martin TA, Goyal A, Watkins G, Jiang WG. Expression of the transcription factors snail, slug, and twist and their clinical significance in human breast cancer. Ann Surg Oncol. 2005;12(6):488-96.
41. Guo W, Keckesova Z, Donaher JL, Shibue T, Tischler V, Reinhardt F, et al. Slug and Sox9 cooperatively determine the mammary stem cell state. Cell. 2012;148(5):1015-28.
42. Dowsett M, Nielsen TO, A'Hern R, Bartlett J, Coombes RC, Cuzick J, et al. Assessment of Ki67 in breast cancer: recommendations from the International Ki67 in Breast Cancer working group. J Natl Cancer Inst. 2011;103(22):1656-64.
43. Goldoni S, Iozzo RV. Tumor microenvironment: Modulation by decorin and related molecules harboring leucine-rich tandem motifs. Int J Cancer. 2008;123(11):2473-9. 44. Annecke K, Schmitt M, Euler U, Zerm M, Paepke D, Paepke S, et al. uPA and PAI-1 in breast cancer: review of their clinical utility and current validation in the prospective NNBC-3 trial. Adv Clin Chem. 2008;45:31-45.
45. Abu-Elheiga L, Matzuk MM, Abo-Hashema KA, Wakil SJ. Continuous fatty acid oxidation and reduced fat storage in mice lacking acetyl-CoA carboxylase 2. Science. 2001;291(5513):2613-6.
46. Huang DC, O'Reilly LA, Strasser A, Cory S. The anti-apoptosis function of Bcl-2 can be genetically separated from its inhibitory effect on cell cycle entry. EMBO J.
1997;16(15):4628-38.
47. Shinoura N, Yoshida Y, Nishimura M, Muramatsu Y, Asai A, Kirino T, et al. Expression level of Bcl-2 determines anti- or proapoptotic function. Cancer Res.
1999;59(16):4119-28.
48. Ginestier C, Hur MH, Charafe-Jauffret E, Monville F, Dutcher J, Brown M, et al. ALDH1 is a marker of normal and malignant human mammary stem cells and a predictor of poor clinical outcome. Cell Stem Cell. 2007;1(5):555-67.
49. Yang Q, Sakurai T, Kakudo K. Retinoid, retinoic acid receptor beta and breast cancer. Breast Cancer Res Treat. 2002;76(2):167-73.
50. Dieci MV, Criscitiello C, Goubar A, Viale G, Conte P, Guarneri V, et al. Prognostic value of tumor-infiltrating lymphocytes on residual disease after primary
26 51. Reyal F, van Vliet MH, Armstrong NJ, Horlings HM, de Visser KE, Kok M, et al. A comprehensive analysis of prognostic signatures reveals the high predictive capacity of the proliferation, immune response and RNA splicing modules in breast cancer. Breast Cancer Res. 2008;10(6):R93.
52. Pinhel IF, Macneill Fa Fau - Hills MJ, Hills Mj Fau - Salter J, Salter J Fau - Detre S, Detre S Fau - A'hern R, A'Hern R Fau - Nerurkar A, et al. Extreme loss of
immunoreactive p-Akt and p-Erk1/2 during routine fixation of primary breast cancer. (1465-542X (Electronic)).
53. Ciriello G, Gatza ML, Beck AH, Wilkerson MD, Rhie SK, Pastore A, et al. Comprehensive Molecular Portraits of Invasive Lobular Breast Cancer. Cell.
2015;163(2)(1097-4172 (Electronic)).
54. Pinhel I, Hills M Fau - Drury S, Drury S Fau - Salter J, Salter J Fau - Sumo G, Sumo G Fau - A'Hern R, A'Hern R Fau - Bliss JM, et al. ER and HER2 expression are positively correlated in HER2 non-overexpressing breast cancer
Estrogen Receptor Expression in 21-Gene Recurrence Score Predicts Increased Late
Recurrence for Estrogen-Positive/HER2-Negative Breast Cancer. (1465-542X (Electronic)). 55. Dowsett M, Sestak I, Buus R, Lopez-Knowles E, Mallon E, Howell A, et al. Estrogen Receptor Expression in 21-Gene Recurrence Score Predicts Increased Late Recurrence for Estrogen-Positive/HER2-Negative Breast Cancer. (1078-0432 (Print)).
Table and Figure legends.
Table 1: Patient characteristics of 126 patients with residual disease after neoadjuvant chemotherapy
Table 2: Fold-changes in gene expression for all patients with available presurgical biopsies (n=56), but also including p-values for ER+/HER2- patients (n=36)
Table 3: Univariable analyses of the prognostic value of the 24 genes with the end-point time to recurrence in all patients, the ER+HER2-, and the ER-/HER2- patients.
27 Figure 1: Heat map of gene expression of 126 residual tumours analysed by unsupervised hierarchical clustering. Each column represents one tumour and each row a gene with red indicating upregulation, and green downregulation. Below the cluster dendrogram relapses, ER-, HER2-status, and residual Ki67 are indicated. The cluster dendrogram colourings have been made only for visualisation purposes using arbitrary cut-offs.
1 Age, years Median Range Range (q1-q3) 51 26-75 44-57 Menopausal status, n
Pre Post Unknown/not applicable 57 46 23 T stage, n
T0 T1 T2 T3 T4 Unknown 0 4 66 36 20 0 N stage, n
N0 N1 N2 N3 Unknown 67 55 1 3 0 AJCC Stage, n
1a 1b 2a 2b 3a 3b 3c 0 0 46 38 19 19 4 ER status, n
2 Negative Positive Unknown 53 65 8 HER2 status, n (%)
Negative Positive Unknown 111 15 0 Grade, n (%)
I II III Unknown 4 61 57 4 Histology, n (%)
IDC ILC Mixed Other 111 8 7 0 Surgery, n (%)
Breast conservation Mastectomy
61 65 Neoadjuvant therapy, n (%)
Anthracycline Taxane Trastuzumab 124 (98) 81(64) 7 (47) Adjuvant taxane, n (%) 20 (16) Adjuvant endocrine therapy, n (%) 41 (33) Adjuvant trastuzumab, n (%) 11(73) Local, regional and/or distant metastases (≤ 5 years), n 46 Overall survival at 5 years, %
95% CI
75% 67-83
3 Table 2: Fold-changes in gene expression for all patients with available presurgical biopsies (n=56), but also including p-values for ER+/HER2- patients (n=36)
All patients (n=56) ER+/HER2- patients (n=36)
Gene fold change
samples upregulated
samples downregulated
p-value of change in expression
p-value of change in expression
ACACB 1.18 39 17 0.002 0.0002
ALDH1A1 1.45 49 7 <0.0001 <0.0001
AURKA 0.94 18 38 0.01 0.005
BCL2 1.07 37 19 0.03 0.08
BCL2L1 0.97 14 42 0.01 0.2
CD3D 1.08 28 28 0.2 0.6
CD44 0.92 16 40 0.002 <0.0001
CXCL13 0.85 25 31 0.1 0.2
DECORIN 1.22 45 11 <0.0001 <0.0001
DUSP4 1.14 40 16 0.01 0.01
ERBB2 0.94 20 36 0.07 0.2
ESR1 0.97 23 33 0.5 0.3
LDHB 1.07 37 19 0.004 <0.0001
MKI67 0.68 10 46 <0.0001 <0.0001
PAWR 1.05 38 18 0.01 0.03
PLAU 0.86 15 41 0.001 0.0001
SNAI1 1.08 34 22 0.03 0.01
SNAI2 1.20 45 11 <0.0001 0.0003
4
STAT1 0.84 8 48 <0.0001 <0.0001
STAT3 0.95 20 36 0.002 0.0003
TOP2A 0.70 13 43 <0.0001 <0.0001
TWIST1 1.40 47 9 <0.0001 <0.0001
*Fold change = mean of (post/pre) for 56 samples
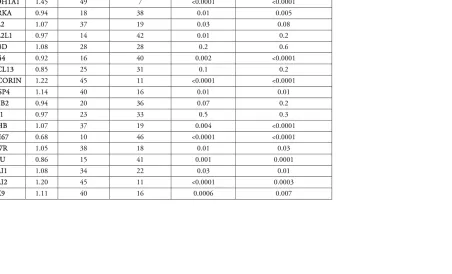
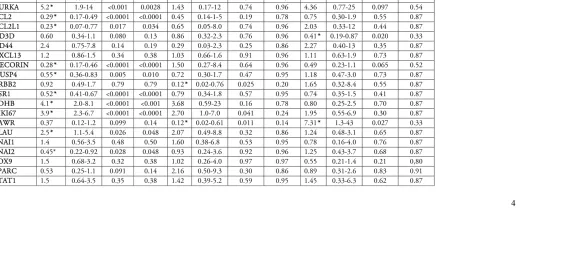
Table 3: Univariable analyses of the prognostic value of the 24 genes with the end-point time to recurrence in all patients, the ER+HER2-, and the ER-/HER2- patients.
All patients (n=126) ER+/HER2- (n=78) ER-/HER2- (n=33)
Events, n 46 17 21
5 * Genes identified by the The Benjamini and Hochberg method for multiple comparison correction, for all patients and subgroups, The threshold of q-values, that is the adjusted p-values from the false-discovery approach, was selected to be less than 1 false positive.
Table 4: Multivariable fixed model consisting of clinical ER,PgR, and HER2, adjusted for one gene at a time with the end-point time to recurrence
6
Events, n 43 43
Clinical factor/ gene HR 95% CI P-value HR 95% CI P-value *q-value
IHC ER 0.21 0.11-0.39 <0.0001 NA NA NA NA
IHC PgR 0.31 0.16-0.57 0.00023 NA NA NA NA
IHC HER2 1.58 0.7-3.6 0.27 NA NA NA NA
ACACB 0.3 0.2-0.45 <0.0001 0.37* 0.20-0.70 0.0022 0.027
ALDH1A1 0.47 0.34-0.64 <0.0001 0.69 0.45-1.06 0.087 0.27
AURKA 4.9 1.8-13 0.0020 2.8 0.83-9.6 0.098 0.27
BCL2 0.27 0.15-0-47 <0.0001 0.50 0.24-1.1 0.074 0.27
BCL2L1 0.2 0.06-0.69 0.011 0.27 0.29-5.0 0.80 0.96
CD3D 0.59 0.33-1.0 0.065 0.56* 0.31-0.92 0.024 0.14
CD44 2.5 0.76-8.4 0.13 2.2 0.38-64.9 0.64 0.91
CXCL13 1.1 0.81-1.5 0.56 0.95 0.68-1.3 0.74 0.94
DECORIN 0.28 0.17-0.47 <0.0001 0.50 0.25-0.98 0.043 0.21
DUSP4 0.57 0.37-0.69 0.010 1.2 0.68-2.1 0.53 0.86
ERBB2 0.89 0.47-1.7 0.73 1.00 0.38-2.6 0.99 1.0
ESR1 0.52 0.4-0.67 <0.0001 0.67 0.41-1.1 0.10 0.27
LDHB 4.14 2.0-8.4 <0.0001 1.3 0.49-3.6 0.59 0.88
MKI67 5.04 2.7-9.3 <0.0001 3.4* 1.6-7.3 0.0021 0.027
PAWR 0.53 0.15-1.9 0.34 2.0 0.49-8.6 0.33 0.66
PLAU 2.6 1.2-5.9 0.017 1.7 0.80-3.6 0.17 0.41
SNAI1 1.5 0.57-3.9 0.41 0.95 0.34-2.7 0.92 0.96
SNAI2 0.45 0.22-0.92 0.029 0.95 0.42-2.2 0.91 0.96
SOX9 1.5 0.68-3.3 0.32 0.69 0.62-1.3 0.22 0.48
SPARC 0.54 0.25-1.2 0.12 1.2 0.51-2.7 0.71 0.94
STAT1 1.5 0.65-3.6 0.32 1.4 0.55-3.7 0.45 0.82
STAT3 0.41 0.06-2.7 0.35 1.1 0.21-6.1 0.87 0.95
TOP2A 3.1 1.7-5.6 0.00015 2.2* 1.2-4.2 0.018 0.14