http://www.sciencepublishinggroup.com/j/ijssn doi: 10.11648/j.ijssn.20180601.13
ISSN: 2329-1796 (Print); ISSN: 2329-1788 (Online)
Failure Data Acquisition System Based on WSN for Vehicle
PHM Technology
Zhiqiang Pan
China National Instruments Import & Export (Group) Corporation, Beijing, China
Email address:
To cite this article:
Zhiqiang Pan. Failure Data Acquisition System Based on WSN for Vehicle PHM Technology. International Journal of Sensors and Sensor
Networks. Vol. 6, No. 1, 2018, pp. 16-25. doi: 10.11648/j.ijssn.20180601.13
Received: February 10, 2018; Accepted: April 9, 2018; Published: May 5, 2018
Abstract:
Prognostic and health management (PHM) technology needs plenty of historical failure data to build accurate model for failure analysis, diagnostic and prognostic. However the existing data collection equipment is not flexible enough for special vehicle because of the wired connection or lack of real-time information feedback in real vehicle experiment. A new failure data acquisition system based on wireless sensor network is proposed to acquire the sufficient historical failure data for the development of vehicle PHM technology. The proposed system architecture consists of several wireless failure data acquisition (WFDA) nodes, a gateway node, monitoring software and probability density ratio (PDR) algorithm working on a base station. Compared with other related acquisition systems, the WFDA node is small enough and suitable for working in a narrow space inside the vehicle. A double-buffer resampling strategy is specifically developed in this node to solve the contradiction of high sampling rate and low wireless bandwidth. The PDR algorithm embedded in monitoring software is used to detect abnormal data and show researchers the analysis results which can be relied to change the test item in time. Experiments results in the laboratory preliminary verified the effectiveness of system.Keywords:
Vehicle Failure Data, Wireless Sensor Network, PHM, Vehicle Test, Abnormal Detection1. Introduction
The integrity and complexity of modern system have been rapidly improved in recent years, and the cost of the development, production, maintenance and support also has great growth. Many factories and enterprises have a huge demand on system reliability since any minor fault will cause disastrous consequences. Therefore, Prognostics and Health Management (PHM) technologies have emerged as a key enabler to provide early indications of system faults and perform predictive maintenance actions [1].
PHM is a method that permits the reliability of a system to be evaluated in its actual life-cycle conditions, to determine the advent of failure, and mitigate the system risks [2]. For now, PHM has got rapid development and is widely applied in many fields, such as electronic system [3-4], vessel equipment [5], aircraft [6], unmanned system [7], large industrial equipment [8], structure monitoring [9].
In automobile industry, many researchers also have come up with the related PHM system [10-12]. Mark P. Zachos and Karl E. Schohl developed a mini-vehicle computer system—
smart wireless internal combustion engine (SWICE) for the internal combustion engine maintenance of their fleet of tactical wheeled vehicles [10]. Eric Rabeno and Matt Hillegass put forward a health and usage monitoring system for Military ground vehicle power generating devices [11]. Sreerupa Das et al. described an extensible architecture for a Ground Vehicle Health and Usage which can be adopted to provide diagnostic and prognostic for vehicles by the on-board subsystem and off-on-board software component [12].
equipment. One is vehicle data recording system used in vehicle working stage which has low processing performance and sampling rate. So, this kind of equipment can only be used to record whether the fault is generated but not supply adequate high frequency information for further prognostic analysis. The other one is a special test equipment used in vehicle test stage which is usually large and needs a great number of connecting wires. So, it is difficult to install and wire in such a narrow space inside the vehicle. In addition, this equipment could not show the test result in time and provide hints for the researchers in test site because of the fixed operation mode.
Wireless Sensor Network (WSN) provides a new method for solving above problem. WSN has been applied extensively in the fields of environmental monitoring, intelligent power plant, agricultural agriculture irrigation, etc. [15-17]. It has been also accepted in the field of condition monitoring and fault detection [18-21]. Shunfeng Cheng et al. developed a radio-frequency-based WSN system which can be used to detect anomalies, assess degradation, and predict failures. This system use RFID technology and on-board flash memory to transfer and store the data. The storage and transfer rate is not very high for the long-term field test [18]. Jan Neuzil et al. proposed a novel IWSN framework for machine condition monitoring based on splitting the data acquisition, classifier building and training between different units [19]. The system is realized in Crossbow WSN which is a Commercial-off-the-shelf (COTS) and not suitable for the vehicle test. Abel C. Lima-Filho et al. proposed an embedded WSN system to monitor dynamic torque and efficiency of induction motors [20]. Only useful monitoring information can be transferred and all signal processing is done locally in this system. In contrast to our approach, the system described in ref. [20] is just suitable to monitor, but do not offer data for further analysis.
Although the above WSN system has good performance in their applications, some shortcomings limit their development in vehicle test: a) Most COTS WSN system could not meet the requirement of vehicle test environment, such as high temperature and vibration. b) System size is not small enough for working in some narrow space. c) Some systems are only suitable for monitoring and could not offer high sample rate and real-time data transmission.
This paper proposes a wireless failure data acquisition system which can provide enough support for the development of PHM system. Our system consists of some wireless failure data acquisition nodes, a gateway node, the monitoring software and related algorithm. Compared with the above mentioned systems, it has the following characteristics: a) This
to find the useful information from all collected data. The monitoring software and algorithm in this system not only could detect and display the abnormal data in time but also record the timing of the appearance of abnormal data for further analysis. So, the researchers can adjust the test content in time according to the analysis result.
This paper is organized as follows. In Section 2, the failure data acquisition system architecture is presented. In Section 3, the hardware and software of WFDA Node is described. In Section 4, the gateway node is proposed. In section 5, the experiment evaluation methodology is discussed. Finally, some conclusions end this paper.
2. Failure Data Acquisition System
Architecture
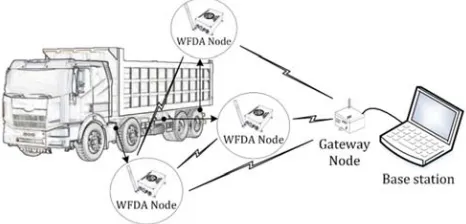
The failure data acquisition system (FDAS) shown in Figure 1 is composed of several wireless failure data acquisition (WFDA) nodes, a gateway node, a monitoring software and related detection algorithm working in a base station which could be a laptop or a vehicle embedded computer.
Figure 1. Failure Data Acquisition System Architecture.
Figure 2. Functional blocks of FDAS.
3. Design of Wireless Failure Data
Acquisition Node
The function of the WFDA Node is to gather all kinds of signals from vehicle intercom system, such as temperature, vibration, pressure and rotating speed. After this, the acquired data is stored into SD card and simultaneously transferred to the gateway node.
For PHM technology, the acquired fault data is used to build diagnostic and prognostic model. So, a high sample rate is needed to realize the frequency domain analysis or time-frequency domain analysis. However, the traditional wireless
sensor network node has limited computational capabilities, which could not meet the demand of FDAS. In this paper, a new hardware and software architecture of WFDA node is proposed to solve the problem. FPGA is used as microcontroller to achieve the high-speed data flow. A double-buffer resampling strategy is developed for the real-time storage and transmission.
3.1. Hardware Design
The WFDA Node consists of A/D converter, microcontroller, SDRAM, EPCS, SD card and wireless module, as is shown in Figure 3.
Figure 3. A block diagram of the WFDA node.
The Cyclone II FPGA is selected as the microcontroller which is an important part of the node including the A/D controller to control sampling, FIFO controller to buffer the acquired data, SD controller to storage data, NIOS soft core to control the whole system as a CPU. All controllers inside the FPGA communicate with each other through Avalon bus. In addition, the FIFO controller and SD controller specially designed by VHDL language are key components to realize the double-buffer strategy. Both of the controllers synchronously completed the data transmission and storage without taking CPU working time.
SDRAM provides space for program and data buffer. SD card supplies 8G storage space and features a maximum writing speed 2MB/s through SDIO communication mode because of the existing of SD card controller. A simplified FAT32 file system is utilized to manage the stored data.
4. The size of this node is 70×40×30mm.
Figure 4. Picture of WFDA node.
3.2. Software Design
1) The strategy of storage and real-time transmission Given that analysis requirement of some vehicle components, the highest sampling rate of each node is designed to be 1Msps in this WDFA node. What’s more, the data resolution of A/D converter is 12 bit and 4 bit channel number is added for every sample data. So the highest data speed is 2MB/s and the writing
transfer the partial acquired data at regular intervals for real time observation. The data flow is shown in Figure 5.
The whole working process according to the data flow can be described from Process A to Process E.
Process A: A/D converter acquire data by 12bit/sample. Process B: A/D controller send data to FIFO by 16bit at a time. FIFO size is 16kB.
Figure 5. Block diagram of data flow.
Process C: Once FIFO controller receives the read quest signal (rdreq)which occurs by FIFO, data is read from FIFO to SDRAM. When the FIFO controller send 2M data, a signal is generated to tell SD controller read data from SDRAM.
Process D: SD controller write data to files in SD card by 2MB at a time. The file system used in this paper is different from the standard one considering the writing speed. We directly write the file information into the defined user table instead of the standard file allocation table. Moreover, the data is stored into specified block that each block size is 0.5kB. 2MB data is written in 4000 blocks at a time. Figure 6 shows the file system structure.
Figure 6. The modified file system.
Process E: The NIOS soft core read 1 sample point every 2000 acquired samples from SDRAM, just like resampling. It is emphasized that all these 2000 samples have been stored in SD card as is shown in Process D. Once it has read up to 40
Figure 7. The process of building data wireless data frame.
2) Network communication strategy
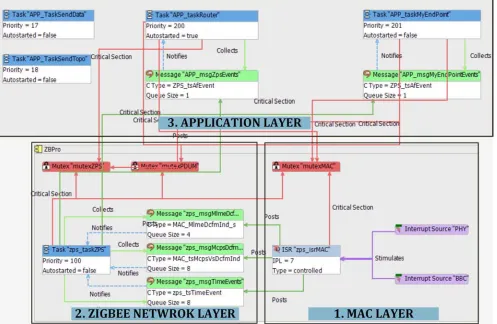
The network topology takes a mesh shape with a coordinator and several routers in the network. The gateway node is configured as a coordinator and each WFDA node is configured as a router. The software of wireless communication is based on the jennic operating system (JENOS) which provides an interface that simplifies the programming of a range of operation with. The software architecture includes MAC layer, Zigbee pro stack layer and
application layer from the bottom to top. This paper create four tasks in application layer for realizing basic function. App_taskRouter is a task for network function. App_taskMyEndpoint is a task for receiving commands. APP_TaskSendSensor is a task for sending acquired data. APP_TaskSendTopo is a task for sending topology information. The top-level design of programming is based on graphic pattern and partial program codes have been shown in Figure 8.
Figure 8. Partial program codes of wireless module.
4. Design of Gateway Node
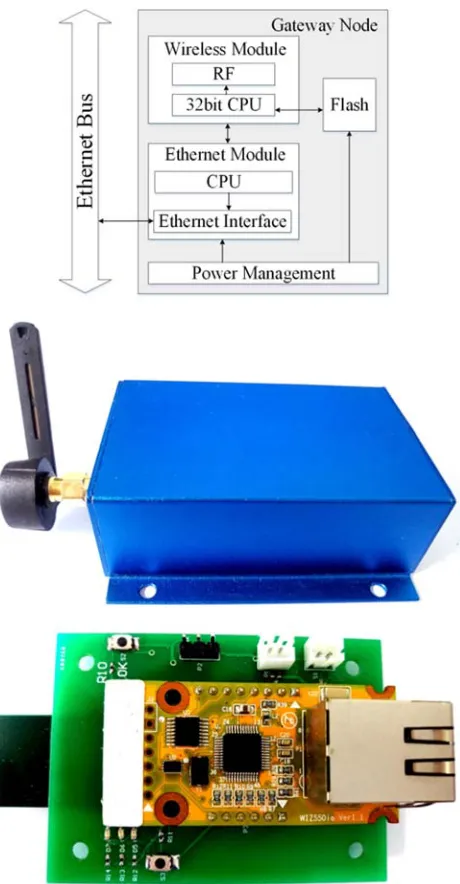
The gateway node is equipped with wireless module, Ethernet interface module, flash module and power management module, as is shown in Figure 9. The Wiznet
Figure 9. Block diagram and picture of the gateway node.
5. Design of Monitoring software and
Algorithm
5.1. Monitoring Software
The monitoring software is developed by NI LabVIEW, a graphical programming environment which can be used to rapidly develop user interfaces for data visualization and user input with an easy-to-use drag-and-drop interface. Furthermore, LabVIEW also integrates graphical, text-based, and other programming approaches within a single environment to efficiently develop algorithms for data analysis and advanced control.
The monitoring software developed in this paper is composed by front panel and back panel. The front panel provides graphical indicators and waveforms to observe the data in real time. In the back panel, the program can be divided into three parts which are respectively data
describe abnormal condition, as is shown in (1).
ω (1)
Where, y is the training sample series, and x is test sample series. is training samples probability. is test samples probability. ω is the normal degree of test samples which would be near to 1 when the test samples is close to the training samples which are the normal status samples and would deviate from 1 when the test sample is abnormal.
In order to simply the calculation, the density patio module is converted into a linear module which can be described by (2).
∑ (2)
α is linear module parameter, means basis function which is described by Gaussian Kernel Function
exp ‖ ‖ in this paper. σ is the width argument.
‖ ‖ is the distance between test sample and normal sample.
σ and α can be solved by the cross-validation method, so the final equation can be determined by (3)
∑ exp ‖ ‖ (3)
6. Experiment Validation
To verify the effectiveness of this system, this system is used to measure the simulation signal and show the storage, transmission and analysis results in our laboratory, as is shown in Figure 10.
The simulation data comes from Western Reserve University Bearing Data Centre which provides ball bearing test data of normal and faulty bearings [24]. The dataset includes acceleration data which was measured from the motor bearings. Part of the normal status data was chosen for training data. Part of the normal status data and part of the faulty status data was respectively chosen for testing data.
Figure 10. The test environment.
Experiment results show the effectiveness of the system from three aspects:
1) The storage result of SD card shown in Figure 11a. The storage data is shown in hexadecimal by WinHex software. The first resampled data is ‘3EB7’. ‘3’ is the channel number and
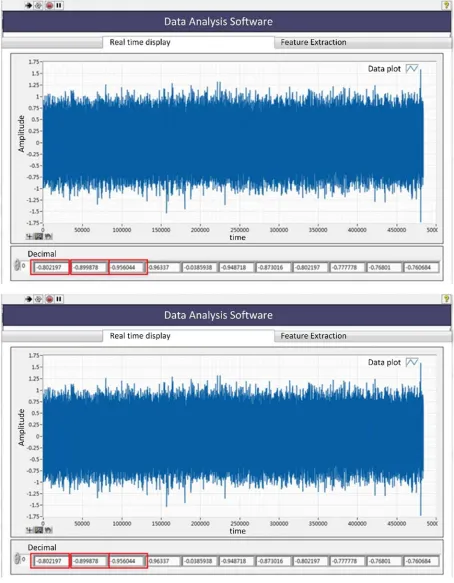
‘EB7’ stands for the real voltage data. ‘EB7’ can be converted to decimal voltage data that is -0.802197 according to Max1308-datasheet. The display result of monitoring software shown in Figure 12b. The received data is same with the resampled data stored in SD card.
b) data display result.
Figure 11. Test result
The analysis result of PDR algorithm shown in Figure 12a-b. In Figure 12a, the top two pictures are respectively signal waveform of training data and test data. The middle two pictures represents the frequency distribution of data. The bottom picture is the PDR value. In this picture, the normal
status data is used as training data and the PDR result is close to 1 which also represents the training data is normal.
a) normal test data analysis result of PDR algorithm.
b) fault test data analysis result of PDR algorithm.
Figure 12. Analysis result of PDR algorithm.
7. Conclusion
The sufficient historical failure data acquired in real environment is the most important resource for the development of vehicle PHM technology. Moreover, a flexible and robust data acquisition system is the premise to getting the resource. A wireless failure acquisition system is proposed in this paper. The system is composed of several wireless failure data acquisition nodes, a gateway node, the
monitoring software and related algorithm working in a base station. The WFDA node is responsible to collect the vehicle operating data which is stored at local and concurrently send to the gateway node. The gateway node is utilized to receive data from WFDA node and transfer data to the base station through Ethernet bus. The monitoring software is used to send out control commands and display received data. The probability density ratio algorithm embedded in monitoring software could detect abnormal data and show researchers the analysis results which can be relied to change the test item in time. Experiment results
0 100 200 300 400
-0.5 0 0.5 data samples A m p lit u d e Normal data
0 100 200 300 400
-2 0 2 data samples A m p lit u d e
Test data (Normal status)
-0.20 0 0.2 0.4 0.6
50 100
data amplitude distribution
F re q u e n c y
-0.50 0 0.5
100 200
data amplitude distribution
F re q u e n c y
-0.5 -0.4 -0.3 -0.2 -0.1 0 0.1 0.2 0.3 0.4
0.9 1 1.1
data amplitude distribution
T h e d e g re e o f a b n o rm a lit y
0 100 200 300 400
-0.5 0 0.5 data samples A m p lit u d e Normal data
0 100 200 300 400
-2 0 2 data samples A m p lit u d e
Test data (Faulty status)
-0.20 0 0.2 0.4 0.6
50 100
data amplitude distribution
F re q u e n c y
-1 0 1 2
0 100 200
data amplitude distribution
F re q u e n c y
-1 -0.5 0 0.5 1 1.5
0.5 1 1.5
data amplitude distribution
the researchers can adjust the test content according to the analysis result. What’s more, the system can be easily modified to a long-term monitoring vehicle system.
In the future work, this system will be tested in a real vehicle by collecting AMT system parameters.
Conflict of Interest
The authors declare that there is no conflict of interests regarding the publication of this paper.
References
[1] Z. S Chen, Y. M Yang, Zheng Hu. A Technical Framework and Roadmap of Embedded Diagnostics and Prognostics for Complex Mechanical Systems in Prognostics and Health Management Systems. IEEE TRANSACTIONS ON RELIABILITY, 2012; 61(2): 314-322.
[2] Nikhil M. Vichare, Michael G. Pecht. Prognostics and health management of electronics. IEEE Transactions on Components and Packing Technology 2006, 29(1): 222-229. [3] Jiajie Fan, Yung KC, Pecht M. Physics-of-Failure-Based
Prognostics and Health Management for High-Power White Light-Emitting Diode Lighting. IEEE Transactions on Device and Materials Reliability 2011, 11 (3): 407-416.
[4] Qiang Miao, Azarian M, Pecht M. Cooling Fan Bearing Fault Identification Using Vibration Measurement, Proc. IEEE Int. Conf. Prognostics and Health Management, Chengdu, China, Sep. 2011, pp. 1-5.
[5] Ping Zhou, Dongfeng Liu. Research on marine diesel's fault prognostic and health management based on oil monitoring. Conf. Prognostics and System Health Management, Shenzhen, China, May 2011, pp. 1-4.
[6] Bulter A, Hopf J, Jacob J, et al. Laboratory validation of sensors for a corrosion prognostic health management system for use with military aircraft. Annual Conf. of the Australasian Corrosion Association, Melbourne, Australia, Sep. 2014.
[7] Chen, G S, Ma S. Research on prognostic and health management technology of unmanned aerial vehicle. Proc. Int. Conf. Control Engineering and Information System, Shijiazhuang, China, June, 2014, pp. 791-794.
[8] Zhang Jinyu, Huang Xianxiang, Cai Wei. Research on prognostic and health monitoring system for large complex equipment. Proc. Int. Conf. Control, Automation and Systems Engineering, Xi'an,
[11] [11] Banks Jeff, Brought Mark, Estep Jason, et al. Health and Usage Monitoring for Military Ground Vehicle Power Generating Devices. IEEE Aerospace Conference Proceedings, PA, United States, March, 2011, pp. 1-17. [12] Sreerupa Das, Richard Hall, Amar Patel, et al. An Open
Architecture for Enabling CBMPHM Capabilities in Ground VEHICLE. 2012 IEEE Conference on Prognostics and Health Management, Denver, CO, United States, June, 2012, pp. 1-8. [13] Omer Faruk Eker, Fatih Camci, Adem Guclu, et al. A Simple
State-Based Prognostic Model for Railway Turnout Systems. IEEE Transactions on Industrial Electronics 2011; 58(5): 1718-1726.
[14] Kwok L Tsui, Nan Chen, Qiang Zhou, et al. Prognostics and Health Management: A Review on Data Driven Approaches. Mathematical Problems in Engineering 2015: 1-17.
[15] Wang Jing, Liu Tingting. Application of wireless sensor network in Yangtze River basin water environment monitoring. 2015 27th Chinese Control and Decision Conference, Qingdao, China, pp. 5981-5985.
[16] Sabrine Khriji, Dhouha El Houssaini, Mohamed Wassim Jmal, et al. Precision irrigation based on wireless sensor network. IET Science, Measurement and Technology 2014; 8(3): 98-106. [17] Yong Cui, Jianxun Lv, Haiwen Yuan, et al. Development of a
Wireless Sensor Network for Distributed Measurement of Total Electric Field under HVDC Transmission Lines. International Journal of Distributed Sensor Networks 2014; 1: 790-797. [18] Shunfeng Cheng, Kwok Tom, Larry Thomas, et al. A Wireless
Sensor System for Prognostics and Health Management. IEEE SENSORS JOURNAL 2010; 10(4): 856-862.
[19] Jan Neuzil, Ondrej Kreibich, Radislav Smid. A Distributed Fault Detection System Based on IWSN for Machine Condition Monitoring. IEEE Transactions on Industrial Informatics 2014; 10 (2): 1118-1123.
[20] Abel C Lima-Filho, Ruan D Gomes, Marc´eu O Adissi. Embedded System Integrated Into a Wireless Sensor Network for Online Dynamic Torque and Efficiency Monitoring in Induction Motors, IEEE/ASME Transactions on Mechatronics, 2012, 17, (3), pp. 404-414.