Abstract— In diagnosis of periodontal diseases, full–mouth examination is considered as the most appropriate assessment protocol. The full–mouth examination process involves measurement of a set of standard parameters (such as recession, MGJ, PD and tooth mobility) for each tooth. For some of these parameters, this method needs examination of six sites per tooth (three points on the facial and three on the lingual or palatal side) on all existing teeth. Thus, the whole process is very time-consuming and considered as a fatiguing task for both examiner and the patient. In order to diminish these matters, some researchers have tried to find solutions to partial-mouth examination, i.e., measuring the parameters for a subset of teeth and estimate the others. In this study, we follow another goal, too. For each tooth, we aim to be able to estimate one (or more) parameter(s) from the set of parameters measured for the same tooth or its neighbor teeth. For this purpose, we first design a mining scheme to discover hidden relationships among the parameters, using our collected data which contains full mouth parameters of more than 600 patients recorded by periodontists in Shiraz Dental School. Based on the results of the mining process, we then propose a fuzzy rule-based system and use rule-weight learning as a mechanism to tune it. Comparison of estimated and actual values on various teeth shows an overall high accuracy. The results are promising and show that the proposed solution can be considered as an acceptable alternative to full-mouth examination.
Index Terms— Approximate dependencies, Full-mouth Examination, Fuzzy Classification, Fuzzy Modeling, Mouth Parameters, Parameter Estimation, Partial-mouth Examination, Periodontics
I. INTRODUCTION
n epidemiological investigations, a proper assessment of disease is very important for understanding the disease progression and treatment needs [1], [2]. In assessment of periodontal treatments, full–mouth examination is considered as the gold standard, i.e., the best assessment protocol [3], [4]. Full–mouth examination involves examination of six sites per tooth on all existing teeth [4].
Elham Ansarifard is with Department of Prosthodontics, Dental School, Shiraz University of Medical Sciences, Shiraz, Iran (e-mail: [email protected])
Seyed Mostafa Fakhrahmad is with Department of Computer Engineering, Islamic Azad University, Shiraz branch, Iran (e-mail: [email protected])
This method of examination usually bothers both the examiner and the patient. For example, measuring the Pocket depth (PD) value of each tooth requires an electronic probe to be inserted under the gingival until it reaches the bone. It is also a time-consuming and expensive task [2]. Moreover, for research purposes, we may not usually be able to examine a large number of patients due to time and cost limitations. Thus, the power of the study would be declined dramatically [2]. A partial-mouth assessment is considered as an alternative method which aims to diminish these practical matters. However, some concerns exist over the accuracy and reliability of such examinations for evaluation of the disease severity [4]. It seems that periodontal diseases are site- and tooth-specific [5-9], and thus it is unlikely that partial-mouth examination will provide an accurate assessment of the level of disease [2]. However, many studies have shown a left-right symmetry in teeth parameters [6-9], i.e., assessment of one upper and one lower quadrants can provide an appropriate substitute for full-mouth examination [2]. Some other partial-mouth examination methods include: the upper right and lower left quadrants (UR/LL), the upper right and lower right quadrants (UR/LR), the upper left and lower left quadrants (UL/LL), and the Ramfjord teeth (teeth # 3, 9, 12, 19, 25 and 28) [1,2].
Partial-mouth assessment often includes examination of index teeth, such as the Ramfjord index teeth [1, 2]. The Ramfjord teeth comprise maxillary left and mandibular right central incisors, maxillary left and mandibular right first premolars, and maxillary right and mandibular left first molars (teeth #3, 9, 12, 25, and 28). Also, in a study managed by the Third National Health and Nutrition Examination Survey (NHANES III) that is in USA, only limited sites per tooth including mesio-buccal and mid-buccal sites were examined [5].
The current study aims to evaluate some partial-mouth examination schemes as alternatives for whole-mouth examination (including examination of all parameters for a subset of teeth, examination of a subset of parameters for whole teeth, etc).
For each tooth, we aim to be able to measure just a subset of parameters for each tooth and estimate unmeasured parameters from the parameters measured for the same tooth or its neighbor teeth.
For each patient, the following parameters had been measured and recorded for all teeth: recession, MGJ, PD and tooth mobility. The values of two parameters recession and PD are examined in six sites per tooth (three points at the facial side and three points at the lingual or palatal side). For upper teeth, MGJ has just one value for the facial side,
Effective Estimation of Periodontal Parameters:
A Fuzzy Rule-based System Aimed at
Partial-Mouth Examination
Elham Ansarifard, Seyed Mostafa Fakhrahmad
while for lower teeth, it has a pair of values for both facial and lingual sides. Tooth mobility has just one value for each tooth.
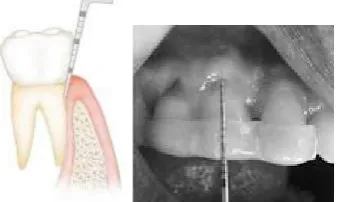
PD of a tooth is the periodontal pocket depth around the tooth (under the gingiva). The only accurate method of measuring PD values is careful exploration with a periodontal probe, which is a time-consuming and challenging task. Fig 1 shows the probing task for such measurements.
Fig. 1. Periodontal probing for measurement of tooth parameters
PD values cannot be detected by radiography. Radiographs indicate areas of bone loss in which pockets may be suspected. The pocket presence and pocket depth cannot be seen in radiographs and thus no difference is shown before and after pocket elimination. The PD value measured by a probe is the distance from the gingival margin to which the probe penetrates the pocket.
MGJ is a parameter which represents level of gingival attachment. It is roughly defined as the junction between the attached gingiva and the relatively loose and movable alveolar mucosa.
Tooth mobility is a probable factor which is checked with a metal instrument and one finger. Periodontal researchers are interested in finding hidden correlations among the mentioned parameters in order to be used in partial-mouth examination.
In this paper, we first design a data mining system to discover hidden relationships among the parameters. The data we used for this purpose includes whole-mouth examination results of more than 600 patients who had at least 24 existing teeth. This data had been recorded by different periodontists of Shiraz Dental School. For each of the 32 teeth, 14 values were recorded as periodontal parameters (recession and PD, each in 6 sites, MGJ and mobility). Thus, the total number of features in the dataset equals 448. Based on the results of the mining process, we are going to propose a fuzzy based system and use rule-weight learning as a mechanism to tune it.
Finally to validate our claim and obtained rules, the estimated values with the values recorded through whole-mouth examination. The performance of the estimation system will be assessed by use of Mean Square Error (MSE) by 10-fold cross validation.
The rest of the paper is organized as follows. In Section 2, we give a general introduction to the proposed system. Section 3 presents Approximate Dependency Miner, which is used for discovery of correlations among periodontal parameters, as well as some empirical rules obtained. Section 4 presents the fuzzy estimation method and the results. Finally, Section 5 concludes the paper.
II. PARTIAL-MOUTH EXAMINATION SYSTEM
As mentioned in Section 1, the main goal of this paper is to find new partial-mouth examination schemes. If we can discover some probable hidden relations among different metrics, we will be able to develop an estimation system to estimate some metrics’ values from a combination of others. So, the examiner will be required to provide just a subset of metric values.
In the estimation part, mainly we focus on the three following goals:
1- Estimating some periodontal parameters for a special tooth from other parameters of the same tooth (denoted as Type I dependencies).
2- Estimating periodontal parameters of a tooth using the same parameters of its neighbor teeth (denoted as Type II dependencies).
[image:2.595.88.257.168.269.2]3- Estimating periodontal parameters of a tooth using the parameters of the same# tooth on the opposite quadrant (denoted as Type III dependencies). The proposed system is composed of two major components, namely the approximate dependency miner and the parameter estimation part. A high-level view of the system is shown in Fig 2.
Fig. 2. Architecture of the partial-mouth examination system
III. DISCOVERY OF DEPENDENCIES
Functional dependencies (FDs) are defined as relationships between attributes of a relational scheme R, and are presented in expressions of the form X → A. In this expression X (referred to as the Left-Hand Side (LHS) of the dependency) is a subset of attributes belonging to R and A (referred to as the Right-Hand Side (RHS) of the dependency) is an attribute of R. A functional dependency is said to be valid in a given relation r over R , if for all pairs of tuples t, u belonging to r, we have
(1)
Values of other mouth parameters
Values of a subset of mouth parameters
Dependency Miner
Estimation part
Where t[x] is the value assigned to the attribute x of the tuple t.
Classical Functional dependencies are used in relational schema design in order to normalize relations to be free of redundancy and update anomalies. These dependencies do not allow for exceptions and are sensitive to noisy data. Approximate Dependencies (ADs) are dependencies which do not hold over a fraction of data and thus have a higher flexibility for exceptions and noisy data.
In dependency mining part of the system, we use AD-Miner which was proposed in [10] as an incremental mining algorithm. This algorithm uses logical operations on binary strings to find the set of minimal approximate dependencies (having an acceptable accuracy) between attributes. Most of other dependency mining approaches already proposed are not incremental and so have to re-scan all data and repeat the whole computations when a number of records are added to the database [11-14].
In this part of the system, we are interested in discovery of any existing dependency between the values of periodontal parameters. In other words, we look for any short combination of features which can describe one or more other features. Since the algorithm requires discrete or nominal data, as a preprocessing step, we discretized all features into equi-size partitions. To decrease the dependence on the no. of partitions, the algorithm was run frequently, using 3 to 7 partitions for discritization.
Since the number of features in the dataset is very high, the process of mining dependencies among all of them is a
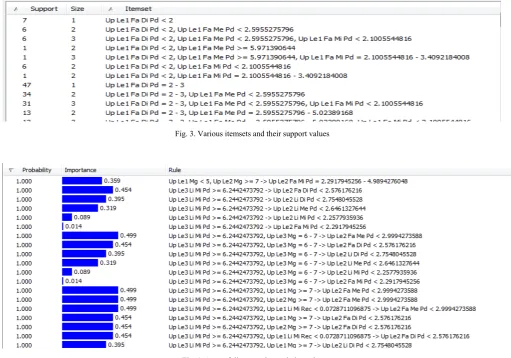
very complicated and time-consuming task. Moreover, many dependencies are useless because they have a very low support. Thus, before starting the mining process, we first selected the features having an acceptable support value, i.e., frequent itemsets. Fig 3 shows a set of itemsets which are then filtered (according to their support values) to be analyzed for discovery of inter-relationships.
As a matter of fact, each dependency stands for a set of association rules. Each rule shows a correlation between one value combination of the inputs and a special value of the output. A typical dependency will be discovered if all of its association rules hold having an acceptable confidence. In Fig 4, some of the discovered association rules are shown. Each rule has a probability value (showing its confidence) and an importance value, which shows how many training instances are supported by this rule and how important it is to be aware of such a rule. Rules having common features (with different values) will lead to generation of approximate dependencies.
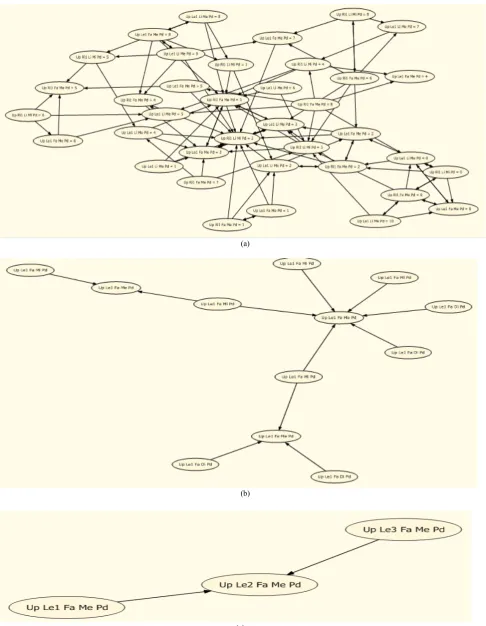
[image:3.595.45.557.404.762.2]Finally, for any of features, the best combination of other features (having the highest value of dependency in average) was selected as its determinant. In other words, the most accurate dependencies among features were extracted. Figures 5.a and 5.b show the whole dependency graph obtained by this mining process, using the minimum accuracy thresholds 60% and 90%, respectively.
Fig. 3. Various itemsets and their support values
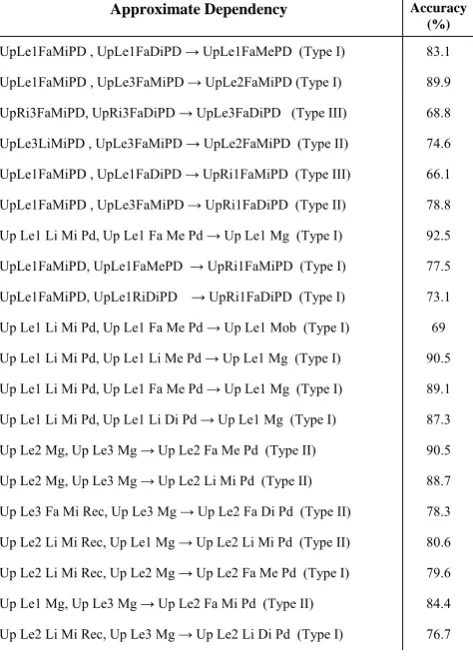
Fig 5.c shows the determinants of the parameter UpLe2FaMePD (as an example feature) which can be used to approximate this parameter's value with a good accuracy. Some part of the results of this phase over the dataset features is shown in Table I. The results are just the
dependencies of the upper left teeth #1,2 and 3, all of which contain two features at their LHS. Determinant features found for each feature will then be used in the estimation part of the system. The minimum accuracy threshold for this discovery mining process was set to 60%.
(a)
(b)
[image:4.595.57.544.139.766.2](c)
TABLE I
The results of the Dependency Miner part: short-length dependencies among Features
Accuracy (%)
Approximate Dependency
83.1
89.9
68.8
74.6
66.1
78.8
92.5
77.5
73.1
69
90.5
89.1
87.3
90.5
88.7
78.3
80.6
79.6
84.4
76.7
UpLe1FaMiPD , UpLe1FaDiPD → UpLe1FaMePD (Type I)
UpLe1FaMiPD , UpLe3FaMiPD → UpLe2FaMiPD (Type I)
UpRi3FaMiPD, UpRi3FaDiPD → UpLe3FaDiPD (Type III)
UpLe3LiMiPD , UpLe3FaMiPD → UpLe2FaMiPD (Type II)
UpLe1FaMiPD , UpLe1FaDiPD → UpRi1FaMiPD (Type III)
UpLe1FaMiPD , UpLe3FaMiPD → UpRi1FaDiPD (Type II)
Up Le1 Li Mi Pd, Up Le1 Fa Me Pd → Up Le1 Mg (Type I)
UpLe1FaMiPD, UpLe1FaMePD → UpRi1FaMiPD (Type I)
UpLe1FaMiPD, UpLe1RiDiPD → UpRi1FaDiPD (Type I)
Up Le1 Li Mi Pd, Up Le1 Fa Me Pd → Up Le1 Mob (Type I)
Up Le1 Li Mi Pd, Up Le1 Li Me Pd → Up Le1 Mg (Type I)
Up Le1 Li Mi Pd, Up Le1 Fa Me Pd → Up Le1 Mg (Type I)
Up Le1 Li Mi Pd, Up Le1 Li Di Pd → Up Le1 Mg (Type I)
Up Le2 Mg, Up Le3 Mg → Up Le2 Fa Me Pd (Type II)
Up Le2 Mg, Up Le3 Mg → Up Le2 Li Mi Pd (Type II)
Up Le3 Fa Mi Rec, Up Le3 Mg → Up Le2 Fa Di Pd (Type II)
Up Le2 Li Mi Rec, Up Le1 Mg → Up Le2 Li Mi Pd (Type II)
Up Le2 Li Mi Rec, Up Le2 Mg → Up Le2 Fa Me Pd (Type I)
Up Le1 Mg, Up Le3 Mg → Up Le2 Fa Mi Pd (Type II)
Up Le2 Li Mi Rec, Up Le3 Mg → Up Le2 Li Di Pd (Type I)
IV. FUZZY ESTIMATION SYSTEMS
The proposed defect prediction system is composed of three major components, namely the approximate dependency miner, the estimation part and the fuzzy rule-based classifier. This part of the paper explains the two part of system that utilizes the dependencies obtained from previous part and prove the effectiveness of our system. A.Wang & Mendel method
In this part of the system, we follow the Wang and Mendel’s fuzzy rule learning method [15] and develop a set of fuzzy modeling systems with similar structures. Each of these fuzzy modeling systems is constructed to estimate the value of a mouth parameter using a combination of other mouth parameters as its determinants (discovered in the previous section).
The data-driven Rule-base generation process proposed by Wang and Mendel in [16] has been widely known because of its simplicity and good performance. It is based on working with an input-output data set, representing the behavior of the problem under investigation, using a previous definition of the DB composed of the input and output primary fuzzy partitions.
The generation of the rule-base is accomplished through the following steps:
1. Defining fuzzy partitions for the input variables:
It can be obtained from the expert information or by a normalization process. In the second case, we should perform a fuzzy partition of the input variable spaces dividing each universe of discourse into a number of equal
[image:5.595.51.288.94.426.2]or unequal partitions and select a kind of membership function and assign one fuzzy set to each subspace. For simplicity, we usually work with symmetrical fuzzy partitions of triangular membership functions (see Fig 6).
Fig. 6. Equi-width fuzzy sets used in the fuzzy estimation system
2. Generating a linguistic rule set:
This set will be formed by the rule best covering each example (input-output data pair) contained in training data. Thus, p candidate linguistic rules will be obtained. The structure of these rules is obtained by taking a specific example, i.e., an n + 1-dimensional real array (n input and 1 output.
3. Giving an importance degree to each rule:
Let (Rl = IF x1 is A1 and . . . and xn is An THEN y is B) be the linguistic rule generated from the
example el, l = 1; : : : ; p. The importance de-gree associated to it will be obtained as follows:
(2) 4. Obtaining a final rule-base from the candidate linguistic rule set:
To do so, the p candidate rules are first grouped in g different groups, each composed of all the candidate rules presenting the same antecedent. The j-th rule in the i-th group is denoted as Rij. To compose the final rule-base, the rule with the highest importance degree is chosen in each group i, i = 1,…, g. Hence, g will be both the number of different antecedent combinations in the candidate rule set and the number of linguistic rules in the final rule-base generated.
However, the operation mode followed by WM method is to bracket the training data set into fuzzy subspaces (the antecedent combinations mentioned in step 4 of the algorithm) according to the covering degree, and to obtain the rule with the best performance in each subspace.
[image:5.595.322.523.124.209.2]Thus, for each combination of inputs the best output fuzzy set is selected and the dimensions of the array will reduce to n. Fig 7 shows this array for a 2-dimensional input variable space (X1 and X2 are input variables).
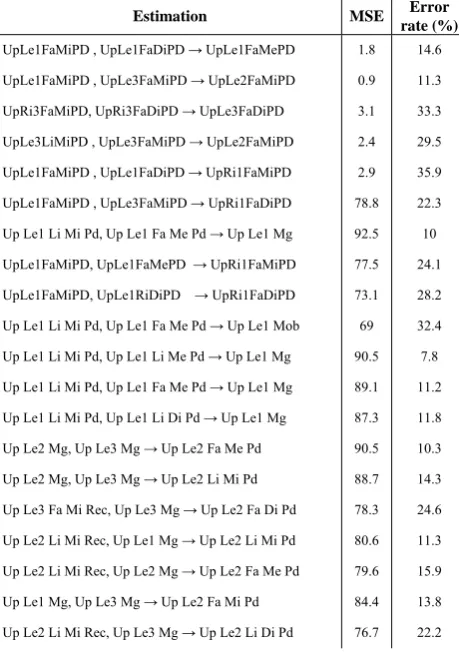
TABLE II
Evaluation results of the estimation system in terms of MSE and error rate for some of the discovered rules
Estimation MSE Error
rate (%)
UpLe1FaMiPD , UpLe1FaDiPD → UpLe1FaMePD
UpLe1FaMiPD , UpLe3FaMiPD → UpLe2FaMiPD
UpRi3FaMiPD, UpRi3FaDiPD → UpLe3FaDiPD
UpLe3LiMiPD , UpLe3FaMiPD → UpLe2FaMiPD
UpLe1FaMiPD , UpLe1FaDiPD → UpRi1FaMiPD
UpLe1FaMiPD , UpLe3FaMiPD → UpRi1FaDiPD
Up Le1 Li Mi Pd, Up Le1 Fa Me Pd → Up Le1 Mg
UpLe1FaMiPD, UpLe1FaMePD → UpRi1FaMiPD
UpLe1FaMiPD, UpLe1RiDiPD → UpRi1FaDiPD
Up Le1 Li Mi Pd, Up Le1 Fa Me Pd → Up Le1 Mob
Up Le1 Li Mi Pd, Up Le1 Li Me Pd → Up Le1 Mg
Up Le1 Li Mi Pd, Up Le1 Fa Me Pd → Up Le1 Mg
Up Le1 Li Mi Pd, Up Le1 Li Di Pd → Up Le1 Mg
Up Le2 Mg, Up Le3 Mg → Up Le2 Fa Me Pd
Up Le2 Mg, Up Le3 Mg → Up Le2 Li Mi Pd
Up Le3 Fa Mi Rec, Up Le3 Mg → Up Le2 Fa Di Pd
Up Le2 Li Mi Rec, Up Le1 Mg → Up Le2 Li Mi Pd
Up Le2 Li Mi Rec, Up Le2 Mg → Up Le2 Fa Me Pd
Up Le1 Mg, Up Le3 Mg → Up Le2 Fa Mi Pd
Up Le2 Li Mi Rec, Up Le3 Mg → Up Le2 Li Di Pd
[image:6.595.52.282.102.429.2]1.8 0.9 3.1 2.4 2.9 78.8 92.5 77.5 73.1 69 90.5 89.1 87.3 90.5 88.7 78.3 80.6 79.6 84.4 76.7 14.6 11.3 33.3 29.5 35.9 22.3 10 24.1 28.2 32.4 7.8 11.2 11.8 10.3 14.3 24.6 11.3 15.9 13.8 22.2
[image:6.595.47.290.497.650.2]Fig 9 visualizes the behavior of the estimation system in mapping the PD values of the mesial point of the facial side for the upper left teeth #1 and #3 to the same feature value of the tooth #2.
Fig. 9. The surface viewer of approximated functions mapping easy-to-measure metrics into hard-to-easy-to-measure ones
For each discovered dependency, a similar estimation system has been designed. In other words, the final result of this work is a set of mapping functions, each of which gives the estimated value of a periodontal parameter according to the values of some (two or more) other parameters.
V. CONCLUSION
In this paper, we introduced a parameter estimation
system to be used for partial-mouth examination. The system is aimed to estimate periodontal parameters based on the set of three different types of correlations it has discovered among parameters. The system was assessed using a datasets we collected from the patients' information which had been recorded in Shiraz Dental School. In the mining part of the system, a set of dependencies among features of the dataset were discovered. Then, we developed a set of fuzzy modeling systems, each of which estimates the value of one of the periodontal features from its specified determinants. In this part of the system, we followed the Wang and Mendel’s fuzzy rule learning method. The evaluation of the estimation systems was accomplished by computing the MSE values for all features. The results showed the high ability of the system in terms of approximation and thus, it can be used as a time-saving alternative for full-mouth examination.
REFERENCES
[1] Beck JD, Arbes SJ. Epidemiology of gingival and periodontal diseases. In: Carranza FA, NewmanNewman MG, Takei HH, Klokkevold PR. Carranza’s clinical periodontology. 10th ed. Philadelphia: Elsevier Saunders; 2006. pp. 110-29.
[2] Owens JD, Dowsett SA, Eckert GJ, Zero DT, Kowolik MJ. Partial-mouth assessment of periodontal disease in an adult population of the United States. J Periodontol 2003 Aug;74(8):1206-13.
[3] Dowsett SA, Eckert GJ, Kowolik MJ. The applicability of half-mouth examination to periodontal disease assessment in untreated adult populations. J Periodontol 2002 Sep;73(9):975-81.
[4] Beck JD, Löe H. Epidemiological principles in studying periodontal diseases. Periodontol 2000 Jun;2:34-45.
[5] Albandar JM, Brunelle JA, Kingman A. Destructive periodontal disease in adults 30 years of age and older in the United States, 1988-1994. J Periodontol 1999 Jan;70(1):13-29.
[6] Dowsett SA, Archila L, Segreto VA, Eckert GJ, Kowolik MJ. Periodontal disease status of an indigenous population of Guatemala, Central America. J Clin Periodontol 2001 Jul;28(7):663-71.
[7] Okamoto H, Yoneyama T, Lindhe J, Haffajee A, Socransky S. Methods of evaluating periodontal disease data in epidemiological research. J Clin Periodontol 1988 Aug;15(7):430-9.
[8] Haffajee AD, Socransky SS, Goodson JM, Lindhe J. Intraclass correlations of periodontal measurements. J Clin Periodontol 1985 Mar;12(3): 216-24.
[9] Haffajee AD, Socransky SS. Frequency distributions of periodontal attachment loss. Clinical and microbiological features. J Clin Periodontol 1986 Jul;13(6):625-37.
[10] S.M. Fakhrahmad, M.H. sadreddini, M. Zolghadri jahromi, (2008). AD − Miner: A new incremental method for discovery of minimal approximate dependencies using logical operations, Intelligent Data Analysis 12, pp. 1–13.
[11] P. A. Flach and I. Savnik. (1999). Database dependency discovery: a machine learning approach, AI communications, 12 (3). pp. 139–160. [12] Y. Huhtala, J. Kärkkäinen, P. Porkka and H. Toivonen. (1999) TANE:
An Efficient Algorithm for Discovering Functional and Approximate Dependencies. The Computer Journal. 42(2). pp. 100–111.
[13] Y. Huhtala , J. Kärkkäinen , P. Porkka and H. Toivonen, Efficient Discovery of Functional and Approximate Dependencies Using Partitions, In: Proc. the Fourteenth International Conference on Data Engineering, (February 1998), pp. 392 - 401.
[14] S. Lopes , J.M. Petit , L. Lakhal, Efficient Discovery of Functional Dependencies and Armstrong Relations, in: Proc. ICDT 2000, the 7th International Conference on Extending Database Technology: Advances in Database Technology, vol 1777, pp. 350 – 364, 2000. [15] S.L. Wang, J.S. Tsai, B.C. Chang, "Mining Approximate
Dependencies using partitions on Similarity-Relation-based Fuzzy databases", in : Proc. IEEE SMC'99, Vol. 6, pp. 871–875, 1999. [16] Wang L-X, Mendel JM (1992) Fuzzy basis functions, universal
approximation, and orthogonal least squares learning. IEEE Trans. Neural Network 3, 807–814.