Abstract—Feature selection aims to reduce the dimensionality of patterns for classification by selecting the most informative instead of irrelevant and/or redundant features. In this paper, fuzzy feature clustering is proposed for grouping features based on their interdependence and selecting the best one from each cluster. Different novel fuzzification techniques for selection step are also introduced. Applying chi-square test, this approach considers the dependence of each feature on class labels during selection. Hence, it leads to remove redundant clusters of features which are unrelated to the class labels. The proposed method has two advantages. Firstly, it has more stability and faster convergence due to fuzzy clustering; secondly, it improves the accuracy of the classifier using the selected features. Experimental results demonstrate the good performances of this method on UCI benchmark data sets.
Index Terms— Feature Selection, Fuzzy Logic, Clustering, Mutual Information, Chi-square test.
I. INTRODUCTION
By now, many applications have been introduced in which, feature selection is utilized as a preprocessing stage for classification. This process speeds up both the training and reasoning stages, reduces memory space, and improves classification accuracy. Reducing the cost of gathering data is another advantage of feature selection.
Small number of samples narrows the acquirable knowledge. Hence it reduces the probability of correct reasoning whether a specified feature effects on the class label or not. Moreover, a classifier can generate the classification rules more easily with small number of features. But increasing the number of features may lead to ambiguity in training so that it would not even converge.
In addition, the more features, the more processing time and memory space is needed. But a few influential features are usually adequately used in classification of samples. Indeed:
• The class label is usually independent of the most of features.
• Some features may be correlated and selecting only a few candidates seems to be sufficient for classification.
Manuscript received September 2, 2008.
E. Chitsaz is with Computer Science and Engineering Department of Shiraz University, Shiraz, Iran. (phone:+98-917-7171660, email: [email protected])
M. Taheri is with Computer Science and Engineering Department of Shiraz University, Shiraz, Iran. (email: [email protected])
S. D. Katebi is with Computer Science and Engineering Department of Shiraz University, Shiraz, Iran. (email: katebi@ shirazu.ac.ir)
M. Z. Jahromi is with Computer Science and Engineering Department of Shiraz University, Shiraz, Iran. (email: zjahromii@ shirazu.ac.ir)
Finding proper features has been the subject of various approaches in the literature. (e.g. filter, wrapper, and embedded approaches [5], greedy [18], statistical approaches such as the typical principle component analysis (PCA) method [2] and the linear discriminant analysis (LDA) method [1], GA [6, 15], Neural Network [16], Fuzzy Systems [14, 17], mutual information-based feature selection[19,20]. Recently, biclustering algorithms [7, 21] have been proposed to cluster both features and samples simultaneously. Wai-Ho Au et al., in 2005 [9], proposed a feature selection technique based on clustering the correlated features by a semi-k-means method named k-modes.
In this paper an approach which uses fuzzy version of k-mode has been introduced [24] for grouping interdependent features. Different novel techniques have been proposed to fuzzify the selection of the best features from each cluster. Chi-square test is then applied to assess whether the considered feature is independent of class labels; hence, it leads to remove unrelated clusters to classification process and improve the selection of features. The proposed method gains improvement on classification accuracy and at the same time selects less number of features which leads to simplification of learning task to a great extent.
C4.5 [3] classifier has been applied in the final stage to asses the feature selection process. Some UCI benchmark datasets including Sonar, WDBC, Wine and Lung-cancer are used in experimental results to show the improved performance of the proposed method in comparison with previous methods.
In the next section previous work of feature clustering is explained. In section 3, the fuzzy approach of feature clustering is then introduced followed by different new fuzzification techniques in selection of features from clusters in section 4. Afterwards the novel application of chi-square test for removing redundant clusters is presented in section 5. Experimental results are demonstrated in section 6. Finally we draw our conclusion in section 7.
II. ATTRIBUTE CLUSTERING ALGORITHM
The attribute clustering algorithm (ACA) has been developed by Wai-Ho Au et al., in 2005 [9], for grouping, selection, and classification of gene expression data which consists of a large number of genes (features) but a small number of samples.
This approach finds c disjoint clusters and assigns each feature to one of the clusters. The genes in each cluster should have a high correlation with each other while they are low correlated to genes in other clusters. This method uses the
interdependence redundancy measure as the similarity
An Improved Fuzzy Feature Clustering and
Selection based on Chi-Squared-Test
measure.
To cluster features, the k-modes algorithm is utilized which is similar to the well known clustering method, k-means [11].
Mode of each cluster is defined as one of its features which has the largest multiple interdependence redundancy measure among other features in that cluster. The multiple interdependence redundancy measure is calculated for each feature by (1).
(1)
( )
∑
(
)
≠∈=
i j i Cluster A j i i jA
A
R
A
MR
), (:
Where, Cluster(i) is the set of features which are in the same cluster with Ai and is the interdependence measure
between the two features, Ai and Aj, which is defined by (2).
(2)
(
) (
(
)
)
j i j i j iA
A
H
A
A
I
A
A
R
:
:
:
=
Where, I(Ai:Aj) is the mutual information between Ai and Aj
as computed in (3).
(3)
(
)
(
)
(
i ik)
(
j jl)
jl j ik i m k m l jl j ik i j iv
A
v
A
v
A
v
A
v
A
v
A
A
A
I
i j=
=
=
=
=
=
=
∑∑
= =Pr
Pr
^
Pr
log
^
Pr
)
:
(
1 1H(Ai:Aj) is joint entropy of Ai and Aj which is given by (4).
(4)
(
)
(
i ik j jl)
m k m l jl j ik i j iv
A
v
A
v
A
v
A
A
A
H
i j=
=
=
=
−
=
∑∑
= =^
Pr
log
^
Pr
)
:
(
1 1H(Ai:Aj) is used to normalize I(Ai:Aj) in (2). The larger
value for I(Ai:Aj), the higher interdependency of two features,
Ai and Aj. Hence, there should be some pairs of values for
these features which are simultaneously visited with high frequency and other pairs are less probable. Therefore, having one of the values, other one may be approximated considering value pairs with high probability.
K-modes is different from k-means in two points. First, mode of each cluster is selected as the cluster center instead of the mean. Second, use of Euclidean distance as the dissimilarity measure is substituted by the interdependency between attributes as a similarity measure.
In ACA method, genes are grouped into different clusters. A cluster is a set of features which are more correlated in comparison with features in other clusters. Hence, if there is a missed value for one of these features, it may be approximated considering other co-cluster features one by one. Therefore, a feature in each cluster may be sufficient to present properties of samples. But the selected feature should be overall correlated with other features in the same cluster. This is the motivation of selecting features with highest multiple
interdependence redundancy measure, as defined by (1), to
represent the cluster.
III. FUZZY ATTRIBUTE CLUSTERING ALGORITHM A method proposed by author [24] which combines the effectiveness of ACA with fuzzy k-means algorithm. In this method each feature is assigned to different clusters with different degrees. This comes from the idea that each feature may not belong to just one cluster and it is much better to
consider the correlation of each feature to features in entire clusters. Hence, during the selection of the best features, more accurate relations between features are available. In this method better features might be selected for classification stage over crisp method.
In the proposed method matrix Uk×m represents the
membership degree of each gene in each cluster where k is the number of clusters that is fixed and determined at first and m
is the number of features. Matrix U is computed by (5), a modified version of (4), where distance functional is defined as the inverse of interdependency measure.
(5)
(
)
(
)
∑
= −
=
k c m r i c i riA
R
A
R
u
1 1 2,
,
1
η
η
Where, k is number of clusters. uri is membership degree of
ith feature in rth cluster and m is a weighting exponent. Afterwards, to satisfy (2), uri is normalized by (6).
(6)
∑
==
k l old li new ri new riu
u
u
1According to this membership matrix, fuzzy multiple interdependence redundancy measure is defined by (7) which is a modified version of (1).
(7)
∑
==
k l old li new ri new riu
u
u
1Where, p is the total number of features and r is the cluster number in which the multiple interdependence redundancy measure of feature Ai is calculated. Hence, in calculating
MRr(Ai) the entire features are considered.
Indeed, fuzzy multiple interdependence redundancy measure should be computed for each cluster separately since each feature is not belonged to just one cluster. In this approach, mode of a cluster is updated to the feature with the highest fuzzy multiple interdependence redundancy in that cluster. Fuzzy multiple interdependence redundancy of each feature should be calculated regardless of its own membership degree in associated cluster. Considering this membership degree, mode of each cluster will never change, since it has high membership degree in that cluster.
The objective function in the proposed fuzzy method is computed as (8).
(8)
(
)
∑∑
= ==
k r p i r i m riR
A
u
J
1 1
:
η
Where, k and p are the number of clusters and features respectively and ηr is mode of r
th
cluster which represents center of that cluster.
IV. NOVEL FUZZIFICATION TECHNIQUES IN SELECTION OF FEATURES FROM CLUSTERS
After Clustering of features, the best one should be selected from each cluster. In this paper different techniques are proposed in order to consider fuzzy memberships of features in clusters during selection. At first each feature is consider to belong to a cluster which has highest membership degree. Members of rth cluster are represented by membersr. Rank of each feature in its cluster is calculated and the one with highest rank is selected as the candidate of its cluster. Four novel techniques for calculating the rank of each feature in fuzzy approach are introduced below:
1.In this method the feature which has the most interdependence with other features in associated cluster is selected as the best feature. Rank of each feature is calculated according to (9).
( )
∑
(
)
≠ = = = d i j j j i m rj m ri i r ir A MR A u u RA A
rank , 1 : ) ( (9) 2.This technique does not consider the features which are not members of associated cluster. Hence, the interdependency of the considered feature with its co-cluster features is just taken into account. Rank of each feature in this method is calculated by (10).
(
)
∑
≠ ∈ = i j members j j i m rj m ri i r r A A R u u A rank , : ) ( (10) 3.The third technique assigns a positive weight to theinterdependency of features which are belonged to membersr. It also assigns a negative weight as a penalty to the interdependency of features which are not belonged to membersr. The assigned weight is equal to the membership degree of the feature in its cluster. Therefore, the selected feature would be more interdependent with its co-cluster features and less interdependent with other clusters’ members. Calculating the rank of each feature in this method is performed according to (11).
(
)
(
)
− =∑
∑
≠ ∉ ≠ ∈ i j members j j i m rj m ri i j members j j i m rj m ri i r r r A A R u u A A R u u A rank , , : . : . ) ( (11) 4.The fourth method is similar to the previous methodexcept that the features which has higher membership degree in the associated cluster but are not belonged to this cluster take less penalty. Equation (12) presents calculation of rank in this method.
(
)
(
)
− + =∑
∑
≠ ∉ ≠ ∈ i j members j j i m rj m ri i j members j j i m rj m ri i r r r A A R u u A A R u u A rank , , : ) 1 ( . : . ) ( (12) The fourth method is applied in experimental results.V. CLUSTER REMOVAL BASED ON CHI-SQUARE-TEST In this section an improvement on selecting best features and also removing redundant clusters based on chi-square-test is proposed.
A chi-square test [22] is any statistical hypothesis test in which the test statistic has a chi-square distribution when the null hypothesis is true, or any in which the probability distribution of the test statistic (assuming the null hypothesis is true) can be made to approximate a chi-square distribution as closely as desired by making the sample size large enough.
Pearson's chi-square (χ2) test [23] is the best-known of several chi-square tests – statistical procedures whose results are evaluated by reference to the chi-square distribution.
The first step in the chi-square test is to calculate the chi-square statistic according to (13). The chi-square statistic is calculated by finding the difference between each observed and theoretical frequency for each possible outcome, squaring them, dividing each by the theoretical frequency, and taking the sum of the results.
(
)
∑∑
= =−
=
R i K j ij ij ijE
E
O
1 1 2 2χ
(13) whereOij = an observed frequency;
Eij = an expected (theoretical) frequency, asserted by the
null hypothesis;
= the number of possible outcomes of each event. The chi-square statistic can then be used to calculate a p-value by comparing the value of the statistic to a chi-square distribution. The number of degrees of freedom is equal to the number of possible outcomes, minus 1.
Pearson's chi-square is used to assess two types of comparison: tests of goodness of fit and tests of
independence. A test of goodness of fit establishes whether or not an observed frequency distribution differs from a theoretical distribution. A test of independence assesses whether paired observations on two variables, expressed in a contingency table, are independent of each other.
A chi-square probability of 0.05 or less is commonly interpreted by applied workers as justification for rejecting the null hypothesis that the row variable is unrelated (that is, only randomly related) to the column variable. The alternate hypothesis is not rejected when the variables have an associated relationship.
As mentioned above, a chi-square test may be applied on a contingency table for testing a null hypothesis of
independence of rows and columns. In this paper chi-square test has been applied for testing the independence of a feature values and class labels.
associated feature on the class labels during feature selection. Thus, it certainly helps to improve classification results.
[image:4.595.320.502.59.204.2]VI. EXPERIMENTAL RESULTS C4.5 decision tree is applied for assessing the classification based on selected features. Some UCI benchmark datasets are used in experiments which their characteristics are mentioned in Table 1.
Table 1. Datasets Characteristics
Data set
Number of Samples
Number of features
Number of Classess
Sonar
208
60
2
WDBC
569
30
2
Wine
178
13
3
Lung-cancer
32
56
3 [image:4.595.58.246.427.573.2]
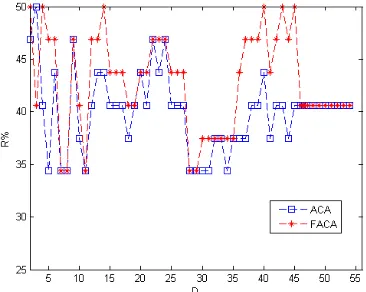
Classification rate can be used for assessing the feature selection methods. Classification results for Attribute Clustering Algorithm (ACA) in comparison with Fuzzy Attribute Clustering Algorithm (FACA) are demonstrated in figures 1 to 4. Leaved-one-out method is applied for assessment of classification.
Figure 1. Classification Accuracy (R%) for Sonar Dataset based on Number of Selected Features (D)
Figure 2. Classification Accuracy (R%) for WDBC Dataset based on Number of Selected Features (D)
Figure 3. Classification Accuracy (R%) for Wine Dataset based on Number of Selected Features (D)
Figure 4. Classification Accuracy (R%) for Lung-Cancer Dataset based on Number of Selected Features (D)
According to the obtained results, the ability of clustering in very high or very low cluster numbers can not be
distinguishable. Therefore, only in these cases FACA depicts worst results. In all other cases FACA gains so much better results in comparison with ACA.
[image:4.595.318.501.444.590.2]Table 2. Comparison of Classification Accuracy without selection and with 2/3 of features selected
Dataset
Sonar
WDBC Wine Lung
Number of Clusters
40 20 10 40
Without selection
76.44
92.62
95.5
40.6
ACA
74.04
93.50
92.7
43.7 [image:5.595.42.277.81.206.2]
FACA
79.81
95.08
95.5
50.0
Table 3 to 5 shows considerable improvement in
classification and at the same time decrement in number of selected features due to cluster removal based on
chi-square-test.
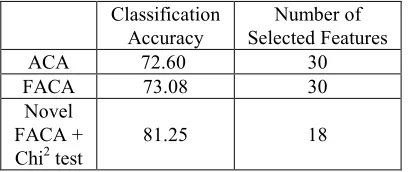
Table 3. Comparison of methods according to classification accuracy and number of selected features for Sonar dataset (number of clusters=30)
Classification Accuracy
Number of Selected Features
ACA 72.60 30
FACA 73.08 30
Novel FACA + Chi2 test
81.25 18
As you can see, the novel approach based on chi-square-test removes 12 unrelated clusters.
Table 4. Comparison of methods according to classification accuracy and number of selected features for WDBC dataset (number of clusters=10)
Classification Accuracy
Number of Selected Features
ACA 90.86 10
FACA 91.56 10
Novel FACA + Chi2 test
93.50 7
Table 5. Comparison of methods according to classification accuracy and number of selected features for Lung-Cancer dataset (number of clusters=40)
Classification Accuracy
Number of Selected Features
ACA 43.75 40
FACA 50.00 40
Novel FACA + Chi2 test
62.50 8
VII. CONCLUSION
In this paper, an improvement on fuzzy clustering and selection of features is proposed based on chi-square-test for removing redundant clusters. This method not only improves classification accuracy, but also simplifies learning task by
selecting less number of features to a great extent. Different novel techniques for selecting best feature from each cluster in fuzzy approach are also suggested in this research.
Further work will improve the similarity measure in clustering or using subtractive clustering which does not need to initialize fix number of clusters.
REFERENCES
[1] K. Fukunaga, 'Introduction to Statistical Pattern Recognition', New York: Academic, 1972.
[2] I. T. Joliffe, 'Principal Component Analysis', New York: Springer-Verlag, 1986.
[3] Quinlan, J. R. 'C4.5: Programs for Machine Learning',
Morgan Kaufmann Publishers, 1993.
[4] Jim C. Bezdek. 'Fuzzy Mathematics in Pattern Classification', PhD thesis, Applied Math. Center, Cornell University, Ithaca, 1973.
[5] Isabelle Guyon and Andr´e Elisseeff, 'An introduction to variable and feature selection', Journal of Machine Learning Research, vol. 3, pp. 1157–1182, 2003.
[6] F. Z. Bril, D. E. Brown, and N. W. Worthy, 'Fast genetic selection of features for neural network classifiers', IEEE Trans. Neural Networks, vol. 3, pp. 324–328, Mar. 1992. [7] S.C. Madeira and A.L. Oliveira, 'Biclustering Algorithms for
Biological Data Analysis: A Survey', IEEE/ACM Trans. Computational Biology and Bioinformatics, vol. 1, no. 1, pp. 24-45, Jan.-Mar. 2004.
[8] M Xiong, W Li, J Zhao, L Jin, and E Boerwinkle, 'Feature (gene) selection in gene expression-based tumor classification', Mol Genet Metab, vol. 73, no. 3, pp. 239–47, 2001.
[9] Wai-Ho Au, Keith C. C. Chan, Andrew K. C. Wong, Yang Wang, 'Attribute Clustering for Grouping, Selection, and Classification of Gene Expression Data', IEEE/ACM Transactions on Computational Biology and Bioinformatics (TCBB). Vol 2, no.2, pp: 83-101, (2005).
[10] Golub TR, Slonim DK, Tamayo P, Huard C, Gaasenbeek M, Mesirov JP, Coller H, Loh ML, Downing JR, Caligiuri MA, Bloomfield CD, Lander ES., 'Molecular classification of cancer: class discovery and class prediction by gene expression monitoring', 286(5439):531-7, 1999.
[11] T. Kanungo, D. Mount, N. Netanyahu, C. Piatko, R. Silverman, and A. Wu., 'A local search approximation algorithm for k-means clustering', Comput. Geom., vol 28, pp:89-112, 2004.
[12] Mic´o, M.L., Oncina, J., Vidal, E., 'A new version of the nearest-neighbour approximating and eliminating search algorithm (AESA) with linear preprocessing time and memory requirements', Pattern Recognition, Vol. 15, pp. 9–17, 1994.
[13] M. Taheri, R. Boostani, 'Novel auxiliary techniques in clustering', International Conf. on computer science and engineering, 2007.
[14] E. C. C. Tsang, D. S. Yeung, and X. Z. Wang, 'OFFSS: Optimal Fuzzy-Valued Feature Subset Selection', IEEE Trans. on Fuzzy Systems, vol. 11, no. 2, 2003.
[15] M. L. Raymer, W. F. Punch, E. D. Goodman, L. A. Kuhn, and L. C. Jain., 'Dimensionality reduction using genetic algorithms', IEEE Trans. on Evolutionary Computation, vol. 4, no. 2, pp:164 -171, 2000.
[16] R. Setiono and H. Liu, 'Neural-network feature selector', IEEE Trans. Neural Networks, vol. 8, pp. 654–662, May 1997.
[17] M.R. Rezaee, B. Goedhart, B.P.F. Lelieveldt, J.H.C. Reiber,
[image:5.595.41.246.316.402.2] [image:5.595.40.249.488.575.2] [image:5.595.41.254.625.731.2][18] R. Caruana and D. Fratage, 'Greedy attribute selection', in Machine Learning: Proc. 11th Int. Conf., San Francisco, CA, pp:283–288, 1994.
[19] R. Battiti, 'Using mutual information for selecting features in supervised neural net learning', IEEE Trans. Neural Networks, vol. 5, pp:537–550, July 1994.
[20] N.Kwak and C.-H. Choi, 'Input feature selection for classification problems', IEEE Trans. Neural Networks, vol. 13, pp:143–159, Jan. 2002.
[21] Y. Cheng and G.M. Church, 'Biclustering of Expression Data', Proc. Eighth Int’l Conf. Intelligent Systems for Molecular Biology, pp: 93-103, 2000.
[22] Kenney, J. F. and Keeping, E. S. Mathematics of Statistics, Pt. 2, 2nd ed. Princeton, NJ: Van Nostrand, 1951.
[23] Plackett, R.L. "Karl Pearson and the Chi-Squared Test". International Statistical Review, vol. 51, no.1, pp: 59–72. 1983.