Experiments on the Capability of Wavelet Domain Noise
Suppression: Comparison with Spatial Domain Noise
Suppression
Abdul Rasak Zubair
Electrical/Electronic Engineering Department University of Ibadan Ibadan, Nigeria
ABSTRACT
Image noise can occur during image acquisition, transmission or storage. Noises in images are caused by many factors such as atmospheric or intermediate media in-homogeneity and relative motion between the object and the camera. An application of wavelet transform is noise suppression in signals; image signals inclusive. The wavelet transform of a noisy color image has 2D wavelet coefficients for each of the red, green and blue channels. The 2D wavelet coefficients are grouped into Approximation part and Details part. The coefficients in the Details part with values less than a threshold value represent the noise content. For the purpose of noise suppression, Threshold Shrinkage Functions are used to modify the coefficients in the Details part. Experiments on image noise suppression capability of Hard Threshold Shrinkage Function (HTSF), Soft Threshold Shrinkage Function (STSF), Hyperbola Threshold Shrinkage Function (HYTSF), Garrote Threshold Shrinkage Function (GTSF) and Modified Garrote Threshold Shrinkage Function (MGTSF) are presented. Six types of noise are considered. Noise suppression in the wavelet domain by the five wavelet threshold shrinkage functions is compared with noise suppression in the spatial domain by the Gaussian Filter (G), Median Filter (MDN), Alpha-Trimmed Mean [4 Pixels Excluded] Filter (AT4P), Mean Filter (MEAN) and Texture Synthesis Adaptive Median Filter (TSBAMF). Optimum threshold value is obtained with the logarithm in the universal threshold equation taken to base 10. MGTSF and GTSF are found to be the best wavelet de-noising schemes for the suppression of Poisson noise and Speckle noise respectively. HYTSF is found to be the best wavelet de-noising scheme for both the Localvar noise and the Gaussian noise. Wavelet de-noising is recommended to be limited to first decomposition level as filtered images at higher decomposition levels are marred with blurring and undesirable edges. Wavelet de-noising is found not suitable for the suppression of Random Valued Impulse noise and Salt & Pepper noise; spatial domain de-noising is highly effective for both noise types. Suppression of Localvar noise, Poisson noise, Gaussian noise, and Speckle noise is found to yield good results in the wavelet domain but yield better results in the spatial domain.
General Terms
Digital Signal Processing, Digital Image Processing, Image De-noising.
Keywords
Image noise, Wavelet transform, Threshold shrinkage functions, Spatial domain filters, Peak signal to noise ratio.
1.
INTRODUCTION
Suppression of noise in images is an active area of research [1], [2], [3], [4], [5], [6], [7]. Images are often corrupted with noise. Noise can occur during image capture, transmission or
processing, and may be dependent on or independent of image content [8], [9], [10]. Noises in images are caused by many sources. These include atmospheric or intermediate media in-homogeneity, relative motion between object and camera, fluctuation in heat, temperature, and infrared radiation, inherent thermal noises in electro optical imaging devices, and physical or chemical noises of the object.
Noise suppression in the spatial domain was studied with the aid of experiments in [11]. Spatial filters based on thirteen statistics were tested for the suppression of six types of noise [11]. Gaussian Filter (G) is found to be the best spatial filter for the suppression of Gaussian Noise, Localvar Noise and Speckle Noise [11]. Median Filter (MDN) and Alpha-Trimmed Mean [4 Pixels Excluded] Filter (AT4P) are the best filters for the suppression of Salt & Pepper Noise and Poisson Noise respectively [11]. Mean Filter (MEAN) is also good for noise suppression. MDN filter is further studied in [12] and a Texture Synthesis Adaptive Median Filter (TSBAMF) was developed in [13].
In this work, Noise suppression in the wavelet domain is studied with the aid of experiments and compared with spatial domain filters mentioned above; namely G, MDN, AT4P, MEAN and TSBAMF. A wavelet is defined as a small wave whose energy is concentrated in time [14], [15], [16], [17], [18], [19]. Wavelets applications include noise filtering [19], [20], [21], [22].
2.
DE-NOISING IN WAVELET DOMAIN
Fig. 1 illustrates Wavelet de-noising scheme. X (NN-by-MM-by-3) is a color image and is a three-dimensional signal. X is corrupted with noise to yield a noisy image Xn. Six types of noise are considered; Gaussian noise, Poisson noise, Speckle noise, Speckle noise, Salt & Pepper noise, Random Valued Impulse noise and Localvar noise [9], [11], [12], [13], [23]. Y (NN-by-MM-by-3) is the Haar wavelet transform of Xn at LLth decomposition level. Y is easily obtained as described in [18], [24].
At
LL
2
, A2 is the Approximation part while HD2, VD2, DD2, HD1, VD1 and DD1 together constitute the Details part. AtLL
3
, A3 is the Approximation part while HD3, VD3, DD3, HD2, VD2, DD2, HD1, VD1 and DD1 together constitute the Details part.A Threshold Shrinkage Function is used to modify the details part Yd to give modified details part Ymd; any element in Yd which is equal to or less than a threshold is set to zero while an element which is greater than the threshold is modified. Five Threshold Shrinkage functions are considered in this work. These are Hard Threshold Shrinkage Function (HTSF), Soft Threshold Shrinkage Function (STSF), Hyperbola Threshold Shrinkage Function (HYTSF), Garrote Threshold Shrinkage Function (GTSF) and Modified Garrote Threshold
Shrinkage Function (MGTSF) which are defined by Eqns. (1), (2), (3), (4) and (5) respectively [17], [19], [20], [21], [22], [25]. σ, t and λ are defined as the noise level, universal threshold and modified universal threshold respectively and are given by Eqns. (6), (7) and (8) respectively [17], [19], [20], [21], [22], [25].
)
,
(
i
j
Y
md
otherwise
0
)
,
(
for
)
,
(
i
j
Y
i
j
t
Y
d d(1)
The untouched approximation part Ya is recombined with modified details part Ymd to give modified wavelet transform Yf. The Inverse wavelet transformation of Yf gives de-noised or filtered image Xf.
Fig 1: Image de-noising in the wavelet domain.
[image:2.595.71.529.242.638.2](a) X (b) Y after LL1 (c) Y after LL2 (d) Y after LL3
Fig 2: Regions or components of 2D wavelet transform for each color channel [18]
Y
md(
i
,
j
)
otherwise
0
)
,
(
for
)
,
(
)
,
(
sgn
Y
di
j
Y
di
j
t
Y
di
j
t
(2)
)
,
(
i
j
Y
md
otherwise
0
)
,
(
for
)
,
(
,
(
sgn
Y
di
j
Y
di
j
2t
2Y
di
j
t
Y
md(
i
,
j
)
otherwise
0
)
,
(
for
)
,
(
)
,
(
2t
j
i
Y
j
i
Y
t
j
i
Y
d d d (4)
Y
md(
i
,
j
)
otherwise
0
)
,
(
for
)
,
(
)
(
)
,
(
2
2
j
i
Y
j
i
Y
j
i
Y
d d d (5)
6745
.
0
dY
median
(6))
(
2
Log
N
t
b
(7)
where N is the number of elements in Yd.
t
(8)
where α is a tuning constant. Optimum value for α is 0.4 [22]. The wavelet de-noising scheme performance is evaluated using the Peak Signal to Noise Ratio (PSNR) [11], [12], [13], [26]. PSNRc of Eqn. (9) compares the noisy image Xn with the original image X. PSNRf of Eqn. (10) compares the de-noised image Xf with the original image X. The Gain of Eqn. (11) is positive if there is some degree of noise suppression. The Frequency Estimate of X of each test image is measured with Eqn. (12), (13), and (14) [27].
3.
RESULTS AND DISCUSSIONS
A test bed of twelve images is formed to study wavelet domain noise suppression capability. Some of the images are from the University of Southern California (USC)-Signal and Image Processing Institute (SIPI) Image Database [28].
3.1
Test for Optimum Threshold Value
The optimization of the universal threshold t of Eqn. (7) is studied by varying the base b of the logarithm. Five test images are used for the optimization test.
A corrupted test image is filtered with b = 2 using the HTSF. Values of the threshold t for the three color channels and the filtering Gain are evaluated. This process is repeated for STSF, HYTSF, GTSF, and MGTSF. The experiment is repeated with b = e = 2.7183. The experiment is again repeated with b = 10. The results are presented in Figs. 3 and 4.
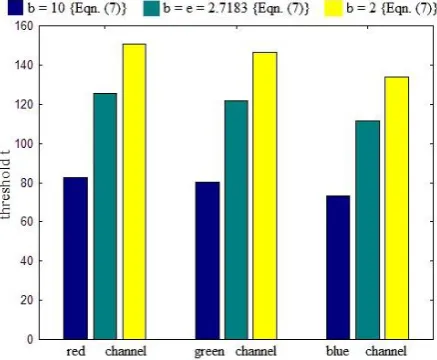
[image:3.595.320.539.266.446.2]The processes are then repeated with another four corrupted test images. The averages of the results for the five test images are presented in Figs. 5 and 6. Figs. 3 to 6 show that the lowest threshold value and highest Gain are obtained when b is 10. 10 is therefore the optimum value for b of Eqn. (7).
Fig 3: Optimization test results for a test image; values of threshold t for the three color channels and for the three
values of b
3.2
Test for Suppression of Poisson Noise
The twelve test images are corrupted with Poisson noise. The five shrinkage functions with
b
10
in Eqn. (7) andLL
1
were applied for the filtering of the noisy images. The average of the Gain values for the twelve test images for each of the five threshold shrinkage functions is shown in the bar chart of Fig. 7.
NN i MM j k n ck
j
i
X
k
j
i
X
MM
NN
Log
PSNR
1 1 3 1 2 10)
,
,
(
)
,
,
(
)
)(
(
3
1
255
10
(9)
NN i MM j k f fk
j
i
X
k
j
i
X
MM
NN
Log
PSNR
1 1 3 1 2 10)
,
,
(
)
,
,
(
)
)(
(
3
1
255
10
(10) c fPSNR
PSNR
Gain
Estimate
Frequency
(
)
)
1
(
3
1
3
1
i
X
j
X
MM
NN
NN
MM
(12)where
c
k
NN
i
MM
j
k
j
i
X
k
j
i
X
j
X
1 1 2
,
1
,
,
,
(13)and
31 1 2
,
,
1
,
,
k
MM
j
NN
i
k
j
i
X
k
j
i
X
i
X
[image:4.595.104.532.59.700.2](14)
Fig 4: Optimization test results for a test image; Gain for the five threshold shrinkage functions and for the three
values of b
Fig 5: Optimization test results for five test images; Average of the threshold values for the three color
channels and for the three values of b
[image:4.595.321.537.294.704.2]Fig. 7 also compares Poisson noise suppression in the wavelet domain by the five wavelet threshold shrinkage functions with Poisson noise suppression in the spatial domain by G, MDN, AT4P, MEAN and TSBAMF. On the basis of the average, Poisson noise suppression is found to be more productive in the wavelet domain than the spatial domain. MGTSF and AT4P are found to be the best wavelet and spatial domain
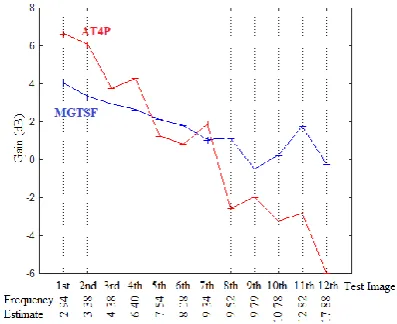
Fig. 8 shows the actual Gain obtained with MGTSF and AT4P for each of the twelve test images. The Frequency Estimate of the twelve test images are indicated in Fig. 8. Fig. 9 shows the result for the first test image. The test images with lower Frequency Estimate tend to yield higher Gain. At lower Frequency Estimate, AT4P has higher Gain than MGTSF. MGTSF has higher Gain than AT4P at higher Frequency Estimate.
Fig 6: Optimization test results for five test images; Average of the Gain values for the five threshold shrinkage functions and for the three values of b
[image:4.595.61.275.437.633.2]3.3
Test for Suppression of Localvar Noise
[image:5.595.320.538.70.269.2]The experiment in section 3.2 is repeated with Localvar noise. The results are presented in Fig. 10. Localvar noise suppression is better in the spatial domain than the wavelet domain. HYTSF and G are found to be the best wavelet and spatial domain filtering schemes respectively for Localvar noise suppression. Fig. 11 shows the actual Gain obtained with HYTSF and G for each of the twelve test images. Fig. 12 shows the result for the third test image.
Fig 8: the Actual Gain obtained with MGTSF and AT4P for each of the twelve test images corrupted with Poisson
noise
Fig 9: Results of the test for suppression of Poisson noise for the first test image
[image:5.595.68.267.175.337.2]Fig 10: Localvar noise suppression test results; Average of the Gain values for the twelve test images
[image:5.595.64.270.343.585.2]Fig 11: Actual Gain obtained with HYTSF and G for each of the twelve test images corrupted with Localvar noise
[image:5.595.327.531.493.714.2]3.4
Test for Suppression of Salt & Pepper
Noise
The experiment in section 3.2 is repeated with Salt & Pepper noise. The results are presented in Fig. 13. Suppression of Salt & Pepper noise in the wavelet domain is very poor compared with spatial domain. STSF and TSBAMF are found to be the best wavelet and spatial domain filtering schemes respectively for Salt & Pepper noise suppression. Fig. 14 shows the actual Gain obtained with STSF and TSBAMF for each of the twelve test images. Fig. 15 shows the result for the fourth test image.
3.5
Test for Suppression of Gaussian Noise
[image:6.595.326.531.70.272.2]The experiment in section 3.2 is repeated with Gaussian noise. The results are presented in Fig. 16. Gaussian noise suppression is better in the spatial domain than the wavelet domain. HYTSF and G are found to be the best wavelet and spatial domain filtering schemes respectively for Gaussian noise suppression. Fig. 17 shows the actual Gain obtained with HYTSF and G for each of the twelve test images. Fig. 18 shows the result for the fifth test image.
[image:6.595.318.535.302.502.2]Fig 13: Salt & Pepper noise suppression test results; Average of the Gain values for the twelve test images
Fig 14: Actual Gain obtained with STSF and TSBAMF for each of the twelve test images corrupted with Salt &
Pepper noise
Fig 15: Results of the test for suppression of Salt & Pepper noise for the fourth test image
[image:6.595.64.273.302.490.2]Fig 16: Gaussian noise suppression test results; Average of the Gain values for the twelve test images
[image:6.595.326.530.522.699.2] [image:6.595.65.271.525.688.2]Fig 18: Results of the test for suppression of Gaussian noise for the fifth test image
3.6
Test for Suppression of Speckle Noise
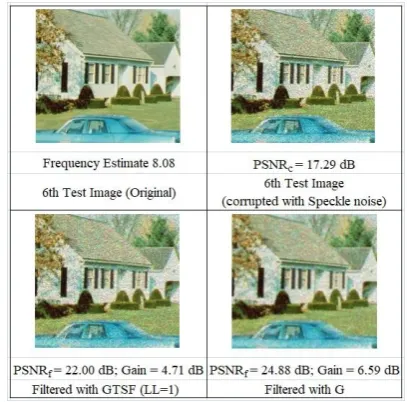
[image:7.595.329.529.71.234.2]The experiment in section 3.2 is repeated with Speckle noise. The results are presented in Fig. 19. Speckle noise suppression is better in the spatial domain than the wavelet domain. GTSF and G are found to be the best wavelet and spatial domain filtering schemes respectively for Speckle noise suppression. Fig. 20 shows the actual Gain obtained with HYTSF and G for each of the twelve test images. Fig. 21 shows the result for the sixth test image.
[image:7.595.326.530.395.596.2]Fig 19: Speckle noise suppression test results; Average of the Gain values for the twelve test images
Fig 20: Actual Gain obtained with GTSF and G for each of the twelve test images corrupted with Speckle noise
3.7
Test for Suppression of Random
Valued Impulse Noise
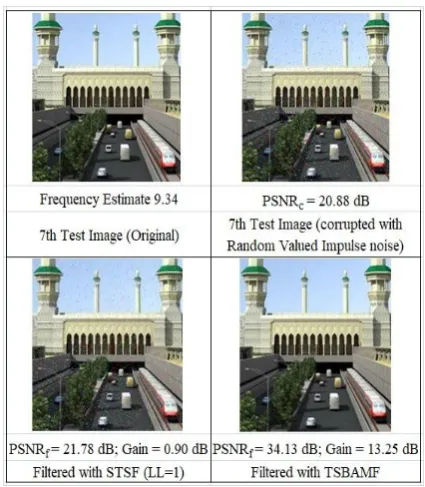
The experiment in section 3.2 is repeated with Random Valued Impulse noise. The results are presented in Fig. 22. Random Valued Impulse noise suppression in the wavelet domain is very poor compared with the spatial domain. STSF and TSBAMF are found to be the best wavelet and spatial domain filtering schemes respectively for Random Valued Impulse noise suppression. Fig. 23 shows the actual Gain obtained with STSF and TSBAMF for each of the twelve test images. Fig. 24 shows the result for the seventh test image.
[image:7.595.62.272.408.600.2]Fig 22: Random Valued Impulse noise suppression test results; Average of the Gain values for the twelve test
[image:8.595.322.535.69.313.2]images
Fig 23: Actual Gain obtained with STSF and TSBAMF for each of the twelve test images corrupted with Random
[image:8.595.55.284.71.302.2]Valued Impulse noise
Fig. 24: Results of the test for suppression of Random Valued Impulse noise for the seventh test image
3.8
Test for the Effect of Wavelet
Decomposition Level
The GTSF with
b
10
in Eqn. (7) andLL
1
was appliedto de-noise the second test image corrupted with Speckle noise. The HYTSF with
b
10
in Eqn. (7) andLL
1
wasapplied to de-noise the third test image corrupted with Localvar noise. The GTSF and HYTSF experiments on the second and the third test images respectively were repeated with
LL
2
andLL
3
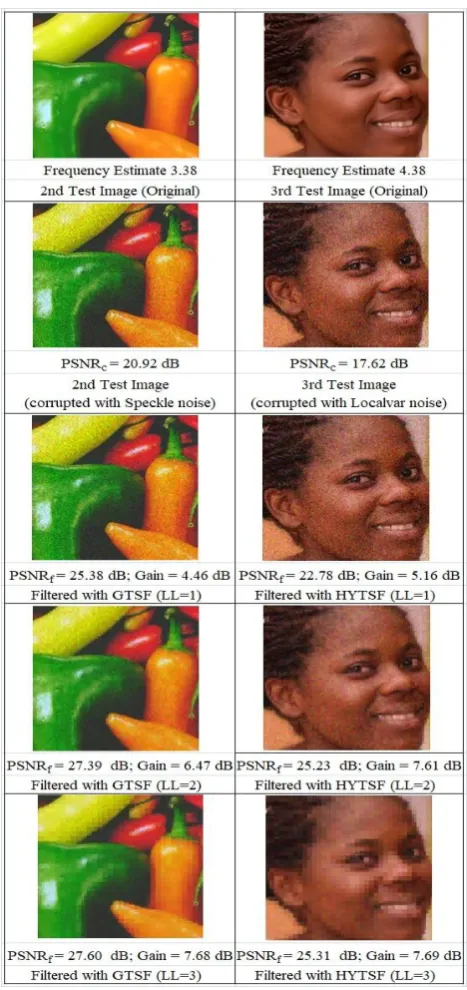
.The results are presented in Fig. 25. The higher decomposition levels, the better noise suppression (the higher Gain). At higher decomposition levels, the filtered images are blurred and are marred with undesirable edges as observed in Fig. 25. Therefore, wavelet de-noising is better limited to the first decomposition level only.
4.
CONCLUSIONS
[image:8.595.59.275.286.559.2]Fig. 25: Results of the test for the effect of the wavelet decomposition level LL
5.
REFERENCES
[1] Pinar, C. 2009. "Removal of Random-Valued Impulsive Noise from Corrupted Images." IEEE Transactions on Consumer Electronics, vol. 55, pp. 2097-2104.
[2] Saxena, C. and Kourav, D. 2014. “Noises and Image Denoising Techniques: A Brief Survey.” International Journal of Emerging Technology and Advanced Engineering, vol. 4, no. 3, pp. 878-885.
[3] Das, A. K. 2014. "Review of Image Denoising Techniques." International Journal of Emerging Technology and Advanced Engineering, vol. 4, no. 8, pp. 519-522.
[4] Gupta, K. and Gupta, S. K. 2013. “Image Denoising Techniques – A Review paper.” International Journal of
Innovative Technology and Exploring Engineering (IJITEE), vol. 2, no. 4. pp. 6-9.
[5] Patidar, P., Gupta, M., Srivastava, S. and Nagawat, A. K. 2010. “Image De-noising by Various Filters for Different Noise.” International Journal of Computer Applications, November 2010, vol. 9, no. 4, pp. 45-50.
[6] Govindaraj, V. and Sengottaiyan, G. 2013. “Survey of Image Denoising using Different Filters.” International Journal of Science, Engineering and Technology Research (IJSETR), vol. 2, no. 2, pp. 344-351.
[7] Gupta, G. 2011. ‘‘Algorithm for Image Processing Using Improved Median Filter and Comparison of Mean, Median and Improved Median Filter.’’ International Journal of Soft Computing and Engineering (IJSCE), vol. 1, no. 5, pp. 304-311.
[8] Chanda, B. and Majumer, D. D. 2000. Digital Image Processing and Analysis. India: Prentice-Hall.
[9] Gonzalez, R. C. and Woods, R. E. 2002. Digital Image Processing. Massachusetts: Addison-Wesley.
[10] Tony, F. C. and Jianhong, S. 2005. Image Processing and Analysis: Variational, PDE, Wavelet, and Stochastic Methods. Philadelphia: SIAM.
[11] Zubair, A. R. and Fakolujo, O. A. 2013. “Development of Statistics and Convolution as Tools for Image Noise Suppression: Statistical Performance Analysis of Spatial Filters.” African Journal of Computing & ICT, vol 6, pp. 53-66.
[12] Zubair, A. R. and Busari, H. O. 2018. “Robustness of Median Filter for suppression of Salt and Pepper Noise (SPN) and Random Valued Impulse Noise (RVIN).” International Journal of Image Processing (IJIP), vol. 12, no. 1, pp. 12-27.
[13] Zubair, A. R. 2018. “Texture Synthesis Based Adaptive Median Filter.” International Journal of Scientific & Engineering Research, vol. 9, no. 5, pp. 1300-1308. [14] Soman, K. P. 2010. “Insight into wavelets: From theory
to practice.” PHI Learning Pvt. Ltd, pp. 45-237. [15] Mallat, S. 2008. A wavelet tour of signal processing: the
sparse way. Academic press, pp. 80-336.
[16] Burrus, C. S., Gopinath, R. A., Guo, H., Odegard, J. E. and Selesnick, I. W. 1998. Introduction to wavelets and wavelet transforms: a primer. New Jersey, Prentice hall. [17] Van Fleet, P. J. 2011. Discrete wavelet transformations:
An elementary approach with applications. John Wiley & Sons, 157-346.
[18] Zubair, A. R. and Ahmed, Y. K. 2019. “Engineering Education: Computer-Aided Engineering with MATLAB; Discrete Wavelet Transform as a Case Study.” International Journal of Computer Applications, vol. 182, no. 46, pp. 6-17.
[19] Donoho, D. L. and Johnstone, I. M. 1994. “Ideal denoising in an orthonormal basis chosen from a library of bases.” Comptes Rendus de l’Académie Des Sciences. Série I, Mathématique, vol. 319, no. 12, pp. 1317–1322. [20] Hongqiao L. and Shengqian W. 2009. “A New Image
Denoising Method Using Wavelet Transform.” International Forum on Information Technology and Applications (IFITA), Chengdu, 111-114.
of EMG noise and motion artifact in ambulatory ECG.” Engineering in Medicine and Biology Society (EMBC), Annual International Conference of the IEEE, pp. 7087– 7090.
[22]Zubair A. R., Ahmed Y. K. and Akande K. A. 2018. “Electromyography Noise Suppression in Electrocardiogram Signal Using Modified Garrote Threshold Shrinkage Function.” African Journal of Computing & ICT, vol. 11, no. 3, pp. 85-94.
[23]MathWorks (MATLAB). 2019. Documentation for MathWorks products retrieved from http://www.mathworks.com/access/helpdesk/help/helpde sk.shtml on May 1, 2019.
[24]Gabriel, P. 2018. “Wavelet tool box.” Retrieved from (https://mathworks.com/matlabcentral/fileexchange/5104 -toolbox-wavelets), MATLAB Central File Exchange on June 28, 2018.
[25] Huimin, C. U. I., Ruimei, Z. and Yanli, H. O. U. 2012. “Improved threshold denoising method based on wavelet transform.” Physics Procedia, vol. 33, pp. 1354–1359. [26] Choy, S. S. O., Chan, Y. and Siu, W. 1996. “An
Improved Quantitative Measure of Image Restoration Quality.” Proc. IEEE International Conference on Acoustics, Speech and Signal Processing (ICASSP'96), vol. III, pp 1613-1616.
[27] Zubair, A. R. 2019. “Image as a Signal: Review of the Concept of Image Frequency Estimate.” Computing, Information Systems & Development Informatics Journal, vol. 10, no. 1, pp. 73-86.
[28] USC-SIPI Image Database. 2019. “Standard Test
Images.’’ Retrieved from
![Fig 2: Regions or components of 2D wavelet transform for each color channel [18]](https://thumb-us.123doks.com/thumbv2/123dok_us/9301429.429052/2.595.71.529.242.638/fig-regions-components-d-wavelet-transform-color-channel.webp)