1313
Comparison of Design optimization using Genetic
Algorithm approach and DOE approach
Amandeep Singh Wadhwa
Department of Mechanical Engineering,
University Institute of Engineering and Technology, Punjab University, Chandigarh Email: [email protected]
Abstract: The aim of this paper is to compare the Genetic Algorithm and DOE approach of design of compressor bearing. In the GA approach an objective function is formed which is defined as sum of coefficient of friction,frictional power loss,maximum temperature rise of the lubricant oil,oil flow rate and manufacturing cost with design variables as length of bearing and bearing pressure and bearing modulus as design constraint. In DOE approach the three input parameters taken are absolute viscosity(Z) of the lubricant, speed of journal( N) and maximum allowable pressure. The output parameter is coefficient of friction which has to be minimized. Taguchi L9 array is used to solve the problem in which set of nine input combinations of the three input
In Taguchi method there are three input parameters and nine input combinations in form of L9 array and the optimized result is obtained with nine experiments instead of 27 thereby saving a lot of time and money.
Index Terms- mutation; crossover; objective function; array; regression
1. INTRODUCTION
Genetic Algorithm are set of global search and optimization methods that is fast gaining popularity in solving complex engineering optimization problems with large search space. G.A is method of moving from one population to a new population of chromosomes by using natural selection together with the genetic search process of cross over and mutation GA works on principle of survival of fittest and the central theme of research on genetic algorithm has been robustness, the balance between efficiency and efficacy necessary for the survival in many different environments.
Tools of genetic Algorithm:- Genetic algorithm (GA) operates with the help of three operators namely:-
1. Reproduction 2. Mutation 3. Cross Over
1. Reproduction:- This is the first operator which is applied to the existing population to create new and better offsprings. The offsprings whose probability of selection is less is rejected and the offsprings whose probability of selection is high are selected and carried forward. The probability of selection of particular string is proportional to its own fitness.
2.Mutation:- Mutation is aimed to maintain diversity is population and it creates a new solution in neighborhood of current solution by introduction small change in some aspect of current solution, for example in a binary coded digit one bit may be altered from 0 to 1 or from 1 to and thus creating new solution Bit Mutated New Bit
110110 110010
3. Crossover:- In crossover process the crossing site is randomly chosen along the string length and all the bits to the right side of this crossing site are exchanged between two parent strings as;
0 0 00 0 0 0 01 1 1 1 1 1 1 1 1 10 0
In Taguchi method there are three input parameters and nine input combinations in form of L9 array and the optimized result is obtained with nine experiments instead of 27 thereby saving a lot of time and money.
2. PROBLEM FORMULATION IN GA
In problem formulation an objective function has to minimize which is defined as sum of:-
a) Coefficient of friction b) Frictional power loss
c) Maximum oil film temperature rise d) Supply oil quantity
e) Manufacturing cost
The design variables are taken as the length of bearing (l) and bearing pressure (p) and the design constraint is bearing modulus given by ZN/p
1314
Fig 1. Variation of bearing modulus with coefficient of friction
The value of bearing modulus at which coefficient of friction is minimum is denoted by C. For bearing to operate in film lubrication region the value of bearing modulus should be greater than C. For safe design, and its life will decrease.
3. DEFINING THE PROBLEM IN GA
i)Coefficient of friction =π2
/30 X10 6(ZN/p)r/c ii)Frictional torque loss = π2
Zd3ln/Cd N-m
iii)Heat Generated=f F v watt iv)Heat dissipated= Kdld(tB –t A) watt
tB –t A =1/2(to – t A)
v)Supply oil quantity=3πC3
r/0.1 X 10 9 zl ps X10 6
mm/s
vi)Manufacturing Cost =Rate X ρπ/4d 2
l Rs
The objective function is to minimize i), ii), iii), v) and vi) and maximize iv) or to minimize reciprocal of iv). The objective function to be minimized is given by:- f(l,p)= π2
Consider the following design parameters of sample bearings set used for compressors:
Table 1 Design Parameters
S. No
Bearing Parameters Value
1 Load,F 30 kN
2 Absolute Viscosity,Z .018 Ns/m2
3 Speed,N 900 rpm
4 Diameter of Journal,d 0.15m
5 Temperature of oil film,to 55°C
6 Supply Pressure,ps 1MPa
The clearance ratio c/r for compressor bearing is 0.0013. For the given set of parameters the objective functions given by (I) can be written as;
f(l,p)=46.091 l + 868.050/p +0.00153/l …Eqn II
5. OPTIMIZED RESULT USING G.A
A program is developed in C language after making some modification according to our design problem in standard G.A. code available for various references Once input data mentioned in Table 2is given, the output can be obtained from 3 files i.e. result out, plot out and report out after running the program.
Table 2: G.A. input data
1 Population Size 20 2 Total no of
generations
1315 Fig: 2. Variation of best fitness with number of
generations(Run2)
3. The variation of objective function with the no. of generations is shown in Fig 2. It can be seen that as G.A get started and run continuously an improvement is found in the best fitness and towards the end of run a form of convergence is observed.
4. Using G.A. the optimized value of design variables are
l = .150005 mts p = 1344102.8061 N/m2
The optimized value of objective function using G.A. is 6.9247 i.e. f(l, p) = 6.9247
Conventional design calculations
Taking l/d=1.5,l=0.225m
p=F/ld=30 X10 3/.225X.15=88888888.88 N/m2
f(l,p)=10.378 (from equation II)
The value of objective function using conventional method = 10.378
Table 3. Conventional Method Vs GA
S No.
Conventional Method G.A
1 Frictional Torque
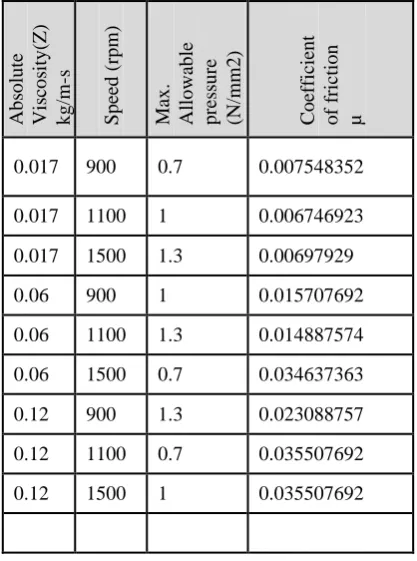
Experimental design strategy, using Taguchi orthogonal arrays concept as used. The following L-9 orthogonal array was applies
Table 4. L-9 Orthogonal array with actual values
Abs
Observations in Taguchi Analysis: Coefficient of friction µ versus Absolute Viscosity, Speed in rpm, Max. Allowable pressure (N/mm2)
1316 Table 5 General linear Model (ANOVA) for µ
S confidence level. In an analysis of variance table, the P value determines the most significant factor. The factor whose P value is less than 0.05 will be most effective factor. The ANOVA table clearly indicates that speed in rpm and maximum allowable pressure (N/mm2) are not significant parameter for optimizing the coefficient of friction µ. Absolute Viscosity (kg/m-s), is the significant term that influence the model to a great extent. Absolute Viscosity (kg/m-s) has the greatest effect on optimizing coefficient of friction µ and is followed by maximum allowable pressure (N/mm2) and speed in rpm
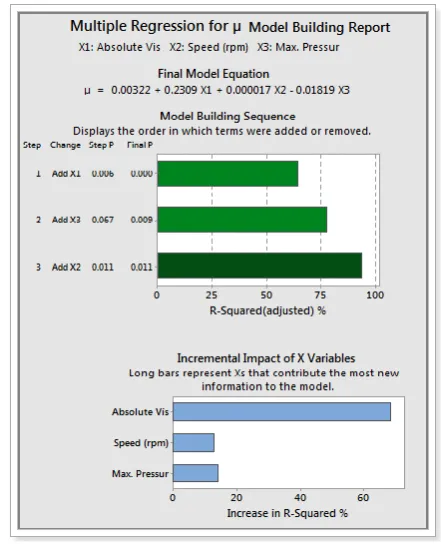
6.1 General Regression equation for Coefficient of friction µ, Absolute Viscosity, Speed in rpm, maximum allowable pressure (N/mm2).
The following equation has been formed with the help of software MINITAB version 17:
Coefficient of friction = 0.00322 + 0.2309 Absolute Viscosity + 0.000017 Speed - 0.01819 maximum allowable pressure.
6.2 Optimized parameters combination
1317
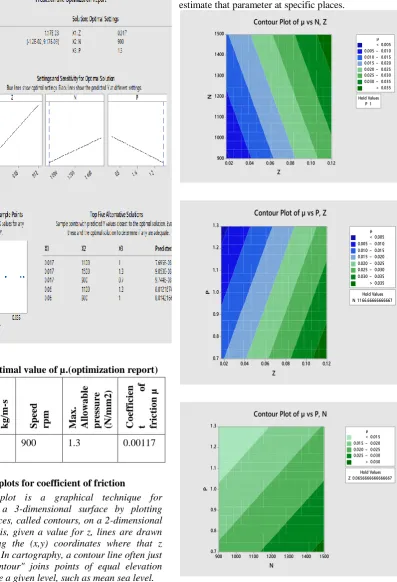
Table 6 Optimal value of µ.(optimization report)
S
6.3 Contour plots for coefficient of friction
A contour plot is a graphical technique for representing a 3-dimensional surface by plotting constant z slices, called contours, on a 2-dimensional format. That is, given a value for z, lines are drawn for connecting the (x,y) coordinates where that z value occurs. In cartography, a contour line often just called a "contour" joins points of equal elevation (height) above a given level, such as mean sea level.
The configuration of these contours allows map readers to infer relative gradient of a parameter and estimate that parameter at specific places.
1318
7. CONCLUSION
The optimized value of length of bearing and bearing pressure are obtained through genetic algorithm and also by conventional method. The different parameters of the objective function are calculated by both these methods and the comparison is made between the two different approaches of design and the result are tabulated in Table 5, the following conclusions can be drawn from the above analysis:-
a) Reduction in frictional torque using G.A. 10.366-6.911/10.366 = 33.3%
b) Reduction in coefficient of friction using G.A. 0046 - .0030/.0046 = 34.7%
c) Reduction in manufacturing cost using G.A. 0039 - .0026/.0039 = 33.3%
d) Reduction in temperature rise using G.A. 785.19-518.23/785.19 = 33.9%
e) Increase in flow rate using G.A 0024 - .0016/.0024 = 33.3%
Overall reduction in objective function using G.A
10.378 – 6.9247/10.378 = 33.27%
Hence it is concluded that there is improvement in the characteristics of the compressor bearing using
Genetic Algorithm approach of design by approximately 33%
In DOE approach the optimized value of coefficient of friction comes out to be at absolute viscosity of 0.017 kg/m-s, speed of 900 rpm and allowable pressure of 1.3 N/mm2.Further from Table 5 it is evident that maximum contribution towards achieving the optimized output is of absolute viscosity (Z) which is 85.57%.The contribution of speed (N) and maximum allowable pressure is 5.96 percent and 7.91 percent respectively. The application of Taguchi L9 array provides the optimized result with 95 percent confidence level and by using only 9 input values rather than conducting 27 experiments. Hence this technique of optimizing is accurate, fast and reliable and can be carried out conveniently with less effort and resources.
8. FUTURE SCOPE
The study presented in the paper is limited to hydrodynamic journal bearing of compressor with absolute viscosity, speed of journal and allowable pressure as design inputs. It can be extended to include radial clearance as design variable. Further Taguchi technique can be used to optimize heat generation and dissipation in bearing, temperature rise in bearing, manufacturing cost , oil leakage flow rate, whirl onset velocity of shaft and shaft twist as design input variables which are to be optimized. The present study can be extended to improve the characteristics of elliptical journal bearings, roller bearings and thrust bearings. The bearings for pumps, turbines, generators, motors, railway, cars, gyroscope, gas and oil engines, machine tools, rolling mills etc can also be optimized.
REFERENCES
[1] Genetic Algorithm in search and optimization by D.E Goldberg
[2] Machine design by PC Sharma and DK Aggarwal [3] Machine design by Sadhu Singh
[4 ]Optimum design of hydrodynamic journal bearing by A Seireg and H Ezzat
[5]Improvement of operating characteristics of high speed journal bearings by optimum design, H. Hashimoto and K.Matsumoto
[6] A comparative analysis of selection scheme used in genetic algorithm by K.Deb
[7].Taguchi’s quality engineering handbook by Dr. Genichi Taguchi, Dr. Subir Chowdhury, Yuin Wu [8. Taguchi, G. 1976, 1977. Experimental Designs. Test.”Saishain-igaku 29: 806–813.
1319 [10].Evaluation of Mechanical behavior of Al-alloy/