5 3 9 9 5 ISBN: 978-1-59327-192-3
Python Programming for hackers and
reverse engineers
Python is fast becoming the programming
language of choice for hackers, reverse
engineers, and software testers because
it’s easy to write quickly, and it has the
low-level support and libraries that make
hackers happy. But until now, there has
been no real manual on how to use Python
for a variety of hacking tasks. You had to
dig through forum posts and man pages,
endlessly tweaking your own code to get
everything working. Not anymore.
Gray Hat Python
explains the concepts
behind hacking tools and techniques like
debuggers, trojans, fuzzers, and emulators.
But author Justin Seitz goes beyond theory,
showing you how to harness existing
Python-based security tools — and how to
build your own when the pre-built ones
won’t cut it.
You’ll learn how to:
> Automate tedious reversing and
security tasks
> Design and program your own debugger
> Learn how to fuzz Windows drivers and
create powerful fuzzers from scratch
> Have fun with code and library injection,
soft and hard hooking techniques, and
other software trickery
> Sniff secure traffic out of an encrypted
web browser session
> Use PyDBG, Immunity Debugger,
Sulley, IDAPython, PyEMU, and more
The world’s best hackers are using Python
to do their handiwork. Shouldn’t you?
Justin seitz is a senior security researcher for immunity, inc., where he spends his time bug hunting, reverse engineering, writing exploits, and coding Python.
TH E FI N EST I N G E E K E NTE RTAI N M E NT™
w w w.nostarch.com
“I LAY FLAT.”
This book uses RepKover — a durable binding that won’t snap shut.
g
r
a
y
h
a
t
P
y
t
h
o
n
master the Professional
hacker’s Python toolkit
$39.95($49.95 CDN) shelve in: COMPUTERS/SECURiTy
GR AY HAT PY THON
P y t h o n P r o g r a m m i n g f o r
H a c k e r s a n d R e v e r s e
E n g i n e e r s
by Justin Seitz
GRAY HAT PYTHON. Copyright © 2009 by Justin Seitz.
All rights reserved. No part of this work may be reproduced or transmitted in any form or by any means, electronic or mechanical, including photocopying, recording, or by any information storage or retrieval system, without the prior written permission of the copyright owner and the publisher.
13 12 11 10 09 1 2 3 4 5 6 7 8 9
ISBN-10: 1-59327-192-1 ISBN-13: 978-1-59327-192-3
Publisher: William Pollock Production Editor: Megan Dunchak Cover Design: Octopod Studios Developmental Editor: Tyler Ortman Technical Reviewer: Dave Aitel Copyeditor: Linda Recktenwald
Compositors: Riley Hoffman and Kathleen Mish Proofreader: Rachel Kai
Indexer: Fred Brown, Allegro Technical Indexing
For information on book distributors or translations, please contact No Starch Press, Inc. directly:
No Starch Press, Inc.
555 De Haro Street, Suite 250, San Francisco, CA 94107
phone: 415.863.9900; fax: 415.863.9950; [email protected]; www.nostarch.com
Librar y of Congress Cataloging-in-Publication Data:
Seitz, Justin.
Gray hat Python : Python programming for hackers and reverse engineers / Justin Seitz. p. cm.
ISBN-13: 978-1-59327-192-3 ISBN-10: 1-59327-192-1
1. Computer security. 2. Python (Computer program language) I. Title. QA76.9.A25S457 2009
005.8--dc22
2009009107
No Starch Press and the No Starch Press logo are registered trademarks of No Starch Press, Inc. Other product and company names mentioned herein may be the trademarks of their respective owners. Rather than use a trademark symbol with every occurrence of a trademarked name, we are using the names only in an editorial fashion and to the benefit of the trademark owner, with no intention of infringement of the trademark.
Mom,
If there’s one thing I wish for you to remember, it’s that I love you very much.
B R I E F C O N T E N T S
Foreword by Dave Aitel ... xiii
Acknowledgments ... xvii
Introduction ...xix
Chapter 1: Setting Up Your Development Environment ...1
Chapter 2: Debuggers and Debugger Design ...13
Chapter 3: Building a Windows Debugger ...25
Chapter 4: PyDbg—A Pure Python Windows Debugger...57
Chapter 5: Immunity Debugger—The Best of Both Worlds ...69
Chapter 6: Hooking ...85
Chapter 7: DLL and Code Injection...97
Chapter 8: Fuzzing ...111
Chapter 9: Sulley ...123
Chapter 10: Fuzzing Windows Drivers ...137
Chapter 11: IDAPython—Scripting IDA Pro ...153
Chapter 12: PyEmu—The Scriptable Emulator...163
C O N T E N T S I N D E T A I L
F O REW O R D b y Da v e A i tel xiii
A CK N O W LED G M EN T S xvii
I NT RO D UC TI O N xix
1
S ETTI N G UP Y O U R DEV EL O P M EN T EN V IR O N M EN T 1
1.1 Operating System Requirements ... 2
1.2 Obtaining and Installing Python 2.5 ... 2
1.2.1 Installing Python on Windows ... 2
1.2.2 Installing Python for Linux ... 3
1.3 Setting Up Eclipse and PyDev ... 4
1.3.1 The Hacker’s Best Friend: ctypes ... 5
1.3.2 Using Dynamic Libraries ... 6
1.3.3 Constructing C Datatypes ... 8
1.3.4 Passing Parameters by Reference ... 9
1.3.5 Defining Structures and Unions ... 9
2 DEB UG G ERS AN D D EBU GGER D ESI G N 13 2.1 General-Purpose CPU Registers... 14
2.2 The Stack ... 16
2.3 Debug Events ... 18
2.4 Breakpoints ... 18
2.4.1 Soft Breakpoints... 19
2.4.2 Hardware Breakpoints... 21
2.4.3 Memory Breakpoints ... 23
3 BU IL D IN G A W IN D O W S DEB UG G ER 25 3.1 Debuggee, Where Art Thou?... 25
3.2 Obtaining CPU Register State ... 33
3.2.1 Thread Enumeration ... 33
3.2.2 Putting It All Together... 35
3.3 Implementing Debug Event Handlers ... 39
3.4 The Almighty Breakpoint ... 43
3.4.1 Soft Breakpoints... 43
3.4.2 Hardware Breakpoints... 47
3.4.3 Memory Breakpoints ... 52
4
P YD BG —A P U RE PY T HO N WI N DO WS D EBU G G ER 57
4.1 Extending Breakpoint Handlers ... 58
4.2 Access Violation Handlers... 60
4.3 Process Snapshots ... 63
4.3.1 Obtaining Process Snapshots ... 63
4.3.2 Putting It All Together... 65
5 I M M UN I TY DEBU G G E R— TH E B ES T O F BO T H WO R L DS 69 5.1 Installing Immunity Debugger... 70
5.2 Immunity Debugger 101 ... 70
5.2.1 PyCommands ... 71
5.2.2 PyHooks ... 71
5.3 Exploit Development... 73
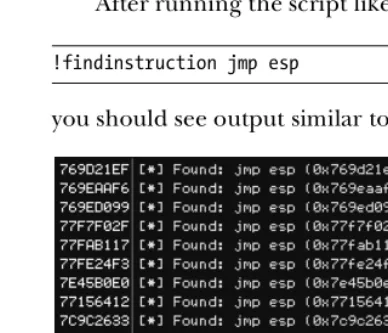
5.3.1 Finding Exploit-Friendly Instructions ... 73
5.3.2 Bad-Character Filtering ... 75
5.3.3 Bypassing DEP on Windows ... 77
5.4 Defeating Anti-Debugging Routines in Malware ... 81
5.4.1 IsDebuggerPresent ... 81
5.4.2 Defeating Process Iteration ... 82
6 HO O KI N G 85 6.1 Soft Hooking with PyDbg ... 86
6.2 Hard Hooking with Immunity Debugger ... 90
7 DL L A N D CO DE IN J ECT IO N 97 7.1 Remote Thread Creation ... 98
7.1.1 DLL Injection ... 99
7.1.2 Code Injection ... 101
7.2 Getting Evil ... 104
7.2.1 File Hiding ... 104
7.2.2 Coding the Backdoor ... 105
7.2.3 Compiling with py2exe... 108
8 F UZ ZI N G 111 8.1 Bug Classes ... 112
8.1.1 Buffer Overflows ... 112
8.1.2 Integer Overflows ... 113
8.1.3 Format String Attacks... 114
8.2 File Fuzzer ... 115
8.3 Future Considerations ... 122
8.3.1 Code Coverage... 122
9
S UL L EY 123
9.1 Sulley Installation ... 124
9.2 Sulley Primitives ... 125
9.2.1 Strings ... 125
9.2.2 Delimiters... 125
9.2.3 Static and Random Primitives... 126
9.2.4 Binary Data... 126
9.2.5 Integers ... 126
9.2.6 Blocks and Groups... 127
9.3 Slaying WarFTPD with Sulley ... 129
9.3.1 FTP 101... 129
9.3.2 Creating the FTP Protocol Skeleton ... 130
9.3.3 Sulley Sessions ... 131
9.3.4 Network and Process Monitoring ... 132
9.3.5 Fuzzing and the Sulley Web Interface ... 133
1 0 F UZ ZI N G WI N DO W S D RI V ERS 137 10.1 Driver Communication ... 138
10.2 Driver Fuzzing with Immunity Debugger... 139
10.3 Driverlib—The Static Analysis Tool for Drivers... 142
10.3.1 Discovering Device Names ... 143
10.3.2 Finding the IOCTL Dispatch Routine... 144
10.3.3 Determining Supported IOCTL Codes ... 145
10.4 Building a Driver Fuzzer ... 147
1 1 I DA PY T HO N — S C RI PT IN G I DA P RO 153 11.1 IDAPython Installation ... 154
11.2 IDAPython Functions ... 155
11.2.1 Utility Functions... 155
11.2.2 Segments ... 155
11.2.3 Functions ... 156
11.2.4 Cross-References ... 156
11.2.5 Debugger Hooks... 157
11.3 Example Scripts ... 158
11.3.1 Finding Dangerous Function Cross-References... 158
11.3.2 Function Code Coverage ... 160
11.3.3 Calculating Stack Size ... 161
1 2 P YE M U— TH E SC RI P TA BL E EM UL A TO R 163 12.1 Installing PyEmu ... 164
12.2 PyEmu Overview... 164
12.2.1 PyCPU ... 164
12.2.2 PyMemory... 165
12.2.4 Execution ... 165
12.2.5 Memory and Register Modifiers ... 165
12.2.6 Handlers... 166
12.3 IDAPyEmu ... 171
12.3.1 Function Emulation ... 172
12.3.2 PEPyEmu ... 175
12.3.3 Executable Packers... 176
12.3.4 UPX Packer ... 176
12.3.5 Unpacking UPX with PEPyEmu ... 177
F O R E W O R D
The phrase most often heard at Immunity is probably,
“Is it done yet?” Common parlance usually goes
some-thing like this: “I’m starting work on the new ELF
importer for Immunity Debugger.” Slight pause. “Is it
done yet?” or “I just found a bug in Internet Explorer!”
And then, “Is the exploit done yet?” It’s this rapid pace of development, modi-fication, and creation that makes Python the perfect choice for your next security project, be it building a special decompiler or an entire debugger.
apply to assessments. Once you can hook the SQL API, you can easily write a tool to do anomaly detection against SQL queries, providing your organiza-tion with a quick fix against a persistent attacker.
Everyone knows that it’s pretty hard to get your security researchers to work as part of a team. Most security researchers, when faced with any sort of problem, would like to first rebuild the library they are going to use to attack the problem. Let’s say it’s a vulnerability in an SSL daemon of some kind. It’s very likely that your researcher is going to want to start by building an SSL client, from scratch, because “the SSL library I found was ugly.”
You need to avoid this at all costs. The reality is that the SSL library is not ugly—it just wasn’t written in that particular researcher’s particular style. Being able to dive into a big block of code, find a problem, and fix it is the key to having a working SSL library in time for you to write an exploit while it still has some meaning. And being able to have your security researchers work as a team is the key to making the kinds of progress you require. One Python-enabled security researcher is a powerful thing, much as one Ruby-enabled one is. The difference is the ability of the Pythonistas to work together, use old source code without rewriting it, and otherwise operate as a functioning superorganism. That ant colony in your kitchen has about the same mass as an octopus, but it’s much more annoying to try to kill!
And here, of course, is where this book helps you. You probably already have tools to do some of what you want to do. You say, “I’ve got Visual Studio. It has a debugger. I don’t need to write my own specialized debugger.” Or, “Doesn’t WinDbg have a plug-in interface?” And the answer is yes, of course WinDbg has a plug-in interface, and you can use that API to slowly put together something useful. But then one day you’ll say, “Heck, this would be a lot better if I could connect it to 5,000 other people using WinDbg and we could correlate our results.” And if you’re using Python, it takes about 100 lines of code for both an XML-RPC client and a server, and now everyone is synchronized and working off the same page.
Because hacking is not reverse engineering—your goal is not to come up with the original source code for the application. Your goal is to have a greater understanding of the program or system than the people who built it. Once you have that understanding, no matter what the form, you will be able to penetrate the program and get to the juicy exploits inside. This means that you’re going to become an expert at visualization, remote synchroni-zation, graph theory, linear equation solving, statistical analysis techniques, and a whole host of other things. Immunity’s decision regarding this has been to standardize entirely on Python, so every time we write a graph algorithm, it can be used across all of our tools.
to developers exactly which of the assumptions they are making about their software are clearly untrue. Software companies invest a lot in protecting their internal memory for what they claim are security reasons but are really copy protection and digital rights management (DRM) related.
So here’s what you get with this book: the ability to rapidly create software tools that manipulate other applications. And you get to do this in a way that allows you to build on your success either by yourself or with a team. This is the future of security tools: quickly implemented, quickly modified, quickly connected. I guess the only question left is, “Is it done yet?”
Dave Aitel
A C K N O W L E D G M E N T S
I would like to thank my family for tolerating me throughout the whole process of writing this book. My four beautiful children, Emily, Carter, Cohen, and Brady, you helped give Dad a reason to keep writing this book, and I love you very much for being the great kids you are. My brothers and sister, thanks for encouraging me through the process. You guys have written some tomes yourselves, and it was always helpful to have someone who understands the rigor needed to put out any kind of technical work—I love you guys. To my Dad, your sense of humor helped me through a lot of the days when I didn’t feel like writing—I love ya Harold; don’t stop making everyone around you laugh.
I N T R O D U C T I O N
I learned Python specifically for hacking—and I’d
venture to say that’s a true statement for a lot of other
folks, too. I spent a great deal of time hunting around
for a language that was well suited for hacking and
reverse engineering, and a few years ago it became very apparent that Python was becoming the natural leader in the hacking-programming-language department. The tricky part was the fact that there was no real manual on how to use Python for a variety of hacking tasks. You had to dig through forum posts and man pages and typically spend quite a bit of time stepping through code to get it to work right. This book aims to fill that gap by giving you a whirlwind tour of how to use Python for hacking and reverse engineering in a variety of ways.
many, many infosec (information security) tools written in Python that I did not cover. However, this book will allow you to translate a lot of the same skills across applications so that you can use, debug, extend, and customize any Python tool of your choice.
There are a couple of ways you can progress through this book. If you are new to Python or to building hacking tools, then you should read the book front to back, in order. You’ll learn some necessary theory, program oodles of Python code, and have a solid grasp of how to tackle a myriad of hacking and reversing tasks by the time you get to the end. If you are familiar with Python already and have a good grasp on the Python library ctypes, then jump straight to Chapter 2. For those of you who have been around the block, it’s easy enough to jump around in the book and use code snippets or certain sections as you need them in your day-to-day tasks.
I spend a great deal of time on debuggers, beginning with debugger theory in Chapter 2, and progressing straight through to Immunity Debugger in Chapter 5. Debuggers are a crucial tool for any hacker, and I make no bones about covering them extensively. Moving forward, you’ll learn some hooking and injection techniques in Chapters 6 and 7, which you can add to some of the debugging concepts of program control and memory manipulation.
The next section of the book is aimed at breaking applications using fuzzers. In Chapter 8, you’ll begin learning about fuzzing, and we’ll construct our own basic file fuzzer. In Chapter 9, we’ll harness the powerful Sulley fuzzing framework to break a real-world FTP daemon, and in Chapter 10 you’ll learn how to build a fuzzer to destroy Windows drivers.
In Chapter 11, you’ll see how to automate static analysis tasks in IDA Pro, the popular binary static analysis tool. We’ll wrap up the book by covering PyEmu, the Python-based emulator, in Chapter 12.
I have tried to keep the code listings somewhat short, with detailed explanations of how the code works inserted at specific points. Part of learn-ing a new language or masterlearn-ing new libraries is spendlearn-ing the necessary sweat time to actually write out the code and debug your mistakes. I encourage you to type in the code! All source will be posted to http://www.nostarch.com/ ghpython.htm for your downloading pleasure.
1
S E T T I N G U P Y O U R
D E V E L O P M E N T E N V I R O N M E N T
Before you can experience the art of gray hat Python
programming, you must work through the least
excit-ing portion of this book, settexcit-ing up your development
environment. It is essential that you have a solid
devel-opment environment, which allows you to spend time
absorbing the interesting information in this book
rather than stumbling around trying to get your code
to execute.
1.1 Operating System Requirements
I assume that you are using a 32-bit Windows-based platform to do most of your coding. Windows has the widest array of tools and lends itself well to Python development. All of the chapters in this book are Windows-specific, and most examples will work only with a Windows operating system.
However, there are some examples that you can run from a Linux distribution. For Linux development, I recommend you download a 32-bit Linux distro as a VMware appliance. VMware’s appliance player is free, and it enables you to quickly move files from your development machine to your virtualized Linux machine. If you have an extra machine lying around, feel free to install a complete distribution on it. For the purpose of this book, use a Red Hat–based distribution like Fedora Core 7 or Centos 5. Of course, alternatively, you can run Linux and emulate Windows. It’s really up to you.
1.2 Obtaining and Installing Python 2.5
The Python installation is quick and painless on both Linux and Windows. Windows users are blessed with an installer that takes care of all of the setup for you; however, on Linux you will be building the installation from source code.
1.2.1 Installing Python on Windows
Windows users can obtain the installer from the main Python site: http:// python.org/ftp/python/2.5.1/python-2.5.1.msi. Just double-click the installer, and follow the steps to install it. It should create a directory at C:/Python25/; this directory will have the python.exe interpreter as well as all of the default libraries installed.
NOTE You can optionally install Immunity Debugger, which contains not only the debugger itself but also an installer for Python 2.5. In later chapters you will be using Immu-nity Debugger for many tasks, so you are welcome to kill two birds with one installer here. To download and install Immunity Debugger, visit http://debugger .immunityinc.com/.
F R E E V M W A R E I M A G E S
1.2.2 Installing Python for Linux
To install Python 2.5 for Linux, you will be downloading and compiling from source. This gives you full control over the installation while preserving the existing Python installation that is present on a Red Hat–based system. The installation assumes that you will be executing all of the following commands as the root user.
The first step is to download and unzip the Python 2.5 source code. In a command-line terminal session, enter the following:
# cd /usr/local/
# wget http://python.org/ftp/python/2.5.1/Python-2.5.1.tgz
# tar –zxvf Python-2.5.1.tgz
# mv Python-2.5.1 Python25
# cd Python25
You have now downloaded and unzipped the source code into /usr/local/ Python25. The next step is to compile the source code and make sure the Python interpreter works:
# ./configure –-prefix=/usr/local/Python25
# make && make install
# pwd
/usr/local/Python25
# python
Python 2.5.1 (r251:54863, Mar 14 2012, 07:39:18) [GCC 3.4.6 20060404 (Red Hat 3.4.6-8)] on Linux2
Type "help", "copyright", "credits" or "license" for more information. >>>
You are now inside the Python interactive shell, which provides full access to the Python interpreter and any included libraries. A quick test will show that it’s correctly interpreting commands:
>>> print "Hello World!"
Hello World!
>>> exit()
#
Excellent! Everything is working the way you need it to. To ensure that your user environment knows where to find the Python interpreter auto-matically, you must edit the /root/.bashrc file. I personally use nano to do all of my text editing, but feel free to use whatever editor you are comfortable with. Open the /root/.bashrc file, and at the bottom of the file add the following line:
export PATH=/usr/local/Python25/:$PATH
back in as root, when you type python at any point in your command shell you will be prompted by the Python interpreter.
Now that you have a fully operational Python interpreter on both Windows and Linux, it’s time to set up your integrated development environment (IDE). If you have an IDE that you are already comfortable with, you can skip the next section.
1.3 Setting Up Eclipse and PyDev
In order to rapidly develop and debug Python applications, it is absolutely necessary to utilize a solid IDE. The coupling of the popular Eclipse develop-ment environdevelop-ment and a module called PyDev gives you a tremendous number of powerful features at your fingertips that most other IDEs don’t offer. In addition, Eclipse runs on Windows, Linux, and Mac and has excellent community support. Let’s quickly run through how to set up and configure Eclipse and PyDev:
1. Download the Eclipse Classic package from http://www.eclipse.org/ downloads/.
2. Unzip it to C:\ Eclipse.
3. Run C:\Eclipse\eclipse.exe.
4. The first time it starts, it will ask where to store your workspace; you can accept the default and check the box Use this as default and do not ask
again. Click OK.
5. Once Eclipse has fired up, choose Help Software Updates Find and
Install.
6. Select the radio button labeled Search for new features to install and click Next.
7. On the next screen click New Remote Site.
8. In the Name field enter a descriptive string like PyDev Update. Make sure the URL field contains http://pydev.sourceforge.net/updates/ and click
OK. Then click Finish, which will kick in the Eclipse updater. 9. The updates dialog will appear after a few moments. When it does,
expand the top item, PyDev Update, and check the PyDev item. Click
Next to continue.
10. Then read and accept the license agreement for PyDev. If you agree to its terms, then select the radio button I accept the terms in the license
agreement.
11. Click Next and then Finish. You will see Eclipse begin pulling down the PyDev extension. When it’s finished, click Install All.
The next stage of the Eclipse configuration just involves you making sure that PyDev can find the proper Python interpreter to use when you run scripts inside PyDev:
1. With Eclipse started, select Window Preferences.
2. Expand the PyDev tree item, and select Interpreter – Python.
3. In the Python Interpreters section at the top of the dialog, click New. 4. Browse to C:\Python25\python.exe, and click Open.
5. The next dialog will show a list of included libraries for the interpreter; leave the selections alone and just click OK.
6. Then click OK again to finish the interpreter setup.
Now you have a working PyDev install, and it is configured to use your freshly installed Python 2.5 interpreter. Before you start coding, you must create a new PyDev project; this project will hold all of the source files given throughout this book. To set up a new project, follow these steps:
1. Select File New Project.
2. Expand the PyDev tree item, and select PyDev Project. Click Next to continue.
3. Name the project Gray Hat Python. Click Finish.
You will notice that your Eclipse screen will rearrange itself, and you should see your Gray Hat Python project in the upper left of the screen. Now right-click the src folder, and select New PyDev Module. In the Name
field, enter chapter1-test, and click Finish. You will notice that your project pane has been updated, and the chapter1-test.py file has been added to the list.
To run Python scripts from Eclipse, just click the Run As button (the green circle with a white arrow in it) on the toolbar. To run the last script you previously ran, hit CTRL-F11. When you run a script inside Eclipse, instead of seeing the output in a command-prompt window, you will see a window pane at the bottom of your Eclipse screen labeled Console. All of the output from your scripts will be displayed in the Console pane. You will notice the editor has opened the chapter1-test.py file and is awaiting some sweet Python nectar.
1.3.1 The Hacker’s Best Friend: ctypes
1.3.2 Using Dynamic Libraries
The first step in utilizing ctypes is to understand how to resolve and access functions in a dynamically linked library. A dynamically linked library is a compiled binary that is linked at runtime to the main process executable. On Windows platforms these binaries are called dynamic link libraries (DLL), and on Linux they are called shared objects (SO). In both cases, these binaries expose functions through exported names, which get resolved to actual addresses in memory. Normally at runtime you have to resolve the function addresses in order to call the functions; however, with ctypes all of the dirty work is already done.
There are three different ways to load dynamic libraries in ctypes: cdll(),
windll(), and oledll(). The difference among all three is in the way the functions inside those libraries are called and their resulting return values. The cdll() method is used for loading libraries that export functions using the standard cdecl calling convention. The windll() method loads libraries that export functions using the stdcall calling convention, which is the native convention of the Microsoft Win32 API. The oledll() method operates exactly like the windll() method; however, it assumes that the exported functions return a Windows HRESULT error code, which is used specifically for error messages returned from Microsoft Component Object Model(COM)
functions.
For a quick example you will resolve the printf() function from the C runtime on both Windows and Linux and use it to output a test message. On Windows the C runtime is msvcrt.dll, located in C:\WINDOWS\system32\, and on Linux it is libc.so.6, which is located in /lib/ by default. Create a
chapter1-printf.py script, either in Eclipse or in your normal Python working directory, and enter the following code.
chapter1-printf.py Code on Windows
from ctypes import *
msvcrt = cdll.msvcrt
message_string = "Hello world!\n"
msvcrt.printf("Testing: %s", message_string)
The following is the output of this script:
C:\Python25> python chapter1-printf.py
Testing: Hello world! C:\Python25>
On Linux, this example will be slightly different but will net the same results. Switch to your Linux install, and create chapter1-printf.py inside your
U N D E R S T A N D I N G C A L L I N G C O N V E N T I O N S
A calling convention describes how to properly call a particular function. This includes the order of how function parameters are allocated, which parameters are pushed onto the stack or passed in registers, and how the stack is unwound when a function returns. You need to understand two calling conventions: cdecl and stdcall. In the cdecl convention, parameters are pushed from right to left, and the caller of the func-tion is responsible for clearing the arguments from the stack. It’s used by most C systems on the x86 architecture.
Following is an example of a cdecl function call:
In C
int python_rocks(reason_one, reason_two, reason_three);
In x86 Assembly
push reason_three push reason_two push reason_one call python_rocks add esp, 12
You can clearly see how the arguments are passed, and the last line increments the stack pointer 12 bytes (there are three parameters to the function, and each stack parameter is 4 bytes, and thus 12 bytes), which essentially clears those parameters. An example of the stdcall convention, which is used by the Win32 API, is shown here:
In C
int my_socks(color_one color_two, color_three);
In x86 Assembly
push color_three push color_two push color_one call my_socks
In this case you can see that the order of the parameters is the same, but the stack clearing is not done by the caller; rather the my_socks function is responsible for cleaning up before it returns.
chapter1-printf.py Code on Linux
from ctypes import *
libc = CDLL("libc.so.6")
message_string = "Hello world!\n"
libc.printf("Testing: %s", message_string)
The following is the output from the Linux version of your script:
# python /root/chapter1-printf.py
Testing: Hello world! #
It is that easy to be able to call into a dynamic library and use a function that is exported. You will be using this technique many times throughout the book, so it is important that you understand how it works.
1.3.3 Constructing C Datatypes
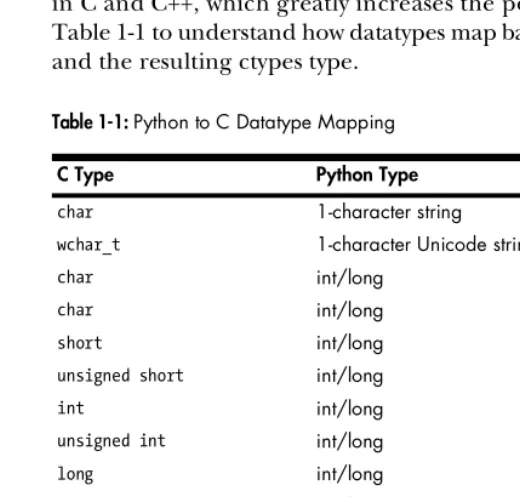
Creating a C datatype in Python is just downright sexy, in that nerdy, weird way. Having this feature allows you to fully integrate with components written in C and C++, which greatly increases the power of Python. Briefly review Table 1-1 to understand how datatypes map back and forth between C, Python, and the resulting ctypes type.
Table 1-1: Python to C Datatype Mapping
C Type Python Type ctypes Type
char 1-character string c_char
wchar_t 1-character Unicode string c_wchar
char int/long c_byte
char int/long c_ubyte
short int/long c_short
unsigned short int/long c_ushort
int int/long C_int
unsigned int int/long c_uint
long int/long c_long
unsigned long int/long c_ulong
long long int/long c_longlong
unsigned long long int/long c_ulonglong
float float c_float
double float c_double
char * (NULL terminated) string or none c_char_p
wchar_t * (NULL terminated) unicode or none c_wchar_p
See how nicely the datatypes are converted back and forth? Keep this table handy in case you forget the mappings. The ctypes types can be initialized with a value, but it has to be of the proper type and size. For a demonstration, open your Python shell and enter some of the following examples:
C:\Python25> python.exe
Python 2.5 (r25:51908, Sep 19 2006, 09:52:17) [MSC v.1310 32 bit (Intel)] on win32 Type "help", "copyright", "credits" or "license" for more information.
>>> from ctypes import * >>> c_int()
c_long(0)
>>> c_char_p("Hello world!")
c_char_p('Hello world!')
>>> c_ushort(-5)
c_ushort(65531) >>>
>>> seitz = c_char_p("loves the python") >>> print seitz
c_char_p('loves the python')
>>> print seitz.value
loves the python
>>> exit()
The last example describes how to assign the variable seitz a character pointer to the string "loves the python". To access the contents of that pointer use the seitz.value method, which is called dereferencing a pointer.
1.3.4 Passing Parameters by Reference
It is common in C and C++ to have a function that expects a pointer as one of its parameters. The reason is so the function can either write to that location in memory or, if the parameter is too large, pass by value. Whatever the case may be, ctypes comes fully equipped to do just that, by using the byref()
function. When a function expects a pointer as a parameter, you call it like this: function_main( byref(parameter) ).
1.3.5 Defining Structures and Unions
Structures and unions are important datatypes, as they are frequently used throughout the Microsoft Win32 API as well as with libc on Linux. A structure
is simply a group of variables, which can be of the same or different datatypes. You can access any of the member variables in the structure by using dot notation, like this: beer_recipe.amt_barley. This would access the amt_barley
In C
struct beer_recipe {
int amt_barley; int amt_water; };
In Python
class beer_recipe(Structure): _fields_ = [
("amt_barley", c_int), ("amt_water", c_int), ]
As you can see, ctypes has made it very easy to create C-compatible structures. Note that this is not in fact a complete recipe for beer, nor do I encourage you to drink barley and water.
Unions are much the same as structures. However, in a union all of the member variables share the same memory location. By storing variables in this way, unions allow you to specify the same value in different types. The next example shows a union that allows you to display a number in three different ways.
In C
union {
long barley_long; int barley_int; char barley_char[8]; }barley_amount;
In Python
class barley_amount(Union): _fields_ = [
("barley_long", c_long), ("barley_int", c_int), ("barley_char", c_char * 8), ]
If you assigned the barley_amount union’s member variable barley_int
chapter1-unions.py
from ctypes import *
class barley_amount(Union): _fields_ = [
("barley_long", c_long), ("barley_int", c_int), ("barley_char", c_char * 8), ]
value = raw_input("Enter the amount of barley to put into the beer vat:") my_barley = barley_amount(int(value))
print "Barley amount as a long: %ld" % my_barley.barley_long print "Barley amount as an int: %d" % my_barley.barley_long print "Barley amount as a char: %s" % my_barley.barley_char
The output from this script would look like this:
C:\Python25> python chapter1-unions.py
Enter the amount of barley to put into the beer vat: 66
Barley amount as a long: 66 Barley amount as an int: 66 Barley amount as a char: B C:\Python25>
As you can see, by assigning the union a single value, you get three different representations of that value. If you are confused by the output of the barley_char variable, B is the ASCII equivalent of decimal 66.
The barley_char member variable is an excellent example of how to define an array in ctypes. In ctypes an array is defined by multiplying a type by the number of elements you want allocated in the array. In the previous example, an eight-element character array was defined for the member variable barley_char.
2
D E B U G G E R S A N D
D E B U G G E R D E S I G N
Debuggers are the apple of the hacker’s eye. Debuggers
enable you to perform runtime tracing of a process,
or
dynamic analysis
. The ability to perform dynamic
analysis is absolutely essential when it comes to exploit
development, fuzzer assistance, and malware inspection. It is crucial that you understand what debuggers are and what makes them tick. Debuggers provide a whole host of features and functionality that are useful when assessing soft-ware for defects. Most come with the ability to run, pause, or step a process; set breakpoints; manipulate registers and memory; and catch exceptions that occur inside the target process.
assumes that the software under inspection is completely opaque to the hacker, and the only information available is in a disassembled format. While this method of finding errors is more challenging and time consuming, a well-trained reverse engineer is able to understand the software system at a very high level. Sometimes the folks breaking the software can gain a deeper understanding than the developers who built it!
It is important to differentiate two subclasses of black-box debuggers: user mode and kernel mode. User mode (commonly referred to as ring 3) is a pro-cessor mode under which your user applications run. User-mode applications run with the least amount of privilege. When you launch calc.exe to do some math, you are spawning a user-mode process; if you were to trace this applica-tion, you would be doing user-mode debugging. Kernel mode (ring 0) is the highest level of privilege. This is where the core of the operating system runs, along with drivers and other low-level components. When you sniff packets with Wireshark, you are interacting with a driver that works in kernel mode. If you wanted to halt the driver and examine its state at any point, you would use a kernel-mode debugger.
There is a short list of user-mode debuggers commonly used by reverse engineers and hackers: WinDbg, from Microsoft, and OllyDbg, a free debugger from Oleh Yuschuk. When debugging on Linux, you’d use the standard GNU Debugger (gdb). All three of these debuggers are quite powerful, and each offers a strength that others don’t provide.
In recent years, however, there have been substantial advances in intelligent debugging, especially for the Windows platform. An intelligent debugger is scriptable, supports extended features such as call hooking, and generally has more advanced features specifically for bug hunting and reverse engineer-ing. The two emerging leaders in this field are PyDbg by Pedram Amini and Immunity Debugger from Immunity, Inc.
PyDbg is a pure Python debugging implementation that allows the hacker full and automated control over a process, entirely in Python.
Immunity Debugger is an amazing graphical debugger that looks and feels like OllyDbg but has numerous enhancements as well as the most powerful Python debugging library available today. Both of these debuggers get a thorough treatment in later chapters of this book. But for now, let’s dive into some general debugging theory.
In this chapter, we will focus on user-mode applications on the x86 plat-form. We will begin by examining some very basic CPU architecture, coverage of the stack, and the anatomy of a user-mode debugger. The goal is for you to be able create your own debugger for any operating system, so it is critical that you understand the low-level theory first.
2.1 General-Purpose CPU Registers
circumstances where they are required. Each of the eight general-purpose registers is designed for a specific use, and each performs a function that enables the CPU to efficiently process instructions. It is important to under-stand what these registers are used for, as this knowledge will help to lay the groundwork for understanding how to design a debugger. Let’s walk through each of the registers and its function. We will finish up by using a simple reverse engineering exercise to illustrate their uses.
The EAX register, also called the accumulator register, is used for perform-ing calculations as well as storperform-ing return values from function calls. Many optimized instructions in the x86 instruction set are designed to move data into and out of the EAX register and perform calculations on that data. Most basic operations like add, subtract, and compare are optimized to use the EAX register. As well, more specialized operations like multiplication or division can occur only within the EAX register.
As previously noted, return values from function calls are stored in EAX. This is important to remember, so that you can easily determine if a function call has failed or succeeded based on the value stored in EAX. In addition, you can determine the actual value of what the function is returning.
The EDX register is the data register. This register is basically an extension of the EAX register, and it assists in storing extra data for more complex calculations like multiplication and division. It can also be used for general-purpose storage, but it is most commonly used in conjunction with calcula-tions performed with the EAX register.
The ECX register, also called the count register, is used for looping operations. The repeated operations could be storing a string or counting numbers. An important point to understand is that ECX counts downward, not upward. Take the following snippet in Python, for example:
counter = 0
while counter < 10:
print "Loop number: %d" % counter counter += 1
If you were to translate this code to assembly, ECX would equal 10 on the first loop, 9 on the second loop, and so on. This is a bit confusing, as it is the reverse of what is shown in Python, but just remember that it’s always a down-ward count, and you’ll be fine.
In x86 assembly, loops that process data rely on the ESI and EDI registers for efficient data manipulation. The ESI register is the source index for the data operation and holds the location of the input data stream. The EDI register points to the location where the result of a data operation is stored, or the
destination index. An easy way to remember this is that ESI is used for reading and EDI is used for writing. Using the source and destination index registers for data operation greatly improves the performance of the running program.
pushed onto the stack and are followed by the return address. The ESP register points to the very top of the stack, and so it will point to the return address. The EBP register is used to point to the bottom of the call stack. In some circumstances a compiler may use optimizations to remove the EBP register as a stack frame pointer; in these cases the EBP register is freed up to be used like any other general-purpose register.
The EBX register is the only register that was not designed for anything specific. It can be used for extra storage.
One extra register that should be mentioned is the EIP register. This register points to the current instruction that is being executed. As the CPU moves through the binary executing code, EIP is updated to reflect the location where the execution is occurring.
A debugger must be able to easily read and modify the contents of these registers. Each operating system provides an interface for the debugger to interact with the CPU and retrieve or modify these values. We’ll cover the individual interfaces in the operating system–specific chapters.
2.2 The Stack
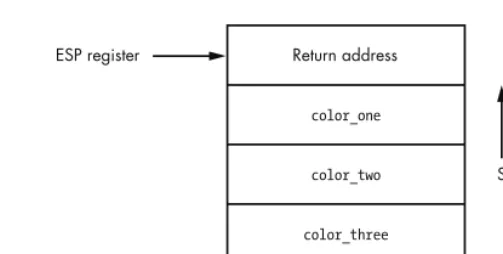
The stack is a very important structure to understand when developing a debugger. The stack stores information about how a function is called, the parameters it takes, and how it should return after it is finished executing. The stack is a First In, Last Out (FILO) structure, where arguments are pushed onto the stack for a function call and popped off the stack when the function is finished. The ESP register is used to track the very top of the stack frame, and the EBP register is used to track the bottom of the stack frame. The stack grows from high memory addresses to low memory addresses. Let’s use our previously covered function my_socks() as a simplified example of how the stack works.
Function Call in C
int my_socks(color_one, color_two, color_three);
Function Call in x86 Assembly
push color_three push color_two push color_one call my_socks
Figure 2-1: Stack frame for the my_socks() function call
As you can see, this is a straightforward data structure and is the basis for all function calls inside a binary. When the my_socks() function returns, it pops off all the values on the stack and jumps to the return address to continue executing in the parent function that called it. The other consideration is the notion of local variables. Local variables are slices of memory that are valid only for the function that is executing. To expand our my_socks() function a bit, let’s assume that the first thing it does is set up a character array into which to copy the parameter color_one. The code would look like this:
int my_socks(color_one, color_two, color_three) {
char stinky_sock_color_one[10]; ...
}
The variable stinky_sock_color_one would be allocated on the stack so that it can be used within the current stack frame. Once this allocation has occurred, the stack frame will look like the image in Figure 2-2.
Figure 2-2: The stack frame after the local variable stinky_sock_color_one
has been allocated
Return address
color_one color_two color_three
Base of stack frame ESP register
EBP register
Stack growth direction
Return address
color_one color_two color_three
Base of stack frame ESP register
EBP register
Stack growth direction
Now you can see how local variables are allocated on the stack and how the stack pointer gets incremented to continue to point to the top of the stack. The ability to capture the stack frame inside a debugger is very useful for tracing functions, capturing the stack state on a crash, and tracking down stack-based overflows.
2.3 Debug Events
Debuggers run as an endless loop that waits for a debugging event to occur. When a debugging event occurs, the loop breaks, and a corresponding event handler is called.
When an event handler is called, the debugger halts and awaits direction on how to continue. Some of the common events that a debugger must trap are these:
Breakpoint hits
Memory violations (also called access violations or segmentation faults) Exceptions generated by the debugged program
Each operating system has a different method for dispatching these events to a debugger, which will be covered in the operating system–specific chapters. In some operating systems, other events can be trapped as well, such as thread and process creation or the loading of a dynamic library at runtime. We will cover these special events where applicable.
An advantage of a scripted debugger is the ability to build custom event handlers to automate certain debugging tasks. For example, a buffer overflow is a common cause for memory violations and is of great interest to a hacker. During a regular debugging session, if there is a buffer overflow and a memory violation occurs, you must interact with the debugger and manually capture the information you are interested in. With a scripted debugger, you are able to build a handler that automatically gathers all of the relevant information without having to interact with it. The ability to create these customized handlers not only saves time, but it also enables a far wider degree of control over the debugged process.
2.4 Breakpoints
The ability to halt a process that is being debugged is achieved by setting
2.4.1 Soft Breakpoints
Soft breakpoints are used specifically to halt the CPU when executing instruct-ions and are by far the most common type of breakpoints that you will use when debugging applications. A soft breakpoint is a single-byte instruction that stops execution of the debugged process and passes control to the debugger’s breakpoint exception handler. In order to understand how this works, you have to know the difference between an instruction and an opcode
in x86 assembly.
An assembly instruction is a high-level representation of a command for the CPU to execute. An example is
MOV EAX, EBX
This instruction tells the CPU to move the value stored in the register EBX into the register EAX. Pretty simple, eh? However, the CPU does not know how to interpret that instruction; it needs it to be converted into some-thing called an opcode. An operation code, or opcode, is a machine language command that the CPU executes. To illustrate, let’s convert the previous instruction into its native opcode:
8BC3
As you can see, this obfuscates what’s really going on behind the scenes, but it’s the language that the CPU speaks. Think of assembly instructions as the DNS of CPUs. Instructions make it really easy to remember commands that are being executed (hostnames) instead of having to memorize all of the individual opcodes (IP addresses). You will rarely need to use opcodes in your day-to-day debugging, but they are important to understand for the purpose of soft breakpoints.
If the instruction we covered previously was at address 0x44332211, a common representation would look like this:
0x44332211: 8BC3 MOV EAX, EBX
This shows the address, the opcode, and the high-level assembly instruc-tion. In order to set a soft breakpoint at this address and halt the CPU, we have to swap out a single byte from the 2-byte 8BC3 opcode. This single byte represents the interrupt 3 (INT 3) instruction, which tells the CPU to halt. The INT 3 instruction is converted into the single-byte opcode 0xCC. Here is our previous example, before and after setting a breakpoint.
Opcode Before Breakpoint Is Set
Modified Opcode After Breakpoint Is Set
0x44332211: CCC3 MOV EAX, EBX
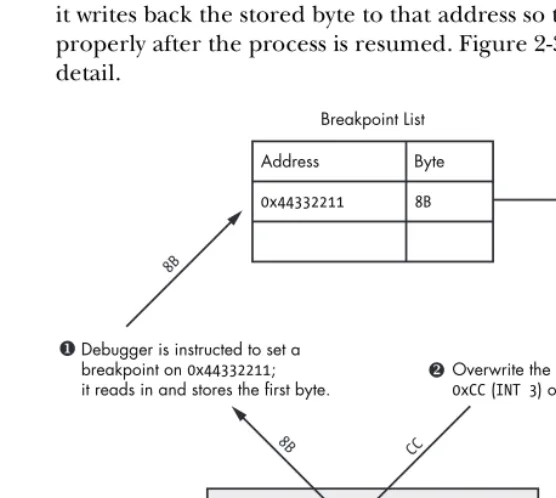
You can see that we have swapped out the 8B byte and replaced it with aCC byte. When the CPU comes skipping along and hits that byte, it halts, firing an INT3 event. Debuggers have the built-in ability to handle this event, but since you will be designing your own debugger, it’s good to understand how the debugger does it. When the debugger is told to set a breakpoint at a desired address, it reads the first opcode byte at the requested address and stores it. Then the debugger writes the CC byte to that address. When a break-point, or INT3, event is triggered by the CPU interpreting the CC opcode, the debugger catches it. The debugger then checks to see if the instruction pointer
(EIP register) is pointing to an address on which it had set a breakpoint previously. If the address is found in the debugger’s internal breakpoint list, it writes back the stored byte to that address so that the opcode can execute properly after the process is resumed. Figure 2-3 describes this process in detail.
Figure 2-3: The process of setting a soft breakpoint
As you can see, the debugger must do quite a dance in order to handle soft breakpoints. There are two types of soft breakpoints that can be set: one-shot breakpoints and persistent breakpoints. A one-shot soft breakpoint
means that once the breakpoint is hit, it gets removed from the internal breakpoint list; it’s good for only one hit. A persistent breakpoint gets restored after the CPU has executed the original opcode, and so the entry in the breakpoint list is maintained.
Debugger is instructed to set a breakpoint on 0x44332211;
it reads in and stores the first byte.
Overwrite the first byte with the
0xCC (INT 3) opcode.
When the CPU hits the breakpoint, the internal lookup occurs, and the byte is flipped back.
Breakpoint List Address Byte
0x44332211 8B
...
0x44332211: 8BC3 MOV EAX, EBX ...
8B
8B
CC
CPU (EIP)
Soft breakpoints have one caveat, however: when you change a byte of the executable in memory, you change the running software’s cyclic redundancy check (CRC) checksum. A CRC is a type of function that is used to determine if data has been altered in any way, and it can be applied to files, memory, text, network packets, or anything you would like to monitor for data altera-tion. A CRC will take a range of values—in this case the running process’s memory—and hash the contents. It then compares the hashed value against a known CRC checksum to determine whether there have been changes to the data. If the checksum is different from the checksum that is stored for validation, the CRC check fails. This is important to note, as quite often malware will test its running code in memory for any CRC changes and will kill itself if a failure is detected. This is a very effective technique to slow reverse engineering and prevent the use of soft breakpoints, thus limiting dynamic analysis of its behavior. In order to work around these specific scenarios, you can use hardware breakpoints.
2.4.2 Hardware Breakpoints
Hardware breakpoints are useful when a small number of breakpoints are desired and the debugged software itself cannot be modified. This style of breakpoint is set at the CPU level, in special registers called debug registers. A typical CPU has eight debug registers (registers DR0 through DR7), which are used to set and manage hardware breakpoints. Debug registers DR0 through DR3 are reserved for the addresses of the breakpoints. This means you can use only up to four hardware breakpoints at a time. Registers DR4 and DR5 are reserved, and DR6 is used as the status register, which determines the type of debugging event triggered by the breakpoint once it is hit. Debug register DR7 is essentially the on/off switch for the hardware breakpoints and also stores the different breakpoint conditions. By setting specific flags in the DR7 register, you can create breakpoints for the following conditions:
Break when an instruction is executed at a particular address. Break when data is written to an address.
Break on reads or writes to an address but not execution.
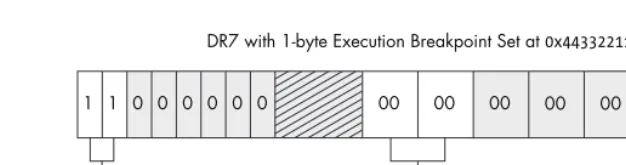
This is very useful, as you have the ability to set up to four very specific conditional breakpoints without modifying the running process. Figure 2-4 shows how the fields in DR7 are related to the hardware breakpoint behavior, length, and address.
Figure 2-4: You can see how the flags set in the DR7 register dictate what type of break-point is used.
Unlike soft breakpoints, which use the INT3 event, hardware breakpoints use interrupt 1 (INT1). The INT1 event is for hardware breakpoints and single-step events. Single-step simply means going one-by-one through instructions, allowing you to very closely inspect critical sections of code while monitoring data changes.
Hardware breakpoints are handled in much the same way as soft break-points, but the mechanism occurs at a lower level. Before the CPU attempts to execute an instruction, it first checks to see whether the address is currently enabled for a hardware breakpoint. It also checks to see whether any of the instruction operators access memory that is flagged for a hardware breakpoint. If the address is stored in debug registers DR0–DR3 and the read, write, or
Layout of DR7 Register
00 00 00 00 01 11 00 00 1 1 1 1 0 0 0 0
DR7 with Additional 2-byte Read/Write Breakpoint at 0x55667788
0x55667788 D R 1 00 00 00 00 00 00 00 00 1 1 0 0 0 0 0 0
DR7 with 1-byte Execution Breakpoint Set at 0x44332211
D R 0 Bits DR 3 Len 30 31 DR 3 Type 28 29 DR 2 Len 26 27 DR 2 Type 24 25 DR 1 Len 22 23 DR 1 Type 20 21 DR 0 Len 18 19 DR 0 Type 16 17 8 − 15 D R 0 0 L D R 1 2 L D R 2 4 L D R 3 6 L D R 0 1 G D R 1 3 G D R 2 5 G D R 3 7 G 0x44332211 Breakpoint Flags
00 – Break on execution 00 – 1 byte 01 – Break on data writes 01 – 2 bytes (WORD) 11 – Break on reads or writes but not execution 11 – 4 bytes (DWORD)
execute conditions are met, an INT1 is fired and the CPU halts. If the address is not currently stored in the debug registers, the CPU executes the instruction and carries on to the next instruction, where it performs the check again, and so on.
Hardware breakpoints are extremely useful, but they do come with some limitations. Aside from the fact that you can set only four individual breakpoints at a time, you can also only set a breakpoint on a maximum of four bytes of data. This can be limiting if you want to track access to a large section of memory. In order to work around this limitation, you can have the debugger use memory breakpoints.
2.4.3 Memory Breakpoints
Memory breakpoints aren’t really breakpoints at all. When a debugger is setting a memory breakpoint, it is changing the permissions on a region, or page, of memory. A memory page is the smallest portion of memory that an operating system handles. When a memory page is allocated, it has specific access permissions set, which dictate how that memory can be accessed. Some examples of memory page permissions are these:
Page execution This enables execution but throws an access violation if
the process attempts to read or write to the page.
Page read This enables the process only to read from the page; any
writes or execution attempts cause an access violation.
Page write This allows the process to write into the page.
Guard page Any access to a guard page results in a one-time exception,
and then the page returns to its original status.
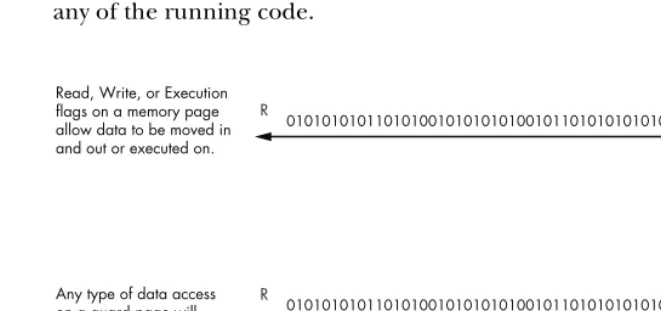
Most operating systems allow you to combine these permissions. For example, you may have a page in memory where you can read and write, while another page may allow you to read and execute. Each operating system also has intrinsic functions that allow you to query the current memory permissions in place for a particular page and modify them if so desired. Refer to Figure 2-5 to see how data access works with the various memory page permissions set.
doing with the contents. This breakpoint technique also works around the data alteration problems that soft breakpoints have, as we aren’t changing any of the running code.
Figure 2-5: The behavior of the various memory page permissions
Now that we have covered some of the basic aspects of how a debugger works and how it interacts with the operating system, it’s time to begin coding our first lightweight debugger in Python. We will begin by creating a simple debugger in Windows where the knowledge you have gained in both ctypes and debugging internals will be put to good use. Get those coding fingers warmed up.
Read, Write, or Execution flags on a memory page allow data to be moved in and out or executed on.
Any type of data access on a guard page will result in an exception being raised. The original data operation will fail.
010101010110101001010101010010110101010101001
R W
010101010110101001010101010010110101010101001
R W
GUARD PAGE EXCEPTION
Read Write Execute
3
B U I L D I N G A
W I N D O W S D E B U G G E R
Now that we have covered the basics, it’s time to
implement what you’ve learned into a real working
debugger. When Microsoft developed Windows, it
added an amazing array of debugging functions to
assist developers and quality assurance professionals. We will heavily utilize these functions to create our own pure Python debugger. An important thing to note here is that we are essentially performing an in-depth study of Pedram Amini’s PyDbg, as it is the cleanest Windows Python debugger implementa-tion currently available. With Pedram’s blessing, I am keeping the source as close as possible (function names, variables, etc.) to PyDbg so that you can transition easily from your own debugger to PyDbg.
3.1 Debuggee, Where Art Thou?
There are subtle differences between opening a process and attaching to a process. The advantage of opening a process is that you have control of the process before it has a chance to run any code. This can be handy when analyzing malware or other types of malicious code. Attaching to a process merely breaks into an already running process, which allows you to skip the startup portion of the code and analyze specific areas of code that you are interested in. Depending on the debugging target and the analysis you are doing, it is your call on which approach to use.
The first method of getting a process to run under a debugger is to run the executable from the debugger itself. To create a process in Windows, you call the CreateProcessA()1 function. Setting specific flags that are passed into this function automatically enables the process for debugging. A
CreateProcessA() call looks like this:
BOOL WINAPI CreateProcessA( LPCSTR lpApplicationName, LPTSTR lpCommandLine,
LPSECURITY_ATTRIBUTES lpProcessAttributes, LPSECURITY_ATTRIBUTES lpThreadAttributes, BOOL bInheritHandles,
DWORD dwCreationFlags, LPVOID lpEnvironment, LPCTSTR lpCurrentDirectory, LPSTARTUPINFO lpStartupInfo,
LPPROCESS_INFORMATION lpProcessInformation );
At first glance this looks like a complicated call, but, as in reverse engineering, we must always break things into smaller parts to understand the big picture. We will deal only with the parameters that are important for creating a process under a debugger. These parameters are lpApplicationName,
lpCommandLine, dwCreationFlags, lpStartupInfo, and lpProcessInformation. The rest of the parameters can be set to NULL. For a full explanation of this call, refer to the Microsoft Developer Network (MSDN) entry. The first two parameters are used for setting the path to the executable we wish to run and any command-line arguments it accepts. The dwCreationFlags parameter takes a special value that indicates that the process should be started as a debugged process. The last two parameters are pointers to structs (STARTUPINFO2 and
PROCESS_INFORMATION,3 respectively) that dictate how the process should be started as well as provide important information regarding the process after it has been successfully started.
1 See MSDN CreateProcess Function (http://msdn2.microsoft.com/en-us/library/ms682425.aspx).
2 See MSDN STARTUPINFO Structure (http://msdn2.microsoft.com/en-us/library/ms686331.aspx).
3 See MSDN PROCESS_INFORMATION Structure (http://msdn2.microsoft.com/en-us/library/
Create two new Python files called my_debugger.py and my_debugger_ defines.py. We will be creating a parent debugger() class where we will add debugging functionality piece by piece. In addition, we’ll put all struct, union, and constant values into my_debugger_defines.py for maintainability.
my_debugger_defines.py
from ctypes import *
# Let's map the Microsoft types to ctypes for clarity WORD = c_ushort
DWORD = c_ulong
LPBYTE = POINTER(c_ubyte) LPTSTR = POINTER(c_char) HANDLE = c_void_p
# Constants
DEBUG_PROCESS = 0x00000001 CREATE_NEW_CONSOLE = 0x00000010
# Structures for CreateProcessA() function class STARTUPINFO(Structure):
_fields_ = [
("cb", DWORD), ("lpReserved", LPTSTR), ("lpDesktop", LPTSTR), ("lpTitle", LPTSTR), ("dwX", DWORD), ("dwY", DWORD), ("dwXSize", DWORD), ("dwYSize", DWORD), ("dwXCountChars", DWORD), ("dwYCountChars", DWORD), ("dwFillAttribute",DWORD), ("dwFlags", DWORD), ("wShowWindow", WORD), ("cbReserved2", WORD), ("lpReserved2", LPBYTE), ("hStdInput", HANDLE), ("hStdOutput", HANDLE), ("hStdError", HANDLE), ]
class PROCESS_INFORMATION(Structure): _fields_ = [
my_debugger.py
from ctypes import *
from my_debugger_defines import *
kernel32 = windll.kernel32
class debugger(): def __init__(self): pass
def load(self,path_to_exe):
# dwCreation flag determines how to create the process # set creation_flags = CREATE_NEW_CONSOLE if you want # to see the calculator GUI
creation_flags = DEBUG_PROCESS
# instantiate the structs
startupinfo = STARTUPINFO()
process_information = PROCESS_INFORMATION()
# The following two options allow the started process # to be shown as a separate window. This also illustrates # how different settings in the STARTUPINFO struct can affect # the debuggee.
startupinfo.dwFlags = 0x1 startupinfo.wShowWindow = 0x0
# We then initialize the cb variable in the STARTUPINFO struct # which is just the size of the struct itself
startupinfo.cb = sizeof(startupinfo)
if kernel32.CreateProcessA(path_to_exe, None, None, None, None,
creation_flags, None,
None,
byref(startupinfo),
byref(process_information)):
print "[*] We have successfully launched the process!" print "[*] PID: %d" % process_information.dwProcessId
else:
print "[*] Error: 0x%08x." % kernel32.GetLastError()
my_test.py
import my_debugger
debugger = my_debugger.debugger()
debugger.load("C:\\WINDOWS\\system32\\calc.exe")
If you execute this Python file either via the command line or from your IDE, it will spawn the process you entered, report the process identifier (PID), and then exit. If you use my example of calc.exe, you will not see the calculator’s GUI appear. The reason you won’t see the GUI is because the process hasn’t painted it to the screen yet, because it is waiting for the debugger to continue execution. We haven’t built the logic to do that yet, but it’s coming soon! You now know how to spawn a process that is ready to be debugged. It’s time to whip up some code that attaches a debugger to a running process.
In order to prepare a process to attach to, it is useful to obtain a handle to the process itself. Most of the functions we will be using require a valid process handle, and it’s nice to know whether we can access the process before we attempt to debug it. This is done with OpenProcess(),4 which is exported from kernel32.dll and has the following prototype:
HANDLE WINAPI OpenProcess( DWORD dwDesiredAccess, BOOL bInheritHandle DWORD dwProcessId );
The dwDesiredAccess parameter indicates what type of access rights we are requesting for the process object we wish to obtain a handle to. In order to perform debugging, we have to set it to PROCESS_ALL_ACCESS. The
bInheritHandle parameter will always be set to False for our purposes, and the dwProcessId parameter is simply the PID of the process we wish to obtain a handle to. If the function is successful, it will return a handle to the process object.
We attach to the process using the DebugActiveProcess()5 function, which looks like this:
BOOL WINAPI DebugActiveProcess( DWORD dwProcessId
);
We simply pass it the PID of the process we wish to attach to. Once the system determines that we have appropriate rights to access the process, the target process assumes that the attaching process (the debugger) is ready to handle debug events, and it relinquishes control to the debugger. The
4 See MSDN OpenProcess Function (http://msdn2.microsoft.com/en-us/library/ms684320.aspx).
5 See MSDN DebugActiveProcess Function (http://msdn2.microsoft.com/en-us/library/
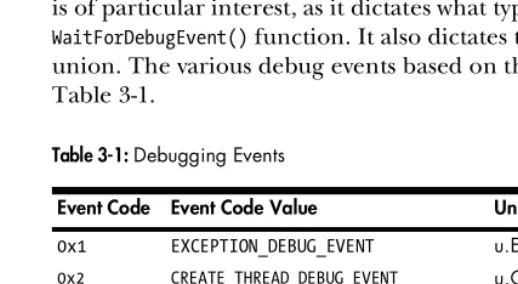
debugger traps these debugging events by calling WaitForDebugEvent()6 in a loop. The function looks like this:
BOOL WINAPI WaitForDebugEvent( LPDEBUG_EVENT lpDebugEvent, DWORD dwMilliseconds );
The first parameter is a pointer to the DEBUG_EVENT7 struct; this structure describes a debugging event. The second parameter we will set to INFINITE so that the WaitForDebugEvent() call doesn’t return until an event occurs.
For each event that the debugger catches, there are associated event handlers that perform some type of action before letting the process continue. Once the handlers are finished executing, we want the process to continue executing. This is achieved using the ContinueDebugEvent()8 function, which looks like this:
BOOL WINAPI ContinueDebugEvent( DWORD dwProcessId,
DWORD dwThreadId, DWORD dwContinueStatus );
The dwProcessId and dwThreadId parameters are fields in the
DEBUG_EVENTstruct, which gets initialized when the debugger catches a debugging event. The dwContinueStatus parameter signals the process to continue executing (DBG_CONTINUE) or to continue processing the exception (DBG_EXCEPTION_NOT_HANDLED).
The only thing left to do is to detach from the process. Do this by calling
DebugActiveProcessStop(),9 which takes the PID that you wish to detach from as its only parameter.
Let’s put all of this together and extend our my_debugger class by providing it the ability to attach to and detach from a process. We will also add the ability to open and obtain a process handle. The final implementation detail will be to create our primary debug loop to handle debugging events. Open
my_debugger.py and enter the following code.
WARNING All of