15
A Novel Content Based Image Retrieval Method for Large Image
Dataset
Rupesh Lahori
PG Scholar, CSE, RITS, Bhopal E-mail: [email protected]
Himanshu Yadav
Assistant Professor, CSE, RITS, Bhopal E-mail: [email protected]
Anurag Jain Head CSE
Email: [email protected] Abstract
In numerous application domains like medical, education, crime hindrance, geography, commerce, and biomedicine, the quantity of digital info is growing quickly. The problem seems once retrieving the knowledge from the storage media. Content-based image retrieval systems aim to retrieve images from massive image databases almost like the question image supported the similarity between image options. During this work we tend to tend to gift a CBIR system that uses the color feature as a visible feature to represent the images. The information contains color images, thus we tend to use the RGB color area to represent the images. We tend to use Diagonal Mean, histogram Analysis, R G B parts and Retrieving similar images exploitation Euclidean Distance. For the ensuing images we tend to extract the color feature by counting the precision. We tend to compared with alternative existing systems that use identical options to represent the images. We tend to represent higher performance of our system against the opposite systems.
Keywords: CBIR, Euclidean distance, histogram analysis, similarity, R G B elements. I. INTRODUCTION
Techniques for image retrieval follow 2 main approaches [1]: Text-Based Image Retrieval (TBIR) and Content-Based Image Retrieval (CBIR). TBIR techniques use descriptions provided by matter annotation, which can introduce inconsistencies thanks to the human commentator. This can be thanks to the actual fact that, in several domains, text cannot accurately capture the visual attributes of a image supported human perception. CBIR techniques, in turn, use content based mostly description rather than matter description. In CBIR, the photographs area unit indexed / retrieved considering their extracted visual options, like color, texture and form options [2]. Such options along outline feature vectors containing m parts that area unit taken as points in associate m-dimensional area. Within the options area, one assumes that a question purpose is encircled by points that represent the foremost similar images to a given image of interest, associate operation well-known as similarity question. Such queries area unit fitly calculated with the appliance of difference functions, one in all the bases of CBIR.
Content-based image retrieval (CBIR) is employed to retrieve images from associate archived information or the online, supported analysis of image content and a user question. CBIR distinguishes itself from ancient text-based image retrieval by analyzing the image content directly for color, texture and form options, instead of by mistreatment manually further annotations as in text-based image retrieval. CBIR will cut back the issues of tedious manual labeling, with regards to quality and energy. CBIR applications are broadly speaking employed in the fields of internet looking out, medical image, crime bar, fingerprint, face recognition, remote sensing, and on-line image retrieval [3].
16
Figure 1: CBIR system core composition.
Like many other information retrieval systems, CBIR comprises feature extraction, representation, and similarity measure and system evaluation. Figure 1 shows the basic composition of a CBIR system. Unlike different retrieval systems, the options for CBIR area unit extracted from the image itself. Therefore, a serious challenge of CBIR is to derive and represent purposeful linguistics of a image from varied visual options, like color, texture and form options. Conforming to a feature hierarchy, CBIR is classified into three levels: primary, structural and semantic. Primary level retrieval is based on an image’s primary features, such as pixel-level color and texture information. For example, ‘finding images where red color covers more than 50% of the surface’ is a primary level retrieval task. Humans might seek out, for example, an image which they associate with a bus. This is semantic level retrieval. A structural level feature, such as a cuboids’ shape, can be organized from lower-level attributes and then used to represent higher-level semantics.
For image content representation and similarity measure, the most common methods are histogram or vector space based. Histogram methods can represent the statistical distribution of features and are easy to interpret. They are successfully used in color-based retrieval, but require a large indexing space. Vector methods require much smaller representation space, but may overlook some probability distribution information. Similarity measure methods accordingly include vector, histogram, etc.
The need to search out a desired image from a group is shared by several skilled teams, as well as journalists, style engineers and art historians. whereas the wants of image users will vary significantly, it is helpful to characterize image queries into 3 levels of abstraction, first is primitive options like color or shape, second is logical options like the identity of objects shown and last one is abstract attributes like the importance of the scenes delineate. Whereas CBIR systems presently operate effectively solely at rock bottom of those levels, most users demand higher levels of retrieval.
We have enforced the CBIR system that takes into thought the low level options of image that is additional comprehensive when put next to high level options and it conjointly offers user the next level of retrieval. We got divided an image into 2 terribly basic classes of color and grey scale and used completely different options vector for similarity comparison and retrieval. We have a tendency to square measure mistreatment columnar mean, diagonal mean and histogram for grey scale and RGB values and Euclidean Distance method ways for color image. Users invariably need simply and effectively use the system while not truly going into the finer details of the operating. So, to form such a user friendly platform for the system we've got designed a GUI based wherever user will truly choose methodology that they need to be used for the image retrieval which can offer them associate degree possibility of mistreatment completely different method if the result's not as per their demand.
The remainder of this paper is structured as follows. Section 2 presents conventional color histogram. Section 3 presents related work. Section 4 formally describes the proposed methods. Section 5 details the experimental evaluation. Finally, Section 6 presents the conclusions and points out future works.
II. THE CONVENTIONAL COLOR HISTOGRAM
The conventional color histogram (CCH) of a image indicates the frequency of prevalence of each color in a image. From a probabilistic perspective, it refers to the likelihood mass perform of the image intensities. It captures the joint possibilities of the intensities of the color channels (R, G and B within the RGB color-space, or H, S and V within the HSV color-space, and equally for different color spaces). The CCH may be portrayed as angular distance, B, c (a, b, c) = N. Prob (A=a, B=b, C=c), where A, B and C are the 3 color channels, and N is that the range of pixels within the image [4]. Computationally, it's created by numeration the amount of pixels of every color (in the amount color space). The appealing facet of the CCH is its simplicity and simple computation. There are but, many difficulties related to the CCH. The primary of those is that the high spatiality of the CCH,
17
even when forceful division of the color house. Another drawback of the CCH is that it doesn't take into thought color similarity across completely different bins. Further, the CCH may be a world image feature that doesn't code any color-spatial data.
a. THE COLOR CORRELOGRAM
The Color Correlogram (CC) expresses however the abstraction correlation of pairs of colors changes with distance. A CC for an image is outlined as a table indexed by color pairs, wherever the dth entry for row specifies the likelihood of finding a image element of color j at a distance d from a image element of color i within the image [5]. In general, since native correlations between completely different colors area unit additional vital than world correlations in a image, a tiny low price of d is adequate to capture special correlations. Associate in nursing economical rule for computing the CC exists and is delineated in [5]. The computation is linear within the image size. The highlights of the CC technique area unit that it encodes native further as world abstraction info, and it's been shown to figure well for coarse color images [5]. Huang et al. have shown in [5] that 8-color CC performs higher than 64-color CCH within the CBIR drawback. The most important downside of this technique is that the high spatial property of the feature house. [6] Bestowed an outline of color and texture descriptors that are approved for the ultimate Committee Draft of the MPEG-7 normal. The color and texture descriptors that area unit delineated during this paper have undergone in depth analysis and development throughout the past 2 years. Analysis criteria embody effectiveness of the descriptors in similarity retrieval, further as extraction, storage, and illustration complexities. The color descriptors within the normal embody a histogram descriptor that's coded victimization the Haar remodel, a color structure bar chart, a dominant color descriptor, and a color layout descriptor. The 3 texture descriptors embody one that characterizes uniform texture regions and another that represents the native edge distribution. A combine descriptor that facilitates texture browsing is additionally outlined. Every of the descriptors are explained very well by their linguistics, extraction and usage. The effectiveness is documented by experimental results [6]. b. COLOR-SHAPE BASED METHOD
Howe et al. have planned in [7] a color-shape primarily based methodology (CSBM) supported color, space and perimeter-intercepted lengths of divided objects in an image. The algorithmic program starts by cluster image pixels into K clusters per the K-means algorithmic program. The average of every cluster is thought to be a representative color for the cluster. A quantity color image I' is obtained from the first image I by quantizing element colors within the original image into K colors. A connected region having pixels of identical color is thought to be associate degree object. The world of every object is encoded because the variety of pixels within the object. Further, the form of associate degree object is characterized by 'perimeter-intercepted lengths' (PILs), obtained by intercepting the item perimeter with eight line segments having eight completely different orientations and spending through the item center. The PILs are shown to be an honest characterization of object shapes. The immediate advantage of this methodology is that it encodes object shapes still as colors. The disadvantage on the opposite hand is a lot of concerned computation, and also the have to be compelled to confirm acceptable color thresholds for the division of the colors. Another downside of CSBM is its impressionability to distinction and noise variation.
III. RELATED WORK
Traditional CBIR methods are mainly focused on visual features like: global and local features. Global feature-based methods target at the whole image as visual content, e.g., color, texture and while local feature-feature-based methods target mainly on core points or prominent patches. Numerous algorithms are deliberate for the extraction of global and local features. Generally similarity between two images is based on a computation involving the Euclidean distance or histogram intersection between the respective extracted features of two images. Both these methods involve an intuitive extension of the mathematical definition of a distance between two objects [8]. The three most common characteristics upon which images are compared in CBIR algorithms are color, texture and shape.
Utilizing shape information for automated image comparisons requires algorithms that perform some form of edge detection or image segmentation. The image segmentation defines as identification of the major color regions in an image [9]. These regions can then be compared from one image to the next image. The edge detection tends to be slightly more complicated as it attempts to identify the major contours and edges in a given image. These edges may be then compared based on their direction, with respect to image edges [10]. The advantages of this technique embrace its relevance to black and white images. However, the performance of the rule isn't invariant on scale or translation manipulations of images. Data regarding the feel of images may be even tougher to extract mechanically throughout retrieval. Typically algorithms have faith in the comparison of adjacent pixels to work out the distinction or similarity between pixels [9].
18
similarity supported the similarity of 3 totally different histograms, one for every part of a RGB pixels. The similarity is computed employing a Euclidian distance operate scrutiny every ‘bin’ of the histograms. The retrieval was then applied by checking out images with the minimum distance to a image. The experiment applied testing exploitation an image info consisting of logos. The results demonstrate that even with this comparatively straightforward implementation, over ninetieth of the time an image question is matched accurately with an image within the info. The experiment to boot goes on to incorporate type choices from the images at intervals. The work worn out [8] performs and a lot of comprehensive analysis of the histogram approach by finding out a number of the particular algorithms utilized to hold out the comparisons and retrievals. The style during which authors carries out the particular histogram creation is slightly totally different from the tactic planned [4]. Rather than computing histograms individually for every of the red, inexperienced or blue elements of an image element, the Jeong experiment tries to make bins that contain data from all 3. Thus, the quantity of bins is way larger. To boot, the experiment conjointly tests the retrieval mechanism utilizing HSV (hue, saturation and value) pixels that need totally different bin sizes.
Most existing platforms for retrieving images supported image content implement algorithms that extract a mixture of form, texture and form options from an image. Then weights area unit usually appointed to every piece of knowledge extracted from the images associate degreed an overall similarity is computed. Images will then be hierarchical supported this similarity computation. Variety of each closed and open supply package product is often found [12]. A well-liked system that has been enforced is IBM’s QBIC system [11]. The system has been enforced by the abode deposit web site that permits users to go looking through their digital library of design exploitation QBIC’s color and layout comparison tools [11].
In addition, there are a unit variety of alternative alone on-line applications giving services that perform some type of content primarily based image retrieval. a number of these applications were utilized in the testing method for color histogram technique. SIMPLIcity (also developed as ALIPR) is one such on-line tool developed by Li and Wang at Penn State [13]. The web tool combines aspects of sensible tagging and content primarily based image search [13]. CIRES (Content primarily based Image REtrieval System) tool is another such on-line tool developed by Qasim Iqbal at the University of Lone-Star State [14]. The tool extracts data from images to see structural data, color histograms and textural data. Additionally, the web site offers image info that one will search at intervals exploitation images as queries. Also, the tool permits the user to come to a decision the weights appointed to every kind of data extracted from the image. The ultimate such system utilized throughout our testing is AIRS (Advanced Image Retrieval) developed by the ImageClick Corporation. The system augments straightforward keyword looking out with the beta version of its visual/texture primarily based computer program. Currently, the web site permits users to go looking at intervals thumbnails provided from its image info [15].
IV. PROPOSED WORK
Content-based image retrieval (CBIR), additionally called question by image content (QBIC) and content-based visual information retrieval (CBVIR) is that the application of pc vision techniques to the image retrieval terribly troublesome, the problem arise checking out digital pictures in massive image databases. The “Content-based" refers that the search can analyze the particular contents of the image instead of the data similar to keywords and descriptions involved the image. The term 'content' during this context may describe colors, textures, shape, etc. which will be derived from the image itself. Here we have a tendency to take image feature because the index to it image and retrieve that individual image. During this paper we have a tendency to planned four strategies to retrieve each Color and grey scale pictures.
• Diagonal Mean
• Histogram investigation
• R G B Elements
• Retrieving similar images using Euclidean Distance
Here Diagonal Mean and histogram analysis ways are used for grey Scale images, and RGB elements and Retrieving similar images victimization Euclidian Distance ways are used for color images. Here we have an inclination to change the menstruation of the image to be 256x256 for the image analysis and have extraction. If the input image is over the specified dimension then we have a tendency to be attending to size it to 256X256.For grey scale image analysis we've taken Post grey Map (PGM) images and for color (RGB) image analysis we've taken JPG pictures.
a. GRAY SCALE IMAGE ANALYSES COLUMNAR MEAN
Columnar Mean is one in all the methodologies that we have a tendency to use within the CBIRS to retrieve grey map images. During this methodology we have a tendency to take solely grey scale image for image analysis. During this approach we have a tendency to calculate the typical (Empirical Mean or just Mean) price of every
19
column of the image (because image is hold on as matrix victimization normal MATLAB matrix conventions) and create those values because the index for that image and square measure hold on within the info. Whereas retrieving the image from the info supported the input image, we have a tendency to calculate mean of every column of the input image and can compare these values therewith hold on within the info, if there's a match then we'll retrieve those images.
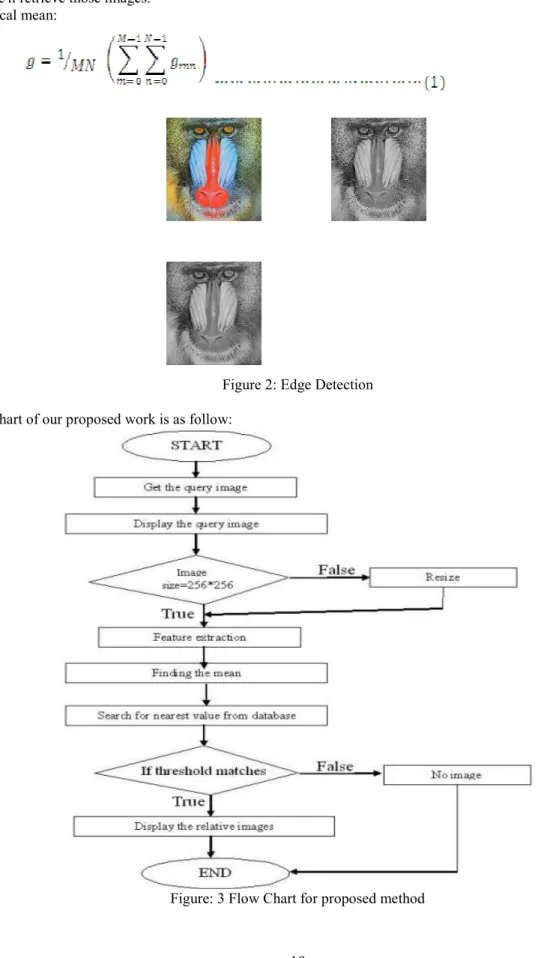
Empirical mean:
Figure 2: Edge Detection Flow chart of our proposed work is as follow:
20
DIAGONAL MEAN
In this approach we have a tendency to determine the Empirical Mean value of the pixels that deception on the principle diagonal of the image (since image is hold on as a matrix victimization commonplace MATLAB matrix conventions) and build that value because the index for that image and is hold on within the information. Whereas retrieving the image from the information supported the input image, we have a tendency to calculate norm of diagonal components of the input image and can compare these values thereupon hold on within the information, if there's a match then those images area unit retrieved. The advantage of victimization this technique is rather than taking norm of all the 256 rows because the index, we have a tendency to take just one worth because the index for that image. Therefore the machine time is reduced as we'd like to match just one field within the information. However the drawback of this approach is accuracy of the image retrieval is a smaller amount and therefore reducing the potency of the CBIRS.
Figure: 4 Diagonal mean
HISTOGRAM ANALYSIS
The Histogram may be an outline graph showing a count of the info points falling in varied ranges. The impact may be a rough approximation of the statistical distribution of the info. The teams of information area unit referred to as categories, and within the context of a histogram they're referred to as bins, as a result of one will consider them as containers that accumulate knowledge and "fill up" at a rate adequate the frequency of that knowledge category. An image histogram may be a chart that shows the distribution of the quality of being intense in associate degree indexed or intensity image. The image histogram operate imhist creates this plot by creating n equally spaced bins, every representing a variety of information values. It then calculates the quantity of pixels at intervals.
Syntax for Histogram Analysis:-
Imhist (I, n) displays a histogram wherever n specifies the quantity of bins employed in the bar graph. n conjointly specifies the length of the color bar. If I may be a binary image, n will solely have the worth two. [counts, x] = imhist (...) returns the histogram counts in counts and also the bin locations in x. The subsequent example exhibit a image and a histogram supported 64 bins.
1. Scan image and show it. I = imread('flowers.pgm'); imshow(I);
2. Show histogram of image. figure, imhist(I,128);
In this approach we tend to calculate the histogram counts for the required range of bins and that we index those count prices to represent that image. Supported these count values we tend to retrieve the photographs from the information. The advantage of victimization histograms for image retrieval is, histogram search characterizes a image by its color distribution, or histogram however the downside of a world histogram illustration is that data regarding object location, shape, and texture is discarded.
21
Figure: 5 (a, b) Histogram of image
b. Color Image Investigation RGB COMPONENTS
RGB image, typically brought up as a real color image, is hold on in MATLAB as associate m-by-n-by-3 information array that defines red, green, along with blue color elements for every individual component. RGB images don't use a palette. The color of every component is decided by the mix of the red, green, and blue intensities hold on in each color plane at the pixel's position. Graphics file formats store RGB images as 24-bit images, wherever the red, green, and blue elements square measure eight bits every. This yields a possible of sixteen million colors.
The exactitude with that a real-life image will be replicated has diode to the unremarkably used term true color image. To any illustrate the idea of the 3 separate color planes employed in associate RGB image, the code sample below produces a straightforward RGB image containing continuous areas of red, green, and blue, then creates one image for every of its separate color planes (red, green, and blue). It displays every color plane image severally, and conjointly displays the initial image.
RGB=reshape(ones(64,1)*reshape(jet(64),1,192),[64,64,3]); • R=RGB(:,:,1);
• G=RGB(:,:,2); • B=RGB(:,:,3); • imshow(R);
The subsequent figure represents an RGB image of class double.
Figure: 6 RGB values of an Image
To any illustrate the idea of the 3 separate color planes employed in associate RGB image, the code sample below creates a straightforward RGB image containing uninterrupted areas of red, green, and blue, then creates one image for every of its separate color planes (red, green, and blue). It displays every color plane image severally, and conjointly displays the initial image.
22 RGB=reshape(ones(64,1)*reshape(jet(64),1,192),[64,64,3]); • R=RGB(:,:,1);
• G=RGB(:,:,2); • B=RGB(:,:,3);
Figure: 7 Separate RGB plane
RETRIEVING SIMILAR IMAGES USING EUCLIDEAN DISTANCE
We utilize average RGB to calculate color similarity. Average RGB is to cipher the ordinary worth in R, G, and B channel of every component in a image, and use this as a descriptor of a image for comparison purpose. The typical points of R, G, and B used for scheming the Euclidian distance is that the same worth that is employed within the retrieval of images victimization RGB parts for color images. Euclidian distance could be a geometrical idea that takes into thought the co-ordinate values of the component points between that the gap is to be found. This distance defines the position variance of 2 points in terms of component values that just in case of image process is that the values of R, G, and B.
Three equations for computing the typical R, G, B part of a image I x=w, y=h r = R (I(x,y)) / (w x h) x=1, y=1 x =w, y=h r = R (I(x,y)) / (w x h) x=1, y=1 x=w, y=h r = R (I(x,y)) / (w x h) x=1, y=1
Here is that the equation for distance live of image Ia and Ib, we have a tendency to use the weighted geometer distance. the space between 2 actual images are zero and therefore the distance between 2 most dissimilar images (black and white) are one or 255 looking on whether the vary of RGB is from zero to one or zero to 255. Formula used for shrewd the geometer Distance is as follows:
……….………….. (2)
In this methodology we tend to calculate the gap between the question image and candidate set images hold on within the info, if the gap is among the already mounted threshold then we are going to retrieve those images because the similar images to the question images. The benefit of this approach is that it's straightforward to implement and it conjointly incorporates a disadvantage that it consumes additional computation time once the quantity of images within the info will increase.
V. Experimental Results
We took information set of Wang’s [11] dataset comprising of one thousand Corel images with ground truth. The image set includes one hundred images in every of 10 classes. The photographs square measure of the scale
23
256 x 384 or 384 x 256. The experiments were disbursed as explained within the sections a pair of and three. The results square measure benchmarked with commonplace systems mistreatment equivalent information as in [16, 17, 18, and 19].
The quantitative live outlined is average preciseness as explained below:
Where p (i) is precision of query image i, ID (i) and ID ( j) are category ID of image i and j respectively, which are in the range of 1 to 10. The r (i, j) is the rank of image j (i.e. position of image j in the retrieved images for query image i , an integer between 1 and 1000). This value is the percentile of images belonging to the category of image i in the first 100 retrieved images.
The average precision t p for category t (1 ≤ t ≤ 10) is given by:-
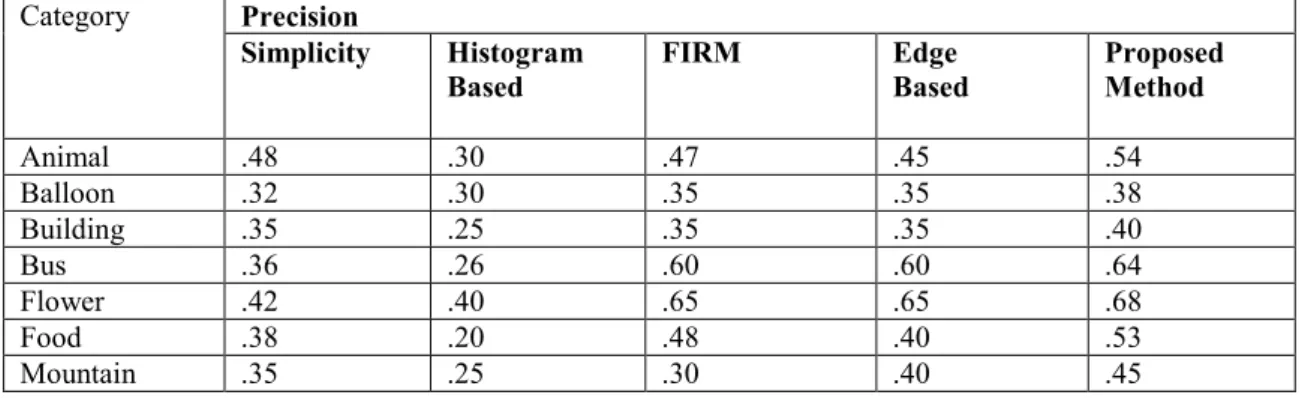
The comparison of experimental results of projected technique with alternative customary retrieval systems reportable within the literature [16, 17, 18, and 19] is bestowed in Table No.1. The SIMPLIcity and FIRM are each segmentation primarily based strategies. Since in these strategies, unsmooth and non unsmooth regions are treated otherwise with completely different feature sets, their results are claimed to be higher than histogram primarily based technique [18]. Further, edge primarily based system [19] is at par or occasionally higher than SIMPLIcity [16] and FIRM [17]. But, in most of the classes our projected technique has performed at par or occasionally even higher than these systems. Table one shows the sample retrieval results for all the 10 classes. Table 1: Difference between average precision obtained by proposed method with other standard retrieval systems Category Precision Simplicity Histogram Based FIRM Edge Based Proposed Method Animal .48 .30 .47 .45 .54 Balloon .32 .30 .35 .35 .38 Building .35 .25 .35 .35 .40 Bus .36 .26 .60 .60 .64 Flower .42 .40 .65 .65 .68 Food .38 .20 .48 .40 .53 Mountain .35 .25 .30 .40 .45
Graph 1: Difference between average precision obtained by proposed method with other standard retrieval systems 0 0.2 0.4 0.6 0.8
animal ballon building bus flower food moutain
P
re
c
is
io
n
Category
Comparison of Avg. Precision
Simplicity
histogram based firm
edge based
24 0 0.1 0.2 0.3 0.4 0.5 0.6 0.7 0.8
animal building flower mountain
P
re
ci
si
o
n
Category
Comparison of Avg. Precision
Simplicity Histogram Based FIRM Edge Based Proposed Method VI. CONCLUSION
Nowadays, content-based image retrieval is an open research issue. Numerous specialists are carried out to create a few algorithms that comprehend a few issues and succeed the precision once recovering pictures and distinguishing between them. A few arranged algorithms use image to concentrate choices and utilize their alternatives for comparability matching. On the other hand, a large portion of the algorithms utilize the gray scale image. In our work, we tend to utilize the color image to extract the color feature and use it for closeness matching. We have a tendency to do that as a result of most images in our world square measure color images. So, color feature is one in all the foremost options that may be taken into consideration once developing a CBIR system.
In our work, we used WANG database that is widely used for CBIR. This database contains 1000 images divided into 10 classes where 100 images for each class. Images in the database are friendly and used for evaluating many CBIR systems. We used it to evaluate the performance of our system by calculating the Precision. We used the RGB color space to represent the images. We used the color feature to represent the images in the database. We proposed four methods to retrieve both Color and Gray scale images these methods are Diagonal Mean, Histogram Analysis, R G B components and Retrieving similar images using Euclidean Distance. We calculated the moments for the image to be the descriptor of the image. We also compared our proposed system with other existing CBIR systems that use the same database we have used for system evaluation. The comparison shows that our system outperforms the other systems and the results are satisfactory. To more improve the retrieval results, segmentation may be a technique to extract regions and objects from the image. The divided regions are used for similarity matching. The retrieval by abstract attributes was still not satisfied to human perception. Moreover, the retrieval involved human interference and is time consuming besides inconsistency. There is a need to further increase the confidence in image understanding and to effectively retrieve similar images that are conform to human perception and without human interference. The domain should be not specific but broad where all the extracted semantic features are applicable for any kind of images collection. There are still some spaces which need to be improved besides the challenges that are associated with mapping low level to high level concepts such as friendly user interface as well as an efficient indexing tool are needed for contributing to successful Image Retrieval.
VII.REFERENCES
[1.] Lakdashti, Abolfazl, Mohammad Shahram Moin, and Kambiz Badie. "Semantic-based image retrieval: A fuzzy modeling approach." In Computer Systems and Applications, 2008, AICCSA 2008, IEEE/ACS International Conference on, pp. 575-581. IEEE, 2008
[2.] Alemu, Yihun, Jong-bin Koh, Muhammad Ikram, and Dong-Kyoo Kim. "Image retrieval in multimedia databases: A survey." In Intelligent Information Hiding and Multimedia Signal Processing, 2009. IIH-MSP'09. Fifth International Conference on, pp. 681-689. IEEE, 2009
25
Technology Applications Programme." Institute for Image Data Research, University of Northumbria at Newcastle (1999).
[4.] J. R. Smith and S.-F. Chang, “Automated image retrieval using color and texture”, Columbia University, Tech. Rep CU/CTR , 408-95-14, July 1995
[5.] J. Huang, S. R. Kumar, M. Mitra and W. J. Zhu, R. Zabih, “Image Indexing Using Color Correlograms”,
Proc. IEEE Conf. on Computer Vision and Pattern Recognition, pp. 762 - 768, June 1997.
[6.] B. S. Manjunath, J. R. Ohm, V. V. Vasudevan, A. Yamada, “Color and texture descriptors,” IEEE Transactions on, Circuit and Systems for Video Technology, vol. 11(6) pp.703-715, 2001.
[7.] N. R. Howe and D. P. Huttenlocher, “Integrating Color, Texture and Geometry for Image Retrieval”, Proc. IEEE Conf. on Computer Vision and Pattern Recognition, vol. II, pp. 239-246, June 2000.
[8.] Jeong, Sangoh. Histogram-Based Color Image Retrieval. Psych221/EE362 Project Report, Stanford University, 2001.
[9.] Smith, John R, and Shi-Fu Chang. “Tools and Techniques for Color Retrieval.” Electronic Imaging: Science and Technology-Storage~ Retrieval for Image and Video Database IV. San Jose: IS&T/SPIE, 1996. 1-12. [10.] Jain, Anil K., and Aditya Vailaya. Image Retrieval Using Color And Shape. Great Britain: Elsevier
Science Ltd, 1995.
[11.] QBIC - IBM's Query By Image Content. http://wwwqbic.almaden.ibm.com/ (accessed November 2008). [12.] Content-based image retrieval - Wikipedia. 5 November 2008. http://en.wikipedia.org/wiki/CBIR
(accessed November 8,2008)
[13.] Wang, James Z. ALIPR/SIMPLIcity/ALIP:Object Concept Recognition/Content Based Image Retrieval/Annotation. 1995. http://wang.ist.psu.edu/IMAGE/
[14.] Iqbal, Qasim. CIRES: Content Based Image Retrieval System. August 2007. http://amazon.ece.utexas.edu/~qasim/research.htm
[15.] AIRS - Advanced Image Retrieval Service. http://www.imageclick.com/airs/sub/aboutAIRs.html [16.] Chen, Yixin, and James Ze Wang. "A region-based fuzzy feature matching approach to content-based
image retrieval." Pattern Analysis and Machine Intelligence, IEEE Transactions on 24, no. 9 (2002): 1252-1267.
[17.] Li, Jia, James Z. Wang, and Gio Wiederhold. "IRM: integrated region matching for image retrieval." In Proceedings of the eighth ACM international conference on Multimedia, pp. 147-156. ACM, 2000. [18.] Rubner, Yossi, Leonidas J. Guibas, and Carlo Tomasi. "The earth mover’s distance, multi-dimensional
scaling, and color-based image retrieval." InProceedings of the ARPA image understanding workshop, pp. 661-668. 1997.
[19.] Banerjee, M., M. K. Kundu, and P. K. Das. "Image retrieval with visually prominent features using fuzzy set theoretic evaluation." (2006): 298-303.