Research Article ISSN 2250-0480 VOL 7/ ISSUE 3/JULY2017
P-28
Pharmaceutical Science Analysis
DEVELOPMENT AND VALIDATION OF A RP-HPLC METHOD FOR
SIMULTANEOUS DETERMINATION OF ARTEMETHER AND
LUMEFANTRINE IN TABLET DOSAGE FORM
MILIND POPATRAO WAGH1 AND ANURADHA ARVIND RANPISE2*
1Department of Pharmaceutics, NDMVP Samajs College of Pharmacy,
Nashik- 422 002, India.
2*Department of Pharmaceutics, Marathwada Mitra Mandal's College of Pharmacy,
Thergaon, Pune-411 033, India.
ABSTRACT
A simple, sensitive, specific, precise and accurate stability indicating reverse phase liquid chromatographic method was developed for simultaneous determination of Artemether and Lumefantrine in bulk drugs and pharmaceutical formulations. The chromatographic analysis was performed by Microsorb-MV100-5 C-18 column (250 x 4.6mm, 5 µm), with mobile phase consisting of buffer and acetonitrile in the ratio of 65:35v/v, orthophosphoric acid used as buffer (pH 3.5), at a flow rate of 1 ml/min and eluents monitored at 254nm. The method was validated for linearity, accuracy, precision, robustness and application for assay as per ICH guidelines. The retention times of Artemether and Lumefantrine were 2.67 and 4.62 min, respectively. The calibration curves of peak area versus concentration, which was linear from 5-30µg/ml for Artemether and 60-210µg/ml for Lumefantrine, had regression coefficient (r2) greater than 0.999 & precise (R.S.D. < 2.0%). The method had the requisite accuracy, precision, and robustness for simultaneous determination of Artemether and Lumefantrine in tablets.
Keywords: Artemether, Lumefantrine, RP-HPLC, Simultaneous determination, Method development
INTRODUCTION
Malaria is the world’s most important parasitic infection, ranking among the major health and developmental challenges for the poor countries of the world1. One of the greatest challenges facing malaria control worldwide is the spread and intensification of parasite resistance to antimalarial drugs. Artemisinin-based combination therapy (ACT) is increasingly being advocated as promising treatment. ACT is based on the use of two drugs with different modes of action: an artemisinin-derivative that causes rapid and
effective reduction of parasite biomass and gametocyte carriage and a partner drug that has a longer duration of action2. Artemether (ART) is chemically, (3R,5aS,-6R, 8aS,9R,10S,12R,12aR)-Decahydro-10-methoxy-3,6,9-tri-methyl- 3,12-epoxy-12H-pyrano [4,3-j]-1,2-benzodioxepin and is used as antimalarial agent.(Fig.1A) Lumefantrine (LUM) is chemically, 2,
7-Dichloro-9-[(4-chlorophenyl)
Research Article ISSN 2250-0480 VOL 7/ ISSUE 3/JULY2017
P-29
Pharmaceutical Science Analysis Figure 1
Chemical structure of Artemether (A) and Lumefantrine (B)
ART-LUM is an ACT widely used nowadays and consists of a registered fixed dose combination of ART (20 mg) and LUM (120 mg) in tablets3. ART
has a rapid onset of action and is rapidly eliminated from the plasma (half-life of two to three hours.4 LUM is cleared more slowly and has a longer elimination half-life (approximately 4.5 days)5. The rationale behind this combination is that ART initially provides rapid symptomatic relief by reducing the number of parasites present before LUM eliminates any residual parasites. ART-LUM also reduces gametocyte carriage and thus should have an impact on malaria transmission6. The increasing use of ART-LUM association as an effective treatment for resistant malaria demands the need of analytical methods to simultaneously quantify these drugs in tablets in order to evaluate its quality. Some papers have described the analysis of ART in plasma, based on HPLC with electrochemical7–9 or mass spectrometry detection 10. Few methods are available to assay ART in
pharmaceutical products.11,12 The quantitative determination of LUM in plasma has been described using HPLC with UV detection.13, 15 Due to the low molar absorptivity of ART in the UV region (210 nm), and the lower concentration of this drug in the tablets compared to LUM, standard addition of ART was carried out to improve its detection which gives need for the simultaneous quantitation of ART and LUM. The validated method was applied to the analysis of fixed-dose combination tablets containing 40mg ART and 240 mg of LUM. The proposed method is. The objective of the present investigation was to develop & validate simple, accurate, reproducible, stability-indicating and suitable for routine determination of ART and LUM in tablet dosage form with RP-HPLC method.
MATERIALS AND METHODS
ART and LUM reference standards received as gift sample from Ipca Laboratories, Mumbai. Tablets were purchased from local pharmacies which was manufactures by Ipca Laboratories (Mumbai, India) Lumerax-40®. Ultra-pure water was obtained from a Double Distillation Apparatus-BOROSIL. Acetonitrile (HPLC grade) was obtained from E-Merck (India) Ltd, Mumbai, India. All other chemicals used in the analysis were AR grade. The HPLC analyses were carried out on Agilent Technology 1260 infinity with PDA Detector Microsorb-MV 100-5 C-18 column (250 x 4.6mm, 5 µm). UV detection was performed at 254nm. UV spectra from 200 to 400 nm were online recorded for peak identification. The injection volume of sample was 20µL. An isocratic mobile phase containing acetonitrile and 0.01M potassium dihydrogen orthophosphate buffer (65:35), at the pH 3.5 was carried out with the flow rate of 1mL/min. Before the analysis, the mobile phase was degassed using Equiptronics sonicator (Equiptronics EQ 664) and filtered through a 0.45µm filter (Gelman Science, India). Sample solutions were also filtered through a filter. The system was equilibrated before making each injection.
Preparation of standard solution
Research Article ISSN 2250-0480 VOL 7/ ISSUE 3/JULY2017
P-30
Pharmaceutical Science Analysis
Estimation of ART and LUM from fixed dose combination tablets
To determine the content of ART and LUM in tablets (Lumerax-40®, Label claim: 40mg. and 240mg.), 20 tablets were taken and the contents were weighed. An aliquot of powder equivalent to the weight of one tablet was accurately weighed and transferred to 50 ml volumetric flask and was dissolved in 25 ml of acetonitrile and volume was made up to the mark with acetonitrile. The flask was sonicated for 20 minutes to affect complete dissolution. The solution filtered through a 0.45µm millipore filter. A suitable aliquot of the filtered solution was transferred into a 100 ml volumetric flask and made up to the volume with the mobile phase to yield the concentration of 10µg/ml for ART and 60µg/ml for LUM. The experiments were performed six times under the optimized chromatographic conditions described prior. The peak areas were measured at 254nm and concentration in the sample was determined by comparing the area of sample with that of the standard.
Method validation Linearity
It is defined by the correlation coefficient, which must not be less than 0.99, using peak area responses. Linearity for single point standardization should extend to at least 20% beyond the specification range and include the target concentration. This was done by preparing Standard solutions containing 0.16mg/ml of ART and 1mg/ml of LUM was prepared, in triplicate. Aliquots of these solutions were diluted in mobile phase to six different concentrations, corresponding to 5, 10, 15, 20, 25, 30 µg/ml of ART and 60, 90, 120, 150, 180, 210 µg/ml of LUM. Calibration curves for concentration versus peak area were plotted for ART and LUM obtained data were subjected to regression analysis using the least squares method with a weighting factor of 1/x
Precision
Precision was determined as repeatability and intermediate precision, in accordance with ICH guidelines. The intra-day and inter-day precision were determined by analyzing the samples of ART and LUM at all concentration in linear range respectively. Determinations were performed with six replicates on the same day as well as on three consequent days. The ART and LUM concentrations were determined and the relative standard deviations (RSD) were calculated.
Accuracy
ART and LUM reference standards were accurately weighed and added to a mixture of the tablets excipients, at three different concentration levels (40, 60 and 80ug/ml of ART and 40, 60, 80 ug/ml of LUM). At each level, samples were prepared in triplicate and the recovery percentage was determined.
Specificity
Spectral purities of ART and LUM chromatographic peaks were evaluated using the UV spectra recorded by a UV detector. In addition, a solution containing a mixture of the tablet excipients was prepared using the sample preparation procedure and injected onto the chromatograph, to evaluate possible interfering peaks.
Robustness
Six sample solutions were prepared and analyzed under the established conditions and by variation of the following analytical parameters: flow rate of the mobile phase (0.8, 1.0 and 1.2ml/min), acetonitrile proportion in mobile phase (75:25, 65:35, 55:45), mobile phase pH (3, 3.5 and 4). The ART and LUM contents were determined for each condition and the obtained data were submitted for statistical analysis.
Detection and quantitation limits
Combined standard solutions were prepared by sequential dilutions and injected onto the chromatograph, at decreasing concentrations, in the range of 0.13–15µg/ml of ART and 0.10– 11.25µg/ml of LUM. The limit of detection was defined as the concentration for which a signal-to-noise ratio of 3 was obtained and, for quantitation limit; a signal-to-noise ratio of 10 was considered.
RESULTS AND DISCUSSION
Research Article ISSN 2250-0480 VOL 7/ ISSUE 3/JULY2017
P-31
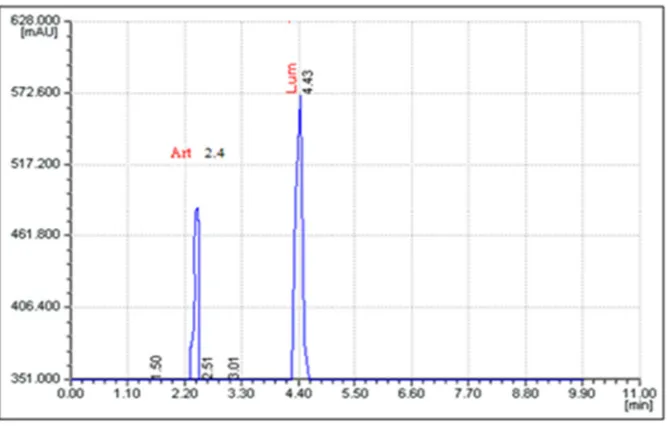
Pharmaceutical Science Analysis Figure 2
A Typical Chromatogram for ART And LUM
ART shows UV absorption only in the initial wavelengths of the spectrum (200–220 nm), due to the absence of chromophores in its structure. Nevertheless, the ART absorptivity is considerably low in this region, resulting in HPLC-UV methods with poor sensitivity. Hence, a RP HPLC method was developed by means of ART standard addition to the sample solutions. This approach allowed an adequate ART detection and consequently quantitation at 254 nm.
Validation Linearity
A linear correlation was found between the peak areas and the concentrations of ART and LUM, in the assayed range. The regression analysis data are presented in Table 1. The regression coefficients (r2) obtained were higher than 0.99 for both compounds, which attest the linearity of the method.
Table 1
Calibration Curve Data For ART And LUM
Regression Parameters ART LUM
Regression coefficient, r2 0.9963 0.9981
Slope ± standard error 159.6±0.2 6427.1± 3.15
Intercept ± standard error 3665.90±7.24 5122.8±5.68
Relative standard error (%) 0.52% 0.27%
Concentration range 5-30 60-210
Number of points 6 6
The values are Mean ± S.D. of triplicates
Precision
Mean contents of ART and LUM in the intraday precision analysis (n = 6) were 20ug/ml (R.S.D. = 1.75%) and 120ug/ml (R.S.D. = 1.35%), respectively. For the inter-day precision (n = 18), the mean contents obtained were 20ug/ml (R.S.D. = 1.45%) and 120ug/ml (R.S.D. = 1.47%) for ART and LUM, respectively. R.S.D. values lower than 2.0%, assure the precision of the method.
Accuracy
Research Article ISSN 2250-0480 VOL 7/ ISSUE 3/JULY2017
P-32
Pharmaceutical Science Analysis
Specificity
Peak purities higher than 99.0% were obtained for ART and LUM in the chromatograms of sample solutions, demonstrating that other compounds did not co-elute with the main peaks. The chromatogram obtained with the mixture of the tablet excipients showed no interfering peaks in the same retention time of ART and LUM.
Robustness
Statistical analysis showed no significant difference between results obtained employing the analytical conditions established for the method and those obtained in the experiments in which variations of some parameters were introduced. Thus, the method showed to be robust for changes in mobile phase flow rate from 1.1 to 1.5mL/min, acetonitrile: buffer proportion from (75:25, 65:35, 55:45), mobile phase pH (3, 3.5 and 4).
Detection and quantitation limits
According to the determined signal-to-noise ratio, ART and LUM presented limits of detection of 0.600-0.013µg/ml and limits of quantitation of 1.95- 0.05µg/ml, respectively where the compounds proportion found in the sample solutions injected onto the chromatograph. However, the objective of the method is the quantitation of ART and LUM, so that the values obtained for ART and LUM should be considered as the limit of method sensitivity.
System suitability tests:
To ensure the validity of the analytical procedure, a system suitability test was established. Data from ten injections of 20µl of the working standard solution containing 10µg/ml for ART and 60µg/ml for LUM were used for the evaluation of the system suitability parameters like tailing factor, the number of theoretical plates and retention time (Table 2).
Table 2
System Suitability Parameters.
Drug Name ART LUM
R.T. (min) 2.67 4.62 Resolution 1.35 3.74 Tailing factor 1.02 1.09 Theoretical Plates 4173.6 7652.3
Analysis of fixed dose combination tablets
Samples of fixed dose combination tablets Lumerax-40® containing 40mg of ART and 240mg LUM were analyzed using the validated method. The results obtained were presented in Table 3. All
the analyzed batches presented ART and LUM contents were very close to the labeled amount. The ART content in the tablets samples was 99.25 %, while LUM was 99.65%.
Table 3
Contents of ART and LUM in the Fixed Dose Combination Tablets
Branded Tablet Tablet formulation Label claim per tablet (mg) SD %RSD % Drug estimated
Lumerax-40® ART 40 0.33±0.02 1.45±0.12 99.25
LUM 240 1.52±0.16 1.46±0.08 99.65
The values are Mean ± S.D. of triplicates
The development of simple and reliable method is essential to assure the identification and quantitative determination of antimalarial drugs, since the problem of substandard antimalarial is well established all over the world. The use of these poor quality drugs might contribute to the development of plasmodium resistance in endemic areas due to the exposition to anti-infective sub therapeutic doses.16-18 The quality control of the antimalarial pharmaceutical preparations marketed
Research Article ISSN 2250-0480 VOL 7/ ISSUE 3/JULY2017
P-33
Pharmaceutical Science Analysis tablet dosage forms. The method can be
successfully used for routine analysis of ART and LUM in bulk drugs and pharmaceutical dosage forms.
CONCLUSION
The proposed RP-HPLC method is rapid, specific, accurate and precise for the quantification of ART and LUM from its tablet dosage form. The method has been found to be better, because of its wide range of linearity, use of readily available mobile phase, lack of extraction procedures. All these factors make this method suitable for quantification of ART and LUM in tablet dosage forms. The
method can be successfully used for routine analysis of ART and LUM in bulk drugs and pharmaceutical dosage forms.
ACKNOWLEDGEMENTS
The authors thank Ipca Laboratories, Mumbai, for providing Artemether and Lumefantrine as gift samples for this work.
CONFLICT OF INTEREST
Conflict of interest declared none.
REFERENCE
1. Guerin PJ, Olliaro P, Nosten F, Druilhe P, Laxminarayan R, Binka F, Kilama WL, Ford N, White NJ. Malaria: current status of control, diagnosis, treatment, and a proposed agenda for research and development. The Lancet infectious diseases. 2002 Sep 30;2(9):564-73.
2. Bhattarai A, Ali AS, Kachur SP, Mårtensson A, Abbas AK, Khatib R, Al-Mafazy AW, Ramsan M, Rotllant G, Gerstenmaier JF, Molteni F. Impact of artemisinin-based combination therapy and insecticide-treated nets on malaria burden in Zanzibar. PLoS Med. 2007 Nov 6;4(11):e309.
3. Omari AA, Gamble C, Garner P. Artemether‐ lumefantrine for uncomplicated malaria: a systematic review. Tropical Medicine & International Health. 2004 Feb 1;9(2):192-9. 4. Lefèvre G, Thomsen MS. Clinical
pharmacokinetics of artemether and lumefantrine (Riamet®). Clinical Drug Investigation. 1999 Dec 1;18(6):467-80.
5. Ezzet F, Mull R, Karbwang J. Population pharmacokinetics and therapeutic response of CGP 56697 (artemether+ benflumetol) in malaria patients. British journal of clinical pharmacology. 1998 Dec 1;46(6):553-61.
6. Delves M, Plouffe D, Scheurer C, Meister S, Wittlin S, Winzeler EA, Sinden RE, Leroy D. The activities of current antimalarial drugs on the life cycle stages of Plasmodium: a comparative study with human and rodent parasites. PLoS Med. 2012 Feb 21;9(2):e1001169.
7. Tripathi KD. Essentials of medical pharmacology. JP Medical Ltd; 2013 Sep 30
8. Khandave SS, Joshi SS, Sawant SV, Shahoo VO. Evaluation of bioequivalence and cardio-hepatic safety of a single dose of fixed dose combination of artemether and lumefantrine. Journal of Bioequivalence & Bioavailability. 2010;2(4):81-5.
9. Narayankar S, Phadke M, Patil D, Jadhav RK, Yamgar RS. Development of discriminating dissolution procedure for artemether and lumefantrine tablets. Der Pharma Chemica. 2010;2(5):494-9.
10.Arun R, Smith AA. Development of Analytical method for Lumefantrine by UV Spectrophotometry. Int. J. Res. Pharm. Sci. 2010;1(3):321-4.
11.da Costa César I, Nogueira FH, Pianetti GA. Simultaneous determination of artemether and lumefantrine in fixed dose combination tablets by HPLC with UV detection. Journal of Pharmaceutical and biomedical analysis. 2008 Nov 4;48(3):951-4.
12.Shrivastava A, Issarani R, Nagori BP. Stability indicating high-performance liquid chromatography method for the estimation of artemether in capsule dosage forms. Journal of Young Pharmacists. 2010 Jan 1;2(1):79-84. 13.Bate R, Tren R, Hess K, Attaran A. Physical and
chemical stability of expired fixed dose combination artemether-lumefantrine in uncontrolled tropical conditions. Malaria journal. 2009 Feb 25;8(1):33.
Research Article ISSN 2250-0480 VOL 7/ ISSUE 3/JULY2017
P-34
Pharmaceutical Science Analysis Asian Journal of Research in Chemistry.
2008;1(1):19-21.
15.Ich IC. Q2 (R1): Validation of analytical procedures: text and methodology. InInternational Conference on Harmonization, Geneva 2005.
16.Dhingra V, Rao KV, Narasu ML. Current status of artemisinin and its derivatives as antimalarial drugs. Life sciences. 1999 Dec 14;66(4):279-300.
17.Souppart C, Gauducheau N, Sandrenan N, Richard F. Development and validation of a high-performance liquid chromatography–mass
spectrometry assay for the determination of artemether and its metabolite dihydroartemisinin in human plasma. Journal of Chromatography B. 2002 Jul 15;774(2):195-203.