617
INVESTIGATING ADAPTIVE ASEAN CULTURAL
DIVERSITY THROUGH USERS’ MENTAL MODELS FOR
USER INTERFACE DESIGN
1ASLINA BAHARUM, 2AZIZAH JAAFAR
1
Institute of Visual Informatics, National University of Malaysia, MALAYSIA
2
Assoc. Prof., Institute of Visual Informatics, National University of Malaysia, MALAYSIA E-mail: [email protected], [email protected]
ABSTRACT
Nowadays, the Web has become the main gateway for organisations as well as making information accessible through the World Wide Web. Previous usability studies have focused on the development and user-centered design of websites. The location of objects through the use of a mental model is able to help users to navigate the Web and access information easily. The rationale for developing a mental model through an experimental study is to protect the high investment necessary for Web development through adaptive cultural diversity. The specific environment of a different country can inter-operate in the context of adaptation and needs to account for adaptive support in the context of collaborative activities. This study investigates cultural adaptivity with respect to ASEAN countries by identifying a mental model through the location of Web objects via a website user interface.
Almost half of the located Web objects are found to be consistent with previous studies that examined user expectations regarding the location of general websites, e-commerce websites and library websites. There were, however, diversities among the studies involving the location of various Web objects. In this study, another three Web object elements are included, namely, “Language”, “Content” and “Calendar”. It is of interest to note that the participants from all the geographical locations in the ASEAN countries included in this study had similar expectations for certain Web objects. It is therefore possible that the influence of multinational websites and cross-regional Web browsing has significantly shaped the website layout expectations of typical Web users.
Keywords: Adaptivity, Cultural Diversity, User Interface, Web Objects, Mental Model
1.
INTRODUCTIONWeb usability has emerged as one of the most important factors that determine the success of a website [1]. Usability studies conducted by van Welie et al. [2] showed that even if designers attempt to abide by Web guidelines and protocols, there are still many inherent problems to be faced. These problems were also found in various studies, including Nielsen [3], Rowland [4] and Seminerio [5], which showed that Web usability problems cost firms a great deal of money, and may even cause the loss of potential customers [1,6]. It is difficult to separate style from the actual guidelines and self-defined guidelines are often quite informal. A study by Fogg et al. [7] on library websites revealed that the design look was one of the key aspects in determining the credibility of a website. The study found that the design look was mentioned most frequently in user surveys. In addition, Shahizan
618 Therefore, this study aims to investigate users’ expectations of user interfaces for Web objects according to the individual mental model to enhance performance and user satisfaction.
This study uses a focus group of participants from ASEAN countries. The specific question raised is: “What is the ASEAN expectation for the location of Web objects on a website?” Knowing the answers to this question will enable Web developers to configure objects in layouts that closely meet regional expectations. It also enables the cultural expectations associated with the user experience to be identified, based on a comparison and evaluation of sites in different countries.
The objectives of this study are to: i) Identify the instrument to be used in identifying the locations of Web objects, ii) Identify the locations of commonly used Web objects among ASEAN users; iii) Create a layout of user interface based on the findings on the Web object locations. The findings of the study can guide designers to make design decisions that create an effective and sustainable user interface. This user interface is suitable for standardised user-centred websites or standardised organisational websites such as the websites of the IBM group, franchise companies (e.g., KFC, Domino’s Pizza), continental company groups, and car groups (e.g., BMW, Toyota). A culturally adaptive user interface may be represented by the culture-based user model layout elements of the selected Web objects. 1.1 Background of the Study
User interface extends beyond regional boundaries. It may use different languages and have diverse styles based on its cultural environment [9]. There are also the cultures of the designers and software engineers to be considered as well as the culture of the public users. In this respect, issues such as the most appropriate interface design will necessarily arise. Interface designers must be aware of the cultural diversity of users and similarly must be able to respond to this challenge. Only a few studies have considered how cultural diversities affect users’ expectations.
Previous research has shown that the cultural adaptivity approach to user interfaces is one of the determining factors for market success. Cultural adaptivity plays a key role in ensuring the effectiveness and acceptance of the user interface in the globalised IT industry. However, as the procedures involved in incorporating cultural diversities are time-consuming and expensive, the effort is often neglected. The application of this
approach is a good example of how technical support has increased both user satisfaction and performance [8].
Paramythis and Loidl-Reisinger [10] stated that different cultural environments could inter-operate in the context of adaptation. They suggested that a typical setup would need to involve a modelling environment based on the interaction of the user culture and history. By combining previous research findings, it is possible to make improvements to the existing model. This improved model can be implemented either fully or semi-automated, so that there will be no adjustment for further development without prior approval. This ensures a sustainable user interface. Only passive information and support adaptation should be considered in the context of cultural inter-operation activities and to ensure capability within such an environment.
1.2 Mental Model
Lim and Klein [11] explained that the concept of a mental model was originally proposed by Cannon-Bowers et al. [12]; the mental model building team evolved from prior theory and research in cognitive psychology on individual mental models. Rouse and Morris [13] defined mental models as “mechanisms whereby humans generate descriptions of the system and form, explanations of system functioning and observed system state, and forecast future system states”. Mental models of the organised knowledge framework allow individuals to describe, explain and predict behaviour [13-14]. Mental models determine the relevant content knowledge as well as the relationship between knowledge components [15]. Individual mental models (for example, a car, a disease, or processes such as child development) reflect the individual’s perception of reality [16]. Thus, mental models vary in terms of their accuracy and coherence [e.g., 17-18]. In addition, the mental model enhances the accuracy of predicting individual performance [e.g., 19-20].
619 accuracy of the mental models will affect how users interact with the site. Models that are more accurate are more successful in their interactions [22].
Various theories have been introduced to help researchers figure out the concept of a model in the context of human behaviour. People develop unconscious mental models to interact with the world in which they live. By studying mental models such as the order of objects [23], researchers are able to better understand how a person interacts with the environment. Johnson-Laird started this idea and used it to order things such as space objects [23]. Norman [14] and Payne [24] incorporated the idea into the study of human-computer interaction (HCI). HCI can be used to create interfaces and interaction methods that help people create a more accurate model of the mental system. In most studies, the mental model is deciphered based on the location of Web objects [9, 25-32].
According to Bernard [26], the main requirement when building website content is the understanding of a typical user’s mental model or schema for the location of elements or Web objects on the website interface. It is likely that the interface layout used by multi-regional and international websites influences the expectations of users [29]. In the layout of the e-commerce website, Bernard and Sheshadri [29] found that the site layout must correspond with users’ expectations about where they would find common Web objects. Their finding is consistent with previous studies on the general location of Web objects [e.g., 25-28]. In a study by Bernard [28], 76% of the participants had similar expectations about the location of e-commerce Web objects. Thus, it was suggested that users quickly develop the pattern of mental model or schema to fulfill their needs.
Adkisson [30] noted that studies related to the location of Web objects often correspond with some of the well-known e-commerce sites such as amazon.com, eddibaur.com and bestbay.com. Adkisson argued, however, that Bernard’s [28] study lacked the systematic analysis by which to determine how actual practices align with users’ expectations [30]. To determine the practice(s), Adkisson examined the location of certain Web objects in e-commerce sites. The results corroborated the findings of Bernard [28]. A similar study was undertaken in Portugal by Costa [9]; the results were found to be not significantly different from Bernard and Sheshadri’s [29].
1.3 Cultural Adaptivity
A larger diverse group of users has recently begun to regularly access the Internet, resulting in the need for multinational cross-cultural websites [33]. Hence, in the cultural adaptivity approach, the influence of culture on the user interface preferences of each user is stored in a personal user mental model, and mapped to the user interface adaptations. Research provides evidence of cultural differences on the Web [34], especially with regard to content [35], perceived usability, satisfaction and user trust [36]. It has also been suggested that “language, culture, religion, and other factors may be important to a user’s impression of the website” [37]. There are, however, only a limited number of studies that have linked the effectiveness and user-friendliness of a website with cultural background. So far, studies on a particular culture and website usability have focused on comparisons between two distinct national cultures such as the United States and Japan [34] or the United States and Korea [38]. Those authors found language and culture to be the reasons for major diversities in the design features of websites. Hillier [39] suggested a review of the context of language, culture and usability of websites comparing Western and Eastern cultures [40].
620 cognitive structures, social and behavioural patterns, trust, thoughts, actions, emotions at the individual level, structures and rituals at the organisational level, and artifacts and attributes at the societal or national level [52]. Culture refers to the patterns of behaviour that guide the actions of the members of that culture [53]. Although the concept of culture is quite complicated, there are a number of theories that focus on some aspects or dimensions of culture [54]. The motivation for seeking standardisation in cultural adaptivity is directly linked to website development costs and the sustainability of the user interface [55]. Theoretically, cultural adaptivity reduces the high investment that ensures it is not bound by proprietary formats. This is a prerequisite for the new environment. Therefore, the knowledge of users’ mental models in relation to the location of website objects is required to improve accessibility.
In this paper, cultural diversity is represented by country diversity. This study examines the differences and preferences of participants from ten ASEAN countries, namely: Brunei, Cambodia, Indonesia, Laos PDR, Malaysia, Myanmar, the Philippines, Singapore, Thailand and Vietnam.
This study investigates whether different regional cultures at the country level in any way influence users to form a mental model for the location of the Web object on a website. For designers, this should assist in enhancing site access and overall appeal. 1.4 Research Scope and Limitation
This study aims to assist designers in making design decisions that will lead to an effective user interface layout. In order to achieve that, the research concentrates on the following:
i. The focus group participants are from ASEAN; the countries involved are Brunei, Cambodia, Indonesia, Laos PDR, Malaysia, Myanmar, the Philippines, Singapore, Thailand and Vietnam. ii. The study emphasises the layout of objects in
theWeb user interface. The study was limited to ten commonly used objects among the users.
2.
METHODOLOGYA survey was conducted among participants from ten ASEAN countries who fulfilled the study’s requirements. If the participants experienced problems with the instrument used in the survey or their feedback was not clear, the participants were communicated with directly, through a phone call or email. This method and
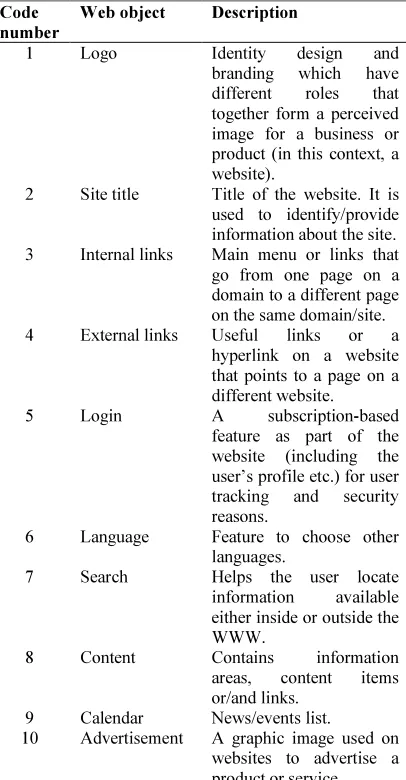
[image:4.595.305.508.344.734.2]procedures were adapted from Bernard and Sheshadri [29]. This study identified ten common Web objects as listed in Table 1. An instrument, in the form of a data sheet of six horizontal by seven vertical grid squares (as shown later in Figure 2) was designed and developed. The instrument was adapted from previous studies that collected data from general websites [25-27,31], e-commerce websites [9,28-30] and library websites [32]. Web objects that are common to most websites were assessed. As well as the Web objects found in the literature, another three Web objects were added in order to suit the new century’s requirements and needs. These three additional Web objects were “Language”, “Content”, and “Calendar”. This additional was made due to the importance of these Web objects for cross-country purposes in line with current technology and information attributes.
Table 1: Operational definitions of Web objects
Code number
Web object Description
1 Logo Identity design and branding which have different roles that together form a perceived image for a business or product (in this context, a website).
2 Site title Title of the website. It is used to identify/provide information about the site. 3 Internal links Main menu or links that go from one page on a domain to a different page on the same domain/site. 4 External links Useful links or a
hyperlink on a website that points to a page on a different website. 5 Login A subscription-based
feature as part of the website (including the user’s profile etc.) for user tracking and security reasons.
6 Language Feature to choose other languages.
7 Search Helps the user locate information available either inside or outside the WWW.
8 Content Contains information areas, content items or/and links.
9 Calendar News/events list.
621 2.1 Participants
The participants were from ten ASEAN countries (Brunei, Cambodia, Indonesia, Lao PDR, Malaysia, Myanmar, the Philippines, Singapore, Thailand and Vietnam) (Figure 1). For the preliminary study, a total of 50 participants consisting of 36 males and 14 females completed a survey, in both online and offline forms, on the expected location of each of the ten Web objects. The participants were divided into two levels: IT personnel, and general users. The first group consisted of IT personnel users. In the Web development phase, the cultures of the designers and software engineers have to be considered as well as the cultures of the public users. In addition, this group was included because this study also sought to develop guidance for designers in making design decisions that can lead to a more useful user interface. The second group of general users was randomly selected from among normal general Internet users. Sixty-eight percent of the participants were above the age of 30 and 88% indicated that they used the computer daily. All the participants used English as either their first or second language. This indicated that they were familiar with English language websites. The majority of participants (92%) reported that they were engaged in either computing or science fields. Only 8% of the participants were involved in other areas such as business, law, marketing and banking. The criteria for the selection of the participants included the following: (1) Participants must be resident in or have stayed for more years in ASEAN countries than in other country/countries, and (2) Participants must have computer literacy and at least be familiar with websites. To prevent bias, the participants were asked which local and international websites they visited most frequently.
Figure1: Distribution Of Participants From Different Countries
2.2 Procedure
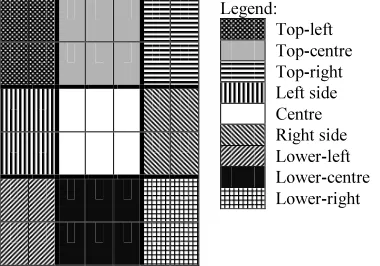
The participants were presented with a demographic questionnaire followed by the developed instrument, which is a depiction of a Web browser window. A mock browser window,
consisting of six horizontal and seven vertical grid squares with a white background was used to represent the interface of a browser window (as shown in Figure 2).
The participants then completed the survey (either an online or offline survey) to examine their mental model regarding the location of each Web objects selected. The survey asked the participants to place each Web object in the mock browser, using the code numbers (Table 1) and grid squares given as decrypted in Figure 2. The code numbers could be placed horizontally, vertically or overlap. The percentage was accomplished by simply adding the frequency of same code number that was selected in each square for each Web object and then dividing this number by the total number of times the particular code number was placed on the entire browser grid.
[image:5.595.305.495.341.474.2]Legend: Top-left Top-centre Top-right Left side Centre Right side Lower-left Lower-centre Lower-right
Figure 2: Mock Browser Window (Showing Description Of Nine Grid Squares)
[image:5.595.97.298.559.653.2]The code numbers could be added to by placing more than one in the grid square, depending on which Web object they represented. This was in order to approximate their actual size on a website. For example, “Site title” could occupy four or more/less squares, “Advertisement” could occupy three squares, while the “Internal links” and “External links” objects could occupy two squares, and “Logo”, “Login”, “Language” and “Search” objects could occupy one square, depending on each participant’s preferences. The participants were numbered based on the code number per each Web object.
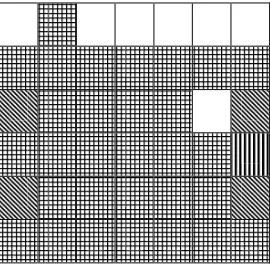
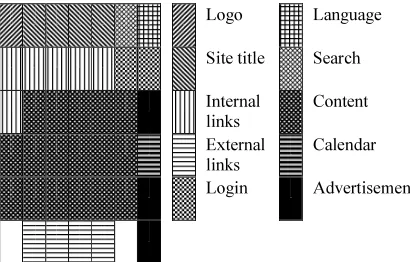
Figure 3 depicts the grid distribution representing an area when choosing the grid square for the object location. The percentages are represented by patterns as depicted in Figure 4 to Figure 13.
<10% 11%-20% 21%-30% 31%-40% 41%>
622 3. RESULTS
The results of the study were categorised based on the percentages of each grid’s selection for each Web object (Figure 3). Each pattern represents a specific range of percentages for the number of times each square was selected as a location for a particular Web object. Each pattern indicates, in terms of percentages, the number of times a particular square was selected by the participants.
The demographic makeup of the total number of participants was as follows: 24% resided in Malaysia, 18% in Indonesia, 14% in the Philippines and the rest in Singapore, Vietnam, Myanmar, Cambodia, Lao PDR, Brunei and Thailand (Figure 1). Unfortunately, the lack of participants from Thailand did not permit a separate layout expectation analysis for representatives from ASEAN countries. As the number of participants in this study increases in the future, a breakdown of the layout expectations for each respective country will be possible. Nevertheless, as seen in the results presented in the figures given below, the participants in all the countries studied here had distinct mental models for the location of the examined Web objects.
3.1 Logo
[image:6.595.331.476.187.333.2]It can be seen from the result presented in Figure 4 that 70% of the participants expected the “Logo” link to be in the top-left corner of the website, while 1% expected it to be in the top-left area.
Figure 4: Logo
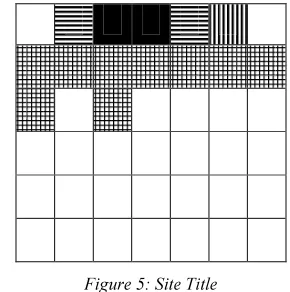
3.2 Site Title
As illustrated in Figure 5, 63% of the participants expected the “Site title” to be located at the top-centre of the website. The participants were given the option of using one or more squares and, accordingly, 43% used more than one square for this Web object. Atzl [56] stated that a clear title
that better conveys the identity of the website to the user should be offered. He further clarified that the page title/site title must accurately reflect the page contents; otherwise, it will confuse users and make it extremely difficult for them to navigate the site.
Figure 5: Site Title
3.3 Internal links
[image:6.595.337.475.422.571.2]As shown in Figure 6, 56% of the participants expected the “Internal links” to be located at the top-left to top-centre of the website. The location of “Internal links” is likely to be affected by the increased use of technology at the back-end.
Figure 6: Internal Links
3.4 External Links
[image:6.595.121.257.499.649.2]623
Figure 7: External Links
3.5 Login
[image:7.595.337.476.361.501.2]As can be seen in Figure 8, 45% of the participants expected the “Login” to be located at the top-right side of the website. This location is commonly used because it is believed that this is the area where the first glance is directed when viewing a website. Observations on several categories of websites reveal that the “Login” object is usually located in a visible interface area, even though the expected location for this particular object is similar to that used by popular sites such as Yahoo and Google.
Figure 8: Login
3.6 Language
It can be seen in Figure 9 that 74% of the participants expected the “Language” object to be located at the top-right corner of the website, which is a fairly common location in other websites. Based on HCI design, Cullata [57] suggested adding a “Language” selection on the main page to improve accessibility and navigation.
Figure 9: Language
3.7 Search
As seen in Figure 10, 40% of the participants expected the “Search” object to be located at the top-right of the website. The expectation probably occurs because most search engine sites place their search field at the top-right portion of the website.
Figure 10: Search
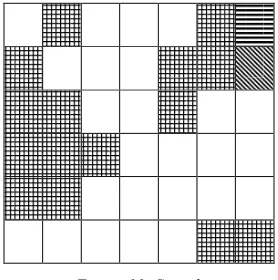
3.8 Content
[image:7.595.119.257.429.564.2]624
Figure 11: Content
3.9 Calendar
[image:8.595.122.257.350.483.2]As seen in Figure 12, 26% of the participants expected the “Calendar” object to be located at the right side of the website. This location is similar to the screen layout of many online websites.
Figure 12: Calendar
3.10 Advertisement
Figure 13 shows that 52% of the participants chose the right to lower-right side of the website for the location of the “Advertisement” object. The format, content and location of banner advertisements have been continually changing in Web design, due to the need to capture the user’s attention and as a reaction to users’ “banner blindness” [60]. A study by Benway and Lane [61] showed that banner advertisements are effective. Spool et al. [62] conducted usability tests and found that users turned to navigation bars after determining that the page did not contain the information they needed. At that point, the user tended to scroll to the top or bottom of the page.
Users tend to begin viewing a page at the centre. If what they want is not located in the centre, they then proceed to examine the top and bottom of the page. Therefore, it is not advisable to place the
important items at the top, since the user may often look there last.
Figure 13: Advertisement
4. DISCUSSION
This study revealed that the users’ expectations of the placement of Web objects, namely, the “Logo”, “Site title”, “Internal links”, “External links”, “Login”, “Search”, and “Advertisement”, corroborates with the results of previous studies for general websites [25-27, 31], e-commerce websites [30], and library websites [32]. The results for “Internal links”, “External links”, “Login”, “Search” and “Advertisement”, however, contrasted with the findings of Bernard [28], Shaikh and Lenz [31], Bernard and Sheshadri [29] and Costa [9]. In part, this could be due to the fact that some of those studies [9,28] were conducted in only one country and, accordingly, did not compare the expectations of users from individual countries [29] (refer to Table 3). Three Web objects were newly added in the present study, as explained above.
If this consistency holds true over time, then the need to localise the user interface for specific regions will be less important, provided that the users from those regions are expert in the medium and have a cultural background that enables them to communicate with people from other cultures and understand them. This study can then form the mental model on the location of Web objects by adapting cultural diversity. The results of the study are summarised in Table 3 and Figure 14.
625 needs of each individual user. Further, the results of their study indicated that providing the right information to the right person at the right time is one of the main factors contributing to the success of Web applications.
Logo Language
Site title Search
Internal links
Content
External links
Calendar
[image:9.595.88.293.187.318.2]Login Advertisement
Figure 14: Combined Expectations
In the present study, there was a general consensus among the participants regarding the location of most of the objects. It is certainly probable, then, that placing these objects in those particular locations would give a website a competitive edge over sites that do not do so [9]. It must be cautioned, however, that well-established sites may already have their own conventions, and thus, visitors to those sites must expect to find the objects at other locations.
In addition, it is recommended that user expectations about the locations of Web objects should be reviewed every four years (or more frequently), based on the idea of Shaikh and Lenz [31] that users’ schemas might change to keep up with advances in technology. As technology changes the face of the Internet, users’ expectations seem to shift as well. The changes over the past few years have not been dramatic but reflect updates in technology and advertising schemes. With the advances in technology in future, all the evidence indicates that the layout of websites will continue to evolve to take advantage of technology, such as technology that allows for faster downloads and more relevant content [47].
5. CONCLUSION
Cross-cultural analysis and design issues need to be integrated at the planning stage, and developers should use checklists and guidelines to assist them in the respective phases. As more cultural analysis of user-interfaces occurs, assumptions about usability, aesthetics and emotional experience
based on previous paradigms that were culturally biased will change. It is interesting to note that participants from the ASEAN countries in the present study had similar expectations of certain Web objects. It is highly possible that the influence of multi-regional and multinational websites has significantly shaped the expectations of Web users. Based on the results, more than 55% of the participants from ASEAN countries had similar expectations about the location of the studied Web objects. It is therefore possible, by adapting cultural diversity, to form the mental model on the location of Web objects and shape the website layout, as shown in Figure 14. By using the cultural adaptivity approach, the objectives outlined in the introduction to this paper are achieved and the findings may enhance the ability of the user interface to attract large numbers of diverse users. The analysis of the results is still in the preliminary stages. As more data are gathered, Web developers will be able to design websites that facilitate the easy navigation and retrieval of information among a wide range of users.
Although these findings are promising with respect to the users’ expectations, some limitations of this study need to be acknowledged. This study focused on user interface in the context of using conventional technology to access websites. Thus, future research should look into the user interface in mobile technology, as the users’ expectations about the location of Web objects might be different in those applications. This example of the present study may inspire others to undertake similar analysis and design efforts. Further analysis of culture or on mobile technology and other dimensions, as well as more detailed measurements, may yield further insights and more specific design recommendations in the future.
REFRENCES:
[1] H. Shahizan and F. Li, “Utilising IGV Approach to Identify Factors Affecting Web Usability”, Journal of Information and Communication Technology (JICT), Vol. 2, No. 2, 2003, pp. 25-40.
[2] V.W. Martin, C.V.D.V. Gerrit and A. Eliëns, “Breaking Down Usability”, 2010, retrieved from
http://www.welie.com/papers/Interact99.pdf [3] J. Nielson and M. Tahir, “Homepage Usability:
http://www.aallnet.org/main-626 menu/Publications/spectrum/Archives/Vol-11/pub_sp0612/pub-sp0612-prodev.pdf
[4] C. Rowland, “Usability matters: What’s usability”, Webreview.com, 2000, Retrieved Feb 6, 2001, from
www.webreview.com/pub/2000/03/10/feature/i ndex3.html
[5] M. Seminerio, “Study: One in three experienced surfers find online shopping difficult”, ZDNet, 1998, Retrieved June 7, 2000, from http://www.zdnet.com/intweek/quickpoll/981 007/981007b.html
[6] G. Lindgaard and C. Dudek, “What Is This Evasive Beast We Call User Satisfaction?” Interaction Computer 15, 3, 2003, pp. 429–452. [7] B.J. Fogg, L. Marable, J. Stanford and E.R.
Tauber, “How Do People Evaluate a Website’s Credibility? Result from a Large Study”, 2002, Retrieved from
http://www.consumerwebwatch.org/pdfs/stanfor dptl.pdf.
[8] K. Reinecke and A. Bernstein, “Improving Performance, Perceived Usability, and Aesthetics With Culturally Adaptive User Interfaces”, ACM Transactions on Computer-Human Interaction, Vol. 18, No. 2, Article 8, 2011, pp. 8:1-8:29.
[9] C. Costa, “Cultural Factors and Usability User Expectations for the Location of E-Commerce Web Objects Case Study in Portugal”, 2010. [10] A. Paramythis and S. Loidl-Reisinger,
“Adaptive Learning Environments and E-Learning Standards”, In R. Williams (Ed.), Proceedings of The 2nd European Conference On E-Learning (Ecel2003), Glasgow, Scotland, 2003, pp. 369-379.
[11] B.C. Lim and K.J. Klein, “Team mental models and team performance: A field study of the effects of team mental model similarity and accuracy”, Published online in Wiley Inter Science (www.interscience.wiley.com), Journal of Organizational Behavior 27, 2006, pp. 403– 418.
[12] J.A. Cannon-Bowers, E. Salas and S.A. Converse, “Cognitive psychology and team training: Shared mental Models In Complex Systems”, Human Factors Bulletin, 33, 1990, pp. 1–4.
[13] W.B. Rouse and N.M. Morris, “On looking into the black box: Prospects and limits in the search for mental models”, Psychological Bulletin, 100, 1986, pp. 349–363.
[14] D.A. Norman, “Some observations on mental models, In D. Gentner and A.L. Stevens (Eds.), Mental models. Hillsdale, NJ: Erlbaum, 1983, pp. 7–14.
[15] S.S. Webber, G. Chen, S.C. Payne, S.M. Marsh and S.J. Zaccaro, “Enhancing team mental model measurement with performance appraisal practices”, Organizational Research Methods, 3, 2000, pp. 307–322.
[16] E. Brunswik, “Perception and the representative design of psychological experiments”, Berkeley, CA: University of California Press, 1956.
[17] K.B. McKeithen, J.S. Reitman, H.H. Rueter and S.C. Hirtle, “Knowledge organization and skill differences in computer programmers”, Cognitive Psychology, 13, 1981, pp. 307–325. [18] J.R. Rentsch and R.J. Hall, “Members of great
teams think alike: A model of team effectiveness and schema similarity among team members”, In Advances in interdisciplinary studies of work teams: Theories of self-managing work teams, 1, 1994, pp. 223–261. [19] K.Kraiger, E. Salas and J.A. Cannon-Bowers,
“Measuring knowledge organization as a method for assessing learning during training”, Human Factors, 37, 1995, pp. 804–816.
[20] A.L. Rowe and N.J. Cooke, “Measuring mental models: Choosing the right tools for the job”, Human Resource Development Quarterly, 6(3), 1995, pp. 243–255.
[21] S. McDaniel, “What's your idea of a mental model?” Technical report, 2003.
[22] M.J. Smith and S. Gavriel, “Cross-Cultural User Interface Design”, Eds., Proceedings, Vol. 2, Human-Computer Interface Internet, (HCI) Conference, New Orleans, LA, USA, 2001, pp. 502-505.
[23] P.N. Johnson-Laird, V. Girotto and P. Legrenzi, “Mental models: a gentle guide for outsiders”, 1998, Retrieved from
http://www.si.umich.edu/ICOS/gentleintro.html [24] S. Payne, “A descriptive study of mental
models”, Behavior and Information
Technology, 10(1), 1991, pp. 3-21.
[25] M. Bernard, “Examining user expectations of the location of web objects”, ITG Internetworking 3.3 [Online], 2000, Retrieved from
http://www.internettg.org/newsletter/dec00/artic le_bernard.html
627 News, 3.1, 2001a, Retrieved from http://chnm.gmu.edu/digitalhistory/links/pdf/ch apter4/4.26b.pdf
[27] M. Bernard, “User Expectations for the Location of Web Objects”, Chi’01 Extended Abstracts On Human Factors In Computer Systems, 2001b, pp. 171, Retrieved from http://psychology.wichita.edu/hci/projects/CHI %20web%20objects.pdf.
[28] M. Bernard, “Examining User Expectations for the Location of Common E-Commerce Web Objects”, Usability News, 4(1), 2002,
Retrieved December 16, 2009,
fromhttp://www.surl.org/usabilitynews/41/web _object-ecom.asp.
[29] M. Bernard and A. Sheshadri, “Preliminary Examination of Global Expectations of Users’ Mental Models for E-Commerce Web Layouts”, Usability News, 6(2), 2004, Retrieved From
http://www.surl.org/usabilitynews/62/web_obj ect_international.asp.
[30] H. Adkisson, “Identifying De-Facto Standards For E-Commerce Web Sites”, (Unpublished Master Thesis), University Of Washington, Washington: US, 2002.
[31] A.D. Shaikh and K. Lenz, “Where’s The Search? Re-Examining User Expectations Of Web Objects”, Usability News, 8(1), 2006, Retrieved From
http://www.surl.org/usabilitynews/81/webobje cts.asp
[32] R.N. Vasantha and N.S. Harinarayana, “Identifying the Location of Web Objects: A Study of Library Websites”, 8th International Caliber - 2011, Goa University, Goa, Paper presented at 8th International Caliber, 2011, pp. 28-39.
[33] L. Rosenfield and P. Morville, “Information Architecture for The World Wide Web”, 2nd.Ed., Beijing: O’Reilly Media, 2002, pp. 496.
[34] N. Singh and H. Matsuo, “Measuring Cultural Adaptation on The Web: A Content Analytic Study Of U.S. and Japanese Web Sites”, Journal Of Business Research, 57 (8), 2004, pp. 864-872.
[35] S.S. Robbins and A.C. Stylianou, “Global Corporate Web Sites: An Empirical Investigation of Content and Design”. Information and Management, 40 (3), 2003, pp. 205-212.
[36] C. Flavián, M. Guinalíu and R. Gurrea, “The Role Played by Perceived Usability, Satisfaction and Consumer Trust on Website
Loyalty”, Information and Management, 43, 2006, pp. 1-14.
[37] J. Van Iwaarden, T. Van Der Wiele, L. Ball and R. Millen, “Perceptions about the Quality of Web Sites: A Survey Amongst Students At Northeastern University And Erasmus University”, Information and Management, 41 (8), 2004, pp. 947-959.
[38] J. Choi and L.V. Geistfeld, “A Cross-Cultural Investigation of Consumer Shopping Adoption”, Journal of Economic Psychology, 25 (6), 2004, pp. 821-838.
[39] M. Hillier, “Multilingual Website Usability: Cultural Context”, Proceedings Of The International Conference On Electronic Commerce 2002, 22-25 October, Hong Kong, China, 2002.
[40] B. Aslina and J. Azizah, “Cultural Adaptivity for Sustainable User Interface: Investigating User Expectation on ASEAN Countries”, Proceeding of The International Conference on Future Trends in Computing and Communication Engineering (FTCC), 2013, pp. 45-49.
[41] A. Marcus and E. W. Gould, “Crosscurrents Cultural Dimensions and Global Web User-Interface Design”, 2000, pp. 32–46.
[42] W. Barber and A. Badre, “Culturability: The Merging Of Culture And Usability”, Presented at The Conference On Human Factors and The Web, Basking Ridge, New Jersey: AT&T
Labs. Retrieved 1998,
fromhttp://zing.ncsl.nist.gov/hfweb/att4/procee dings/barber/
[43] E. Callahan, “Cultural Similarities and Differences in the Design of University Websites”, Journal of Computer-Mediated Communication 11, 1, 2005.
[44] B. Corbitt, T. Thanasankit and J. Haynes, “A Model for Culturally Informed Web Interfaces”, In Internet Management Issues: A Global Perspective, IGI Global, 2002, pp. 1– 26.
[45] A. Badre, “The Effects Of Cross Cultural Interface Design Orientation On World Wide Web User Performance”, GVU Tech Reports 2000,Retrieved from
http://www.cc.gatech.edu/gvu/reports/2001/ [46] G. Ford and H. Gelderblom, “The Effects of
Culture on Performance Achieved Through the Use of Human Computer Interaction” In Proceedings of The Conference on Enablement Through Technology, 2003. [47] B. Aslina and J. Azizah, “Users’ Expectation
628 ASEAN Countries”, Advances In Visual Informatics - Third International Visual Informatics Conference, IVIC 2013, Selangor,
Malaysia, November 13-15, 2013.
Proceedings. Springer 2013 Lecture Notes In Computer Science ISBN 978-3-319-02957-3, 2013, pp. 383-395.
[48] J. Noiwan and A.F. Norcio, “Cultural Differences on Attention and Perceived Usability: Investigating Color Combinations of
Animated Graphics”, Human-Computer
Studies (64), 2006, pp. 103-122.
[49] N. Tractinsky, “Aesthetics and Apparent Usability: Empirically Assessing Cultural and Methodological Issues”, Paper Presented at The Conference On Human Factors In Computing System. Chi’ 97. Atlanta, Georgia, 1997.
[50] J. Dong and G. Salvendy, “Designing Menus For The Chinese Population: Horizontal Or Vertical? Behaviour and Information Technology”, 18 (6), 1999, pp. 467-471. [51] G. Hofstede, “Cultures and Organizations:
Software of the Mind, Intercultural Cooperation and Its Importance for Survival”, McGraw-Hill, New York, 1997.
[52] S. Komin, “Psychology of The Thai People: Values and Behavioral Patterns, Magenta”, Bangkok, 1991.
[53] C. Geertz, “The Interpretation of Cultures: Selected Essays”, Basic Books, New York, 1973.
[54] G. Hofstede, “Culture’s Consequences: Comparing Values, Behaviors, Institutions, and Organizations Across Nations, Thousand Oaks”, SAGE, 2001.
[55] O. Conlan, V. Wade, C. Bruenand M. Gargan, “Multi-Model, Metadata- Driven Approach To
Adaptive Hypermedia Services For
Personalized E-Learning In De Bra”, P., Brusilovsky, P. and Conejo, R. (Eds.), Proceedings of Second International Conference On Adaptive Hypermedia And Adaptive Web-Based Systems (Ah'2002), Málaga, Spain, 2002, pp. 100-111.
[56] A. Atzl, “What Is UI Design, And Why Does It Matter?”, Singlebrook Technology, 2012, Retrieved from
http://singlebrook.com/blog/what-is-ui-design-and-why-does-it-matter.
[57] R. Cullata, “Instructional Design, Developer of The Instructional Design Website”, HCI Design Journal, 2011, Retrieved from http://www.instructionaldesign.org/
[58] C. Chapman, “10 Usability Tips Based on Research Studies”, 2010, Retrieved from http://sixrevisions.com/Usabilityaccessibility/1 0-Usability-Tips-Based-On-Research-Studies/. [59] J. Nielsen, “F-Shaped Pattern for Reading Web
Content”, Jakob Nielsen’s Alertbox, 2006,Retrieved from
http://www.useit.com/alertbox/reading_pattern .html
[60] J. Nielsen, “Banner Blindness: Old And New Findings”, Retrieved April 11, 2011 From Jakob Nielsen’s Alertbox, 2007, Retrieved fromhttp://www.useit.com/alertbox/banner-blindness.html
[61] J.P. Benway and D.M. Lane, “Banner Blindness: Web Searchers Often Miss ‘Obvious’ Links”, ITG Newsletter 1.3, 1998,
pp. 1–10, Retrieved
fromhttp://www.sandia.gov/itg/newsletter/dec 98/banner_blindness.html.
[62] J.M. Spool, T. Scanlon, W. Schroeder, C. Snyder and T. Deangelo, “Web Site Usability: A Designer's Guide”, Morgan Kaufmann Publishers, 1997.
[63] K. Sakulwong and T. Sunetnanta, “Active View Agents for Personalized E-Commerce Applications”, Journal of Information And Communication Technology (JCIT), Vol. 2. No. 1, 2003, pp. 1-14.
AUTHORPROFILES:
B. Aslina received a degree in E-Commerce from Sabah University of Malaysia in 2003. She obtained a Master’s degree in Information Technology from MARA University of Technology in 2010. Currently, she is a Doctor of Philosophy candidate at the Institute of Visual Informatics, National University of Malaysia (UKM). Her research interests are in multimedia, HCI and Web user interface design.
629
Table 3: Results From Participants’ Expectations
No. Web objects Location % Selected Similar result Different result
1. Logo Top-left 70% Adkisson [30] - 2. Site title Top-centre 63% Bernard [27] - 3. Internal links Top-left to
top-centre
56% Bernard [25-27] Bernard and Sheshadri [29], Shaikh and Lenz [31] – left
4. External links Lower-left to Lower-centre
53% Bernard [25-27] Bernard and Sheshadri [29] – left and right
5. Login Top-right 45% Adkisson [30] Bernard [28]; Costa [9] – top-left
6. Language Top-right 74% - -
7. Search Top-right 40% Shaikh and Lenz [31], Vasantha and Harinarayana [32]
Bernard [25-27], Costa [9] - top-centre; Bernard [28]; Adkisson [30] – top or left
8. Content Left and Lower to centre
75% - -
9. Calendar Right 26% - -
10. Advertisement Right to Lower-right
52% Shaikh and Lenz [31]