BIOANALYTICAL METHOD DEVELOPMENT, VALIDATION AND
QUANTIFICATION OF BOSENTAN BY HIGH-PERFORMANCE
LIQUID CHROMATOGRAPHY IN RAT PLASMA
Nallakumar P.*1 and Siva Kumar R.2
1
Department of Pharmaceutical Analysis, Sri Venkateshwara College of Pharmacy and
Research Centre, Madhapur, Hyderabad - 500081, India.
2
Department of Pharmaceutical Analysis, Geethanjali College of Pharmacy, Cheeryal Vill,
Keesara Mdl, RR Dist. India.
ABSTRACT
A Simple and rapid bioanalytical high performance liquid
chromatographic (HPLC) method for the determination of Bosentan
using Losertan as an internal standard was developed and validated as
per regulatory requirements. Sample preparation was accomplished
through liquid phase extraction and chromatographic separation on a
reverse phase column. The mobile phase consists of mixture of
methanol and water in the ratio of 50:50 at a flow rate of 1ml/min. The
wavelength used for the detection of bosentan was 225nm with a total
run time of 6minutes. The retention times of bosentan and losertan
were found to be 2 and 4 respectively. The method was developed and
tested for the linearity range of 250-750ng/ml. The method was
validated for accuracy, precision, linearity and recovery in compliance
to international regulatory guidelines.
KEYWORDS: Bosten, HPLC, Validation.
Abbreviations: CV: Coeicient Variation; HPLC: High Performance Liquid Chromatography;
IS: Internal Standard; LC: Liquid Chromatography; LLOQ: Lower Limit of Quantitation;
LQC: Low Quality Control; MQC: Medium Quality Control; HQC: High Quality Control;
PK: Pharmacokinetics; QC: Quality Control; RP: Reverse Phase, UV: Ultraviolet
spectrophotometry; Cmax: he maximum plasma concentration of the drug.
Volume 6, Issue 10, 603-615. Research Article ISSN 2277– 7105
*Corresponding Author Nallakumar P.
Department of
Pharmaceutical Analysis, Sri
Venkateshwara College of
Pharmacy and Research
Centre, Madhapur,
Hyderabad - 500081, India. Article Received on
01 July 2017,
Revised on 22 July 2017, Accepted on 12 August 2017
INTRODUCTION
Bosentan,
4-t-butyl-N-(6-(2-hydroxyethoxy)-5-(2-methoxyphenoxy)-2,2-bipyrimidin-4-yl)benzenesulfonamide, is a endothelian receptor antagonist used in the treatment of
pulmonary artery hypertension. Bosentan is available in the tablet dosage form. Hypertension
also known as high blood pressure is a long term medical condition in which the blood
pressure in the arteries is persistently elevated. High blood pressure usually does not cause
symptoms. Endothelins are peptides that constrict blood vessels and raise blood pressure.
They are normally kept in balance by other mechanisms, but when they are over-expressed,
they contribute to high blood pressure (hypertension) and heart disease.
Endothelins are 21-amino acid vasoconstricting peptides produced primarily in
the endothelium having a key role in vascular homeostasis. Endothelins are implicated in
vascular diseases of several organ systems, including the heart, general circulation and brain.
Literature survey has revealed that there only few methods were reported for the
determination of BOSENTAN in plasma by liquid chromatography. Methods reported in the
literature for the estimation of bosentan in bulk and biological fluids include A rapid
high-performance liquid chromatographic bioanalytical method development and validation for
Bosantan in human plasma by taking 70% ammonium acetate & 30% acetonitrile as a mobile
phase and Phenomenex luna C18 as column at 5.7-7.8mins as retention time. Development,
estimation and validation of Bosentan in bulk and in its pharmaceutical formulation by
UV-Vis Spectroscopic method using Methanol:Water as mobile phase.
From the literature survey, Various analytical method developments have been reported for
the estimation of bosentan by RP-HPLC and UV-methods. Here an attempt was made to
develop the bio-analytical method for the estimation of bosentan from plasma using losertan
as internal standard and to validate as per international regulatory guidelines. Runtime was
decreased while developing the method.
MATERIALS AND METHODS
Chemicals and reagents
Bosentan (Figure 1) of the highest quality has been purchased from sigma Aldrich (Mumbai,
India) and Losertan (Internal Standard) (Figure 1) was kindly donated by Torrent
from Merck chemicals (Bangalore, India). Potassium dihydrogen phosphate (AR Grade),
Dipotassium hydrogen phosphate (AR Grade).
Chemicals Make
water HPLC grade
Acetonitrile Merck(HPLC grade)
Methanol Merck(HPLC grade)
Potassium dihydrgen phosphate AR grade Dipotassium hydrogen phosphate AR grade
Instrumentation
RP-HPLC analysis was performed on Applied Biosystems is enhanced by the high degree of
automation and data processing capabilities of Analyst sotware supplied by Labindia
Instrument Pvt. Ltd. (Gurgaon, India). he LC part consists of Shimadzu auto sampler LC-10
series chromatographic system (Shimadzu Corporation, Kyoto, Japan) equipped with dual
pump (LC10AT-VP). The column oven employed (CTO-10AS VP) and vacuum suction
pump was Varian HS 602 Vacuum Pump supplied by Agilent Technologies India Pvt. Ltd.
(Haryana, India).
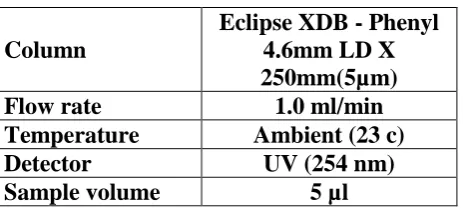
Chromatographic condition
LC (2010)AHT with the C18 column (4.6X250mm, 5µm), (X bridge C18 5µm) was used and
the wave length used for the detection was 254nm. The other method conditions included
were the column oven temperature of 23ºC, flow rate of 1ml/min, run time of 6min and
[image:3.595.185.417.544.652.2]injection volume of 5µl.
Table 1: HPLCchromatographic condition.
Preparation of stock and standard solutions
The Bosentan standard was weighed twice separately and prepared separately using methanol
and water (50:50) to yield two primary standard stock solutions (1 and 2) with a
concentration of 50 µg/mL. Secondary and working stock solutions for the calibration curve
were prepared from bosentan primary stock solution-1 by methanol and water (50:50). The Column
Eclipse XDB - Phenyl 4.6mm LD X 250mm(5µm)
Flow rate 1.0 ml/min
Temperature Ambient (23 c)
Detector UV (254 nm)
quality controls working stock solution were prepared from primary stock solution-2 by
methanol and water (50:50). These working stock solutions (1 and 2) were further diluted to
obtain bosentan calibration spiking stock solution for the final concentrations of
50,80,100,120 and 150 ng/mL and concentrations of (250, 500 and 750 ng/mL) quality
control spiking stock solutions were prepared. The internal standard (Losertan) was weighed
and prepared separately using methanol and water (50:50) to obtain a primary stock solution
of 50µ mg/mL. The working internal standard solution with a concentration of 500 ng/mL
was prepared by diluting the primary stock solution with methanol.
Extraction of Bosentan from rat plasma
Extraction of Bosentan from rat plasma sample was carried out by using simple liquid-liquid
extraction mrthod. 0.2ml from each concentration level and 0.1ml of IS are transferred into
10ml volumetric flask and makeup the volume. Shake for 10 minutes. from the above sample
collect 0.25ml into centrifuge tube. Add 3ml of ethyl acetate. Shake for 15minutes.
Centrifuge for 20 minutes & collect the supernatant layer and evaporate. Reconstitute the
tubes with 0.25ml mobile phase. The representative chromatograms were shown in Figure 2.
Bioanalytical method validation
Preparation of calibration curve:The linearity of the method was evaluated by a calibration
curve in the range of 0.98 – 998ng/ mL of metaxalone, including lower limit of Quantitation
(LLOQ). The calibration curve was achieved by plotting the peak area ratios of metaxalone
and internal standard versus the concentration of metaxalone by least-squares linear
regression analysis. The calibration curve requires a correlation coeicient (R2) of >0.99. he
acceptance criteria for each back-calculated standard concentration should be within 15% of
the nominal concentration, except it should not exceed 20% for the LLOQ. Each validation
run consisted of a double blank, system suitability sample, a zero standard, calibration curve
consisting of ten non-zero samples covering the total range (0.98 – 998 ng/mL) and QC
samples at three concentrations (N = 6, at each concentration). Such validation runs were
generated on six consecutive days.
Accuracy and precision
Intra-day and Inter-day accuracy and precision were determined by duplicate analysis of six
sets of samples spiked with four diferent concentrations of bosentan at low, medium, high
quality control samples (200,500 and 750 ng/mL) including LLOQ (200 ng/mL) within a day
should be within 85–115% of the nominal concentration and coeicient of variation (%CV)
values should be <15% over the calibration range, except at the LLOQ, where accuracy
should be between 80 – 120% and %CV should not be more than 20%.
Selectivity: The selectivity of the assay methodology was established using a minimum of
six independent sources of the same matrix. There were no interferences from the
endogenous material at the retention time for both Bosentan and internal standard (Losertan).
The representative chromatogram is shown in Figure 3.
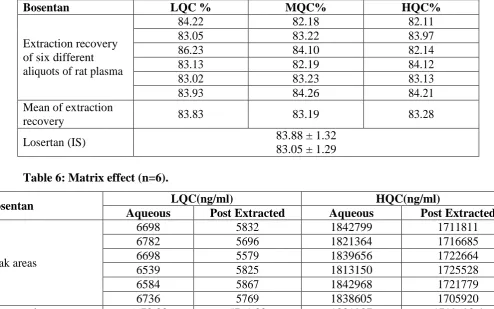
Recovery: Recovery of bosentan was evaluated by comparing the mean peak areas of three
extracted low, medium and high quality control samples to mean peak areas of three neat
reference solutions (un-extracted). Recovery of internal standard was evaluated at a
concentration of 200 ng/mL and corresponding mean peak area of the extracted samples
compared to the mean peak areas of neat reference solutions. Recovery of the analyte need
not be 100%, but the extent of recovery for analyte (Bosentan) and internal standard
(Losertan) should be consistent and reproducible.
Stability: In order to ind out the stability of bosentan in rat plasma, bench top stability, freeze
thaw stability, auto injector stability and long term stability studies were carried out by using
six replicates of the low and high plasma quality control samples. For the bench top stability,
frozen plasma samples were kept at room temperature for 24 hr before sample preparation.
Freeze–thaw stability of the samples was obtained over three freeze-thaw cycles, by thawing
at room temperature for 2–3 hr and refrozen for 12–24 hr for each cycle. Auto sampler
stability of metaxalone was tested by processed and reconstituted low and high plasma QC
samples, which were injected 24 hr ater reconstitution and were compared with freshly
prepared QC samples. Long term stability of metaxalone in rat plasma was tested after
storage at approximately −70°C for 30 days. For the acceptance criteria of stability, the
deviation compared to the freshly prepared standard should be within ± 15% of the nominal
concentration.
Matrix efect: The matrix effect was performed in 6 different lots of rat plasma by taking
47.5 µl of rat plasma and 2.5 µl of methanol: water (50:50) solution. From the mixture, take
25 µl and add 375 µl of blank methanol containing. This blank mixture was vortexed for 5
min at 885 g and centrifuged at 19283 g for 8 min to prepare the extracted blank. The
internal standard along with 350 µl of methanol containing 0.1% trichloroacetic acid. The
extracted blank supernatant and aqueous equivalent solution were mixed in a ratio of (1:1)
solution. The blank aqueous solution was prepared by mixing 25 µl of water along with 375
µl of methanol and subjected to vortexing. The neat solution and post extracted solution.
Were prepared by mixing aqueous equivalent solution to both extracted blank and blank
aqueous solution in a ratio of (1:1) solution. Both solutions were vortexed and subjected to
RP-HPLC for analysis.
Matrix suppression or enhancement was calculated as follows: 100×mean peak area of post
extracted sample/mean peak area of neat standard solution. The acceptance criteria for matrix
efect implied that the %CV should be less than 15% of matrices tested and at least 80% of
matrices should meet the above criteria. he results obtained were displayed in Table 2.
Table 2: Calibration table.
Day R Slope ntercept
1 0.992 14769 510323
2 0.992 14698 510264
3 0.993 14779 510233
4 0.994 14773 510289
5 0.992 14777 510283
6 0.993 14765 510269
Mean 0.992 14777 510298
SD 8.844E-05 1.277E-06 0.1272 SE 3.452E-05 5.12 3E-07 0.113
Table 3: Intraday precision and accuracy (n=6).
Concentration added (ng/ml)
Concentration found
(mean ± SD) (ng/ml ) %CV %Bias
50 49.8 ± 0.19 1.64 -1.49
250 249.3 ± 0.33 1.32 -1.25
500 498.11 ± 1.390 1.26 -2.45
750 687.26 ± 1.993 1.84 -3.67
Table 4: Interday Accuracy and precision (n=6).
Concentration added (ng/ml)
Concentration found (mean ± SD)
(ng/ml)
%CV %Bias
50 49.9 ± 0.34 1.98 -1.40
250 249.84 ± 0.43 1.99 -2.31
500 490 ± 0.520 1.41 -1.90
Table 5: Extraction Recovery (n=6).
Bosentan LQC % MQC% HQC%
Extraction recovery of six different aliquots of rat plasma
84.22 82.18 82.11
83.05 83.22 83.97
86.23 84.10 82.14
83.13 82.19 84.12
83.02 83.23 83.13
83.93 84.26 84.21
Mean of extraction
recovery 83.83 83.19 83.28
Losertan (IS) 83.88 ± 1.32
83.05 ± 1.29
Table 6: Matrix effect (n=6).
Bosentan LQC(ng/ml) HQC(ng/ml)
Aqueous Post Extracted Aqueous Post Extracted
Peak areas
6698 5832 1842799 1711811
6782 5696 1821364 1716685
6698 5579 1839656 1722664
6539 5825 1813150 1725528
6584 5867 1842968 1721779
6736 5769 1838605 1705920
Mean peak area 6672.83 5761.33 1831987 1719693.4
Relative standard
deviation 1.968627 1.618601 0.690661 0.43241655
Absolute matrix effect 90.257 93.870
Table 7: Stability details of Metaxalone in rat plasma sample (n=6).
Concentration (ng/ml) Fresh sample Concentration (ng/ml) Sample Concentration after storage(ng/ml)
%CV %Bias
Short term (24hr)
200 200.3 198.63 1.92 -2.20
750 746.46 720.36 1.48 -2.59
Three Freeze thaw cycles
200 200 198.4 1.43 -0.98
750 755.2 732.7 2.13 -2.25
Auto sampler stability (24 hr)
200 200.6 195.4 1.36 -1.46
750.00 762.30 753.7 1.41 2.35
Long term 30 days (-85°C)
200 199.8 192.8 2.97 -2.33
Fig-2 Representative chromatogram of lowest calibration standard.
Fig-3 Representative Chromatogram of Highest Calibration Standard.
RESULTS
Selectivity and optimization of chromatographic conditions
Plasma matrices were obtained from six diferent sources and assayed to evaluate the
(internal standard) were well separated from the co-extracted material under the described
chromatographic conditions at retention times of 2 and 4.3 min respectively. No endogenous
peak from plasma was found to interfere with the elution of either the drug or the internal
standard. The LLOQ which could be measured with acceptable accuracy and precision for the
analyte 200 ng/mL was established (Figure 4). It indicates that the proposed method is highly
selective and specific.
Calibration curve
Linear detector response for the peak-area ratios of the metaxalone to internal standard was
observed in the concentration range between 50 - 750 ng/mL with a mean correlation
coeicient of 0.992. The reason for choosing a wide calibration range for Bosentan. PK study
is to analyze samples of higher and lower dose concentration and diferent route of
administration like intravenous administration and per oral where the Cmax concentration
will be higher for intravenous. he best it for the calibration curve could be achieved with the
linear equation Y = MX + C. The mean linear regression equation of calibration curve for the
analyte was Y = 0.14777x-510298, where Y was the peak area ratio of the analyte to the IS
and X was the concentration of the analyte. he results were given in the Table 3.
Accuracy and precision
The intra-day accuracy and precision ranged between 96.2-104.11% and 1.54-1.69%,
respectively. The inter-day accuracy and precision ranged from 95.56 to 110.26% and 1.38 to
1.87%, respectively. The accuracy and precision for intra and interday at the LLOQ and at
LQC, MQC, HQC control samples of metaxalone in plasma were within acceptable limits (N
= 6). The results of the method validation studies presented in Table 4 and 5.
Recovery
The recovery of Bosentan in plasma was calculated at three QC levels. The response
(extracted) compared to that of unextracted samples of the reference solution. The percentage
recovery of Bosentan and losertan (internal standard) were found to be above 80%. Results
are displayed in the Table 6.
Stability
Stock solutions of Bosentan(5 mg/mL) and internal standard (5 mg/mL) were separately
prepared. The solutions were stable for at least 1 month when stored under light-protected
the samples might experience after collecting and prior the analysis. All stability results were
summarized in Table 7. The results of three freeze– thaw cycles and bench top stability
testing (24 h) when the spiked samples were kept at room temperature indicated that
Bosentan was stable in rat plasma under these conditions. Analyte spiked QC samples were
stable for at least 30 days if stored in the freezer at −85°C. Testing of auto sampler stability of
quality control samples indicated that Bosentan would be stable when kept in the auto
sampler up to 24 h.
DISCUSSION
A simple and selective LC method is described for the determination of BOSENTAN tablet
dosage forms. Chromatographic separation was achieved on a c18 column using mobile phase
consisting of a mixture of 50 volumes of METHANOL and 50 volumes of WATER (with
detection of 225 nm. Linearity was observed in the range 50-150 µg /ml for BOSENTAN (r2 =0.992) for the amount of drugs estimated by the proposed methods was in good agreement
with the label claim.
The proposed methods were validated. The accuracy of the methods was assessed by
recovery studies at three different levels. Recovery experiments indicated the absence of
interference from commonly encountered pharmaceutical additives. The method was found to
be precise as indicated by the repeatability analysis, showing %RSD less than 2. All
statistical data proves validity of the methods and can be used for routine analysis of
pharmaceutical dosage form.
CONCLUSION
In conclusion a validated RP-HPLC method has been developed for determination of
BOSENTAN in the bulk and combined tablet dosage forms. The results show that the method
was found to be specific, simple, accurate, precise and sensitive. The method was
successfully applied for the determination of both drugs in combined tablet dosage form. In
the future, this method may be applied for routine analysis of both the drugs in API and in
tablet formulation.
Several analytical procedures have been proposed for the quantitative estimation of
BOSENTAN separately and in combination with other drugs. To my knowledge simple,
So attempt was taken to develop and validate a reversed-phase high performance liquid
chromatographic method for the quality control of BOSENTAN in pharmaceutical
preparations with lower solvent consumption along with the short analytical run time that
leads to an environmentally friendly chromatographic procedure and will allow the analysis
of a large number of samples in a short period of time.
ACKNOWLEDGEMENT
Authors are thankful to principal Dr. Bhagavan Raju Sri Venkateshwara College Of
Pharmacy, for support, encouragement and providing facilities to carry out the work. Also,
thankful to Osmania University, Hyderabad, who extended their support for project.
REFERENCES
1. Jump up^ Funke C, Farr M, Werner B, Dittmann S, Uberla K, Piper C, Niehaus K,
Horstkotte D (Apr 2010). "Antiviral effect of Bosentan and Valsartan during
coxsackievirus B3 infection of human endothelial cells.". Journal of General
Virology. 91(8): 1959–1570.
2. Chen X, Ji ZL, Chen YZ: TTD: Therapeutic Target Database. Nucleic Acids Res. 2002
Jan 1; 30(1): 412-5. [PubMed:11752352].
3. Gardiner SM, Kemp PA, March JE, Bennett T: Effects of bosentan (Ro 47-0203), an
ETA-, ETB-receptor antagonist, on regional haemodynamic responses to endothelins in
conscious rats. Br J Pharmacol. 1994 Jul; 112(3): 823-30. [PubMed:7921608].
4. Gupta SK, Saxena A, Singh U, Arya DS: Bosentan, the mixed ETA-ETB endothelin
receptor antagonist, attenuated oxidative stress after experimental myocardial ischemia
and reperfusion. Mol Cell Biochem. 2005 Jul; 275(1-2): 67-74. [PubMed:16335785].
5. Marano G, Palazzesi S, Bernucci P, Grigioni M, Formigari R, Ballerini L: ET(A)/ET(B)
receptor antagonist bosentan inhibits neointimal development in collared carotid arteries
of rabbits. Life Sci. 1998; 63(18): PL259-66. [PubMed:9806221].
6. Richard V, Kaeffer N, Hogie M, Tron C, Blanc T, Thuillez C: Role of endogenous
endothelin in myocardial and coronary endothelial injury after ischaemia and reperfusion
in rats: studies with bosentan, a mixed ETA-ETB antagonist. Br J Pharmacol. 1994 Nov;
113(3): 869-76. [PubMed:7858879].
7. Said SA, Ammar el SM, Suddek GM: Effect of bosentan (ETA/ETB receptor antagonist)
on metabolic changes during stress and diabetes. Pharmacol Res. 2005 Feb; 51(2):
8. Albertini M, Lafortuna CL, Ciminaghi B, Mazzola S, Clement MG: Endothelin
involvement in respiratory centre activity. Prostaglandins Leukot Essent Fatty Acids.
2001 Sep; 65(3): 157-63. [PubMed:11728166].
9. Chen X, Ji ZL, Chen YZ: TTD: Therapeutic Target Database. Nucleic Acids Res. 2002
Jan 1; 30(1): 412-5. [PubMed:11752352].
10.Kiowski W, Sutsch G, Oechslin E, Bertel O: Hemodynamic effects of bosentan in
patients with chronic heart failure. Heart Fail Rev. 2001 Dec; 6(4): 325-34.
[PubMed:11447307].
11.Kramp R, Fourmanoir P, Caron N: Endothelin resets renal blood flow autoregulatory
efficiency during acute blockade of NO in the rat. Am J Physiol Renal Physiol. 2001 Dec;
281(6): F1132-40. [PubMed:11704565].
12.Martin C, Held HD, Uhlig S: Differential effects of the mixed ET(A)/ET(B)-receptor
antagonist bosentan on endothelin-induced bronchoconstriction, vasoconstriction and
prostacyclin release. Naunyn Schmiedebergs Arch Pharmacol. 2000 Aug; 362(2): 128-36.
[PubMed:10961375].
13.Sihvola RK, Pulkkinen VP, Koskinen PK, Lemstrom KB: Crosstalk of endothelin-1 and
platelet-derived growth factor in cardiac allograft arteriosclerosis. J Am Coll Cardiol.
2002 Feb 20; 39(4): 710-7.
14.Galie N, Seeger W, Naeije R, et al. Comparative analysis of clinical trials and
evidence-based treatment algorithm in pulmonary arterial hypertension. J Am Coll Cardiol. 2004;
43: 81S–88S.
15.Giaid A, Yanagisawa M, Langleben D, et al. Expression of Endothelin-1 in the lungs of
patients with pulmonary hypertension. N Engl J Med. 1993; 328: 1732–9.
16.Hughes R, George P, Parameshwar J, et al. Bosentan in inoperable chronic
thromboembolic pulmonary hypertension. Thorax. 2005; 60: 707.
17.https://www.ncbi.nlm.nih.gov/pmc/articles/PMC2350123/