EXPRESS LETTER
Autonomous spectrographic system
to analyse the main elements of fireballs
and meteors
Francisco Ángel Espartero
1*, Germán Martínez
2, Marta Frías
3, Francisco Simón Montes Moya
1and Alberto Javier Castro‑Tirado
4Abstract
We present a meteor observation system based on imaging CCD cameras, wide‑field optics and a diffraction grating. This system is composed of two independent spectrographs with different configurations, which allows us to capture images of fireballs and meteors with several fields of view and sensitivities. The complete set forms a small autono‑ mous observatory, comprised of a sealed box with a sliding roof, weather station and computers for data storing and reduction. Since 2014, several meteors have been studied using this facility, such as the Alcalá la Real fireball recorded on 30 September 2016.
Keywords: Fireball, Meteoroids, Meteors, Spectroscopy
© The Author(s) 2018. This article is distributed under the terms of the Creative Commons Attribution 4.0 International License (http://creativecommons.org/licenses/by/4.0/), which permits unrestricted use, distribution, and reproduction in any medium, provided you give appropriate credit to the original author(s) and the source, provide a link to the Creative Commons license, and indicate if changes were made.
Introduction
Meteor spectra studies started in the 1860s by means of the observations taken by A.S. Herschel (Millman 1963). Photographic techniques have been used to study meteor spectra since the end of the nineteen century (Millman
1980), and transmission gratings started to replace prisms in meteor spectrographs since the 1950s. Broad spectros-copy programmes were carried out in USA, Canada, the former USSR and Czechoslovakia (Ceplecha et al. 1988). New video techniques to study meteor spectra started to be used in the early 1970s (Hemenway et al. 1971), as well as new methods and TV processes for data reduc-tion, described by Millman and Clifton (1975), Borovicka and Bocek (1995) and Zender et al. (2004). Meteor spec-troscopy is based on the emission of atomic lines (emis-sion spectra), along with other molecular bands and continuous radiation. Early on, Halliday (1961), Ceplecha (1971) and Borovička (1994a) provided significant iden-tification lists of lines in high-dispersion photographic spectra. Meteor emission lines can be divided into two
components according to their temperature (high and low) (Borovička 1994b).
Video techniques allow the recording of relatively faint meteors (Espartero and Madiedo 2016 and ref-erences therein) in comparison with photographic images, so only certain emission lines can be detected, such as Na, Mg, Ca and Fe, in addition to the O, N and N2 atmospheric emissions (obtained by low-resolution spectroscopy). With our video systems, we can capture meteors with apparent visual magnitude as faint as 3 ± 1 (Madiedo et al. 2016), but the spectrographic equipment is limited to the spectral study of fireballs with visual apparent magnitude of − 4 and brighter.
Light emitted by meteors during the ablation process in the terrestrial atmosphere allows us to study, by means of spectrographs, the chemical nature of their parent bod-ies. Thus, the analysis of the spectrum of a given meteor can provide distinct information about the plasm, the ablation process and the chemical composition of the meteoroid (Borovička 1993, 1994a; Trigo-Rodríguez et al.
2003) and even relevant information about its parent body.
This new system for capturing spectroscopic images has been designed in order to obtain more detailed and complete emission spectra from bright bolides and
Open Access
*Correspondence: [email protected]
1 Observatorio Andaluz de Astronomía, La Pedriza, 23688 Alcalá la Real, Jaén, Spain
meteors with higher spectral resolution when compared to video techniques. This system is the first in a series of three stations that are foreseen to be located at a mini-mum distance of 100 km from each other, in order to be able to calculate the atmospheric trajectory, radiant of origin and orbit of its progenitor in the solar system (Ceplecha 1987) from at least two stations, in addition to analysing the corresponding meteor spectra.
Instrumentation
The existing spectrographic equipment we have devel-oped is located at the Andalusian Astronomical Observa-tory (37°24′54″N, 3º57′12″W), a dark location at 1030 m above the sea level, in south Spain (close to the Alcalá la Real village). The equipment has been connected to a weather station that regulates the proper functioning of the spectrographs. The station allows the equipment to automatically start operating at sunset and being discon-nected at sunrise on a daily basis.
We use two different spectrographs, with different optical configurations and CCD cameras, to attempt to get images with different fields of view and sensitivity for the same fireball. The combination of these images allows to capture the complete fireball phenomenon and obtain precise details thereof.
Spectrographs
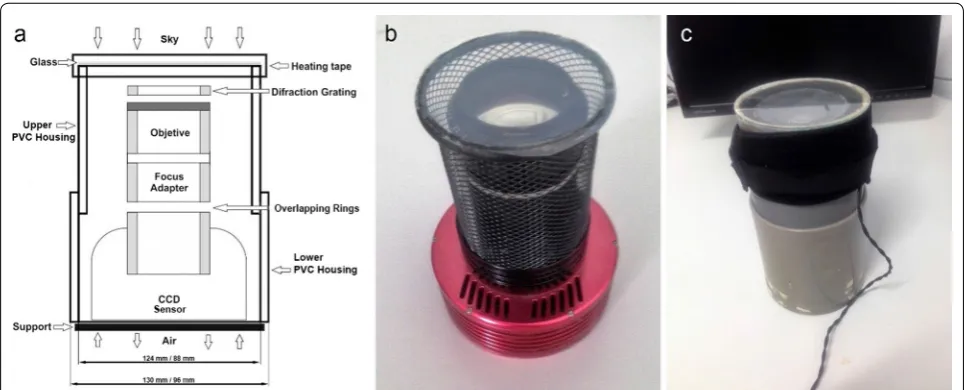
The two spectrographs have the same design, but differ-ent size. Each of them is composed by a CCD camera with a wide-field telephoto lens, a holographic diffraction grating and adequate protection against weather (Fig. 1). Both the CCDs and the lenses are different models, and
thus, we have had to adopt two different settings in order to obtain two images simultaneously, with different spec-tral resolution each other.
To assemble all the elements that form the spectro-graph, firstly, all elements were adjusted manually to obtain a precise optical focus and its stability. For each of the two spectrographs, the resulting block (CCD case + adapter + objective + grating) was then inserted inside two concentric polyvinyl chloride (PVC) tubes. These tubes are covered at their upper end with a special glass, perfectly sealed with a silicone elastomer, which allows both waterproofing and preventing temperature differences from impairing the connection joint (Fig. 1).
The spectrographs are located in an automatic enclo-sure system, which serves as support and protection. This system has an electromechanical device which opens or closes a sliding double roof above them (Fig. 2). The sys-tem is connected to a weather station that measures the cloud rate to close the roof and turns the system off in case of risk of rain.
The equipment is connected to two computers in which the recorded images are saved to the hard drive. Moreover, all the devices that form this system can be controlled at distance and programmed in advance.
The main elements of the spectrographs (CCD cam-eras, wide-field objectives and diffraction gratings, sup-port and protection) are described below.
CCD cameras
Two CCD cameras with different configurations have been used for each of the spectrographs. Details are listed in Table 1.
Wide‑field objectives and diffraction gratings
Two different photographic lenses are used. On the one hand, a Sigma 4.5 mm f/2.8 EX DC HSM objective is attached to the Atik 314L + CCD, which provides a 120º field of view and is adapted by a male/female aluminium adapter to achieve a good focus. On the other hand, a 50 mm f/1.2 Nikon objective that provides a field of view of 15° is also attached to the Atik 11000 CCD via an adapter cap.
Facing each objective and with only a 0.67 mm maxi-mum separation, the 1000 lines per mm holographic grating are connected over a filter adaptor, which var-ies in each device depending on its size. This allows for a quick and easy handling for its maintenance, given that every 6 months the grating must be replaced by a new one to obtain optimum results and prevent its deterio-ration (as solar radiation and temperature changes dete-riorate the joint between the grating and the objective, causing its detachment).
Support and protection
Protection systems for the spectrographs have been spe-cifically designed and created for this set of elements, as per the dimensions and needs of each device. The indi-vidual PVC protection consists of two concentric tubes
whose dimensions fit the CCD and other elements that shape our device. The PVC tubes only have a 8-mm dif-ference in diameter between them, in the case of spec-trograph #1 (96/88 mm) and a 6-mm difference in spectrograph #2 (130/124 mm) as Fig. 1a shows. This lets both tubes fit inside each other and move relative to one another. They serve as fastening and anchoring for the cameras and optical systems. In the first experimental and test phase, adaptors with different height overlapping rings threaded between the CCD detector and the objec-tive were placed to obtain the adequate focal length that would allow us to get sharp images. These elements were inserted inside two PVC tubes, which allow the whole set to be handled and moved without any relevant opti-cal disturbances. The upper part of the tube is covered by 1-mm-thick float glass and with the same diameter as the tube, in order to correctly fit and being sealed with a spe-cial silicon cord for glass and exterior.
The last element that comprises this system is the regu-lated heating tape, which is connected to the upper part of the tube, surrounding the protection glass. This tape prevents frost formation as well as the condensation of water vapour (mist), both inside and outside. It has been built with a printed flexible circuit and surface mounted device (SMD) resistance, isolated with silicone and thick fabric to avoid heat loss.
Automatic enclosure (opening/closing) system (AES)
For the spectrographs to be operated in a reliable and durable way, an AES (Fig. 2) has been designed and built, which can be manipulated remotely via the Internet. The automatic module is built with a structure of 10 × 10 mm square section steel bars with electrowelded joints, which allows us to place the necessary trays and supports for Fig. 2 Automatic enclosure (opening/closing) system (AES). a General scheme of the interior with the main elements. b The system with the open roof
Table 1 Description of main features of the two CCDs used in the spectrographs
Spectro‑
graph CCD Sensor monochr. Resolution (pixel) Format (mm)
#1 Atik 314L+ Sony
ICX285AL 1392 × 1040 10.2 × 8.3 #2 Atik 11000 Kodak KAI
the mechanical elements that give mobility to the leaning roof. As outer coating, panels of 2-mm-thick galvanized sheet have been placed in both walls and the sliding roof. The roof of the observatory has been designed with a double leaning slope whose opening and closing are done in an opposed and synchronized way (Fig. 2).
Inside, the spectrographs are placed on the supports, as well as the various devices that allow for the opening and closing of the roof. The activation of the roof of this small observatory is achieved by two 24-V electric engines, which are activated through two relays, current intensity trans-formers and a programmer. These electronic devices are programmed and regulated through the control computer and allow us to move the roof accordingly. This ensemble is connected to the 220 V electric current through a system of uninterrupted power source, which also allows us to con-trol the possible oscillations in voltage and amperage that may damage the equipment. The AES controller is based on the astronomical weather station input.
Astronomical weather station
A weather station for astronomy (dubbed EMA) weather station was specifically designed to control and meas-ure the atmospheric and sky quality parameters in order to guarantee that observations are performed in safe conditions.
The EMA weather station measures, among other parameters, the sky brightness (using a Sky Quality Meter), the speed of air (by means of an anemometer) or the cloud index (thanks to a Peltier system that measures the difference in infrared radiation between the ground and the sky), the latter being the most relevant indica-tor for our protection system, as we choose to close the protection if it surpasses the 70% fraction of clouds in the sky. At this point, the EMA sends a signal to the AES to close its sliding roof, while the CCDs are switched to ‘standby’ mode until the cloud cover value decreases below the threshold and the system resumes operation again.
The process that allows the correct functioning of the system (protection module, spectrographs and comput-ers) is the following one. The ensemble is connected to the EMA of the Andalusian Astronomy Observatory, which activates the system at sunset and deactivates it at sunrise, thus allowing it to stay disconnected and the protection module to remain closed during the daytime hours. The switching on/off depends on the magnitude of sky bright-ness, and it is not necessary to update an astronomical clock or timer with the passage of days, since its autoregu-lation is autonomous (Trueblood and Russel 1985).
Daily operations begin with the aperture of the AES soon after twilight, provided the sky’s brightness value is < 12 mag/arcsec2, as these lower values would saturate
the images obtained. This value drops again shortly before the sunrise, at which time the systems stop func-tioning and the AES closes. The computers remain on hibernation mode every day and are activated automati-cally at twilight, continuing to store the images into the corresponding hard drives.
Data acquisition
The spectrographs obtain different types of images depending on their optical lens and CCDs combinations. With spectrograph #1 (the wide-field spectrograph), images of up to 250 kB providing a field of view of 120° are obtained, and with spectrograph #2 (the narrow field spectrograph), images of up to 2.2 MB providing a field of 15° are gathered, reaching limiting magnitudes of 9 and 11, respectively (when comparing to the stellar catalogue USNO-B1.0), if atmospheric conditions and seeing are optimal. Download time is 2 and 5.2 s for spectrographs #1 and #2, respectively, with optimal exposure times being 60 s for spectrograph #1 and 90 s for spectrograph #2. These times are halved during the previous and fol-lowing days around the full moon phase, thus avoiding the saturation of the images to a great extent.
The data are stored in the hard drives of two comput-ers (one for each spectrograph), so when a fireball alert is received (by e-mail) through the Spanish Meteor Net-work (SPMN), the images can be pinpointed by date and time. Capturing images is done with the original ARTEMI software provided by the Atik CCD manufac-turer, and the data are saved in FITS format.
Data reduction
The image reduction process is done by subtracting the previous or following image to the image containing the fireball, with the dark and bias being subtracted with the MAXIM DL software.
The first and second orders of the spectrum are pre-sent, and in some cases, due to the brightness of the fireball, the signal corresponding to the first order can saturate during a part of its atmospheric trajec-tory. The CHIMET software (Madiedo et al. 2011) has been used, as it can provide valuable information of the studied objects through a synthetic spectrum. The basic procedure has been described in Trigo-Rod-ríguez et al. (2003).
The first and second orders of the spectrum may be pre-sent depending on the time and apparent magnitude of the meteor, but in some cases and due to the intense brightness of the fireball, the signal corresponding to the first order may become saturated during part of its atmospheric trajectory. For its correct analysis, it is nec-essary then to resort to the second order of the spectrum. To properly obtain the spectrum, we first determine the intensity profile by comparing the pixel brightness (in arbitrary intensities) versus the number of pixels along the given direction. The spectrum is analysed and calibrated automatically in intensity and wavelength by means of the CHIMET software mentioned above (Madiedo et al. 2011), in order to identify the main wave-lengths with different chemical species, such as Na, Mg, Fe, Ca or Cr. To this end, the program uses a database containing the main frequencies and typical emissions of meteor spectra. These frequencies have been taken from the NIST Atomic Spectra Database (http://physics.nit. gov/PhysRefData/ASD/lines_form.html). Thus, the soft-ware can superimpose the theoretical spectral lines with the new lines of the observed spectrum. Then, it selects some known lines of the spectrum, such as Na and Mg, and the software automatically sets the different posi-tions of other well-known theoretical lines.
The spectra of the Alcalá la Real fireball
In this work, we have applied the above-mentioned pro-cedure to the meteor M20160930_213851, captured by both spectrographs on 30 September 2016 at 21 h 38 m 51 s U.T. (Fig. 3). The naming convention corresponds to M for meteor, followed by the date (year YYYY, month
MM, day DD) and UT time (hour HH, minute MM and seconds SS).
The video cameras of the SPMN showed that its bright-ness reached -7. As it was not possible to identify the origin of this meteor, it was considered to be of sporadic origin. Our analysis of its spectral lines clearly indicates the most prominent emission features due to the Na I-1 (5889 Å) and Mg I-2 (5167 Å) lines together with the Fe I-15 multiplets (5269 and 5429 Å). The numbers of the multiplets are given according to Moore (1945), with the most relevant ionized species being highlighted accord-ing to the most intense lines and peaks.
In addition, the contributions of the Fe I-41 (4404 Å) triplets, Fe I-42 (4380 Å), Cr I-1, Fe-I-43, Mn I-2 lines and the presence of Ba-I are clearly prominent in the first order of the spectrum. In the second order, the presence of the Na I-5 and Fe I-318 lines is observed in the infra-red, in addition to other compounds such as N2 (Fig. 4).
On the other hand, it is worth noting the scarce pres-ence of refractory elements such as Ca and Al, which is a common phenomenon in the case of a meteoroid with a low heliocentric velocity (Trigo-Rodríguez 2002; Trigo-Rodríguez et al. 2003). This is due to the inefficiency of providing all the available Ca or Al in its vapour phase. Thus, it was previously reported (Trigo-Rodríguez et al.
2003) that, in the chondritic meteoroids, the elements Ca and Al are associated with refractory minerals that do not complete their vaporization during the ablation phase (Trigo-Rodríguez 2002; Trigo-Rodríguez et al.
2003; Trigo-Rodríguez and Llorca 2007).
The chemical abundances of the main spectral ele-ments of a meteor provide a more detailed information
if we consider the classification of its populations (Borovička et al. 2005) and the comparison of the ratios of its chemical elements by means of ternary diagrams (Trigo-Rodríguez et al. 2003). These techniques allow us to study the nature of fireballs that are captured by our spectrographs from 2013 to 2016 and that are analysed in Espartero et al. (2017). In some cases, it has been possible to gather video images from two or more stations, which allows us to complete our work with the orbital analysis of their parent bodies, providing their radiant and most relevant parameters.
Conclusions
We have described the spectrographic system developed and installed in the Andalusian Astronomical Observa-tory and showed an example of the fireball spectra that can be analysed with it. The main conclusions are the fol-lowing one:
1. The spectra images obtained with this method allow us to analyse fireballs with apparent magnitude of
− 4 and brighter and whose trajectory, with the
aforementioned brightness, lasts at least 2 s.
2. The spectra obtained cover the range from 3700 to 10000 Å, including the first- and second-order spec-tra.
3. The chemical abundances analysed in the Alcalá la Real fireball spectrum presented in this work indicate that it could be a sporadic object with a chondritic nature.
For the future, we aim at expanding the network of spectrographs, incorporating two new stations, at > 100 km distance each other, which will allow altogether to determine the atmospheric trajectory, the apparent radiant in the sky, and the orbit of the parent object. We also plan to use fish-eye optics for the future spectro-graphs, in order not to lose the fireballs that happen to occur close to the horizon. The image acquisition must be also configured alternatively in order to continuously cover the visible sky. This will ensure the full perfor-mance of these devices.
Authors’ contributions
Espartero performed the instrumentation set‑up and data analysis and drafted the manuscript. Martínez, Frias and Montes participated in designing the instrumentation and helped draft the manuscript. Castro‑Tirado participated in designing the study and interpreting the results, and helped draft the manuscript. All authors read and approved the final manuscript.
Author details
1 Observatorio Andaluz de Astronomía, La Pedriza, 23688 Alcalá la Real, Jaén, Spain. 2 Departamento de Ingeniería de la Construcción y Proyectos de Ingeniería, Campus de Fuentenueva, Universidad de Granada, 18071 Granada, Spain. 3 School of Physics, University of Bristol, Bristol BS8 1 TL, UK. 4 Instituto de Astrofísica de Andalucía, IAA‑CSIC, P.O. Box 03004, 18080 Granada, Spain.
Acknowledgements
We thanks the support of the M.I. Ayuntamiento de Alcalá la Real, the Diputación de Jaén, the Spanish Meteor Network (SPMN) and the Span‑ ish Ministry through Project AYA 2015‑71718‑R (including FEDER funds). We thank A. Castellón (University of Málaga) for fruitful discussions. We also acknowledge the useful comments from the referees, as they have helped to significantly improve this manuscript.
Competing interests
The authors declare that they have no competing interests.
Publisher’s Note
Springer Nature remains neutral with regard to jurisdictional claims in pub‑ lished maps and institutional affiliations.
Received: 11 March 2017 Accepted: 19 December 2017
References
Borovička J (1993) A fireball spectrum analysis. Astron Astrophys 279:627–645 Borovička J (1994a) Line identifications in a fireball spectrum. Astron Astrophys
Suppl Ser 103:83–96
Borovička J (1994b) Two components in meteor spectra. Planet Space Sci 42:145–150
Borovička J, Boček J (1995) Television spectra of meteors. Earth Moon Planet 71:237–244
Borovička J, Koten P, Spurný P, Boček J, Stork R (2005) A survey of meteor spectra and orbits: evidence for three populations of Na‑free meteoroids. Icarus 174:15–30
Ceplecha Z (1971) Spectral data on terminal flare and wake of double‑station meteor No. 38421 (Ondrejov, April 21, 1963). Bull Astron Inst Czechoslov 22:219–304
Ceplecha Z (1987) Geometric, dynamic, orbital and photometric data on meteoroids form photographic fireball networks. Bull Astron Inst Czecho‑ slov 38:222–234
Ceplecha Z, Borovička J, Elford WG et al (1988) Meteor phenomena and bod‑ ies. Space Sci Rev 84:327–471
Espartero FA, Madiedo JM (2016) The Norterm ω‑scorpiid meteoroid stream: orbits and emission spectra. Earth Moon Planet 118:81–89
Espartero FA et al (2018) In preparation
Halliday I (1961) A study of spectral line identifications in Perseids meteor spectra. Publications of the Dominion Observatory, Ottawa Hemenway CL, Swider A, Bowman C (1971) Meteor spectroscopy using an
image orthicon. Can J Phys 49:1361–1364
Madiedo JM, Toscano FM, Trigo‑Rodríguez JM (2011) Software tools for the analysis of video meteors emission spectra. In: Abstracts of the EPSC‑DPS joint meeting 2011, Nantes, pp 2–7
Madiedo JM, Espartero F, Trigo‑Rodríguez JM, Castro‑Tirado AJ, Pujols P, Pastor S, De los Reyes JA, Rodríguez D (2016) Observations of the Quadrantid meteor shower from 2008 to 2012: orbits and emission spectra. Icarus 275:193–202
Millman PM (1963) A general survey of meteor spectra. Smithson Contrib Astrophys 7:119–127
Millman PM (1980) One hundred and fifteen years of meteor spectra spectros‑ copy. In: Halliday I, McIntosh BA (eds) IAU Symposium on solid particles in the solar system, vol 90. Reidel, Dordrecht, pp 121–128
Millman PM, Clifton KS (1975) SEC Vidicon spectra of Geminid meteors, 1972. Can J Phys 53:1939–1947
Moore CE (1945) A multiplet tablet of astrophysical interest. Contrib Princet Obs 20:1–110
Trigo‑Rodríguez JM (2002) Spectroscopic analysis of cometary and asteroidal fragments during their entry into the terrestrial atmosphere, Ph.D. thesis, University of Valencia, Spain (In Spanish)
Trigo‑Rodríguez JM, Llorca J (2007) Erratum: the strength of cometary meteor‑ oids: clues to the structure and evolution of comets. MNRAS 375:415 Trigo‑Rodríguez JM, Llorca J, Borovička J, Fabregat J (2003) Chemical abun‑
dances determined form meteor spectra‑ I: ratios of the main chemical elements. Meteorit Planet Sci 38:1283–1294
Trueblood M, Russel G (1985) Microcomputer control of telescopes. Editions Willmann‑Bell, Inc., Richmond