University of Nebraska - Lincoln University of Nebraska - Lincoln
DigitalCommons@University of Nebraska - Lincoln
DigitalCommons@University of Nebraska - Lincoln
Faculty Papers and Publications in Animal
Science Animal Science Department
March 2007
Impact of bovine somatotropin on ranking for genetic value of
Impact of bovine somatotropin on ranking for genetic value of
dairy sires for milk yield traits and somatic cell score
dairy sires for milk yield traits and somatic cell score
A. Al-Seaf
University of Nebraska-Lincoln Jeffrey F. Keown
University of Nebraska-Lincoln, [email protected] L. Dale Van Vleck
University of Nebraska-Lincoln, [email protected]
Follow this and additional works at: https://digitalcommons.unl.edu/animalscifacpub
Part of the Animal Sciences Commons
Al-Seaf, A.; Keown, Jeffrey F.; and Van Vleck, L. Dale, "Impact of bovine somatotropin on ranking for genetic value of dairy sires for milk yield traits and somatic cell score" (2007). Faculty Papers and Publications in Animal Science. 238.
https://digitalcommons.unl.edu/animalscifacpub/238
This Article is brought to you for free and open access by the Animal Science Department at
DigitalCommons@University of Nebraska - Lincoln. It has been accepted for inclusion in Faculty Papers and
Impact of bovine somatotropin on ranking for
genetic value of dairy sires for milk yield traits
and somatic cell score
A. Al-Seaf', J.F. Keown' and L.D. Van Vleck2
'Department ofAniinal Science, University of Nebraska, Lincoln, NE, USA 'Roman L. Hruslta U.S. Meat Aniinal Research Center, ARS, USDA, Lincoln, NE, USA
Corresponding author: J.F. Keown E-mail: [email protected]
Genet. Mol. Res. 6 (1): 79-93 (2007) Received October 3 1, 2006
Accepted December 1 1, 2006 Published March 9, 2007
ABSTRACT.
Records of Holstein cows were used to examine how different inodels account for the effect of bovine soinatotropin (bST) treatment on genetic evaluation of dairy sires for yield traits and somatic cell score. Data set 1 included 65,720 first-lactation records. Set 2 in- cluded 50,644 second-lactation records. Set 3 included 45,505 records for lactations three, four and five. Estimated breeding values (EBV) of sires were with three different animal models. With Model 1, bST ad- ministration was ignored. With Model 2, bST administration was used as a fixed effect. With Model 3, administration of bST was used to define the conteinporary group (herd-year-month of calving-bST). Correlations for EBV of 1,366 sires with treated daughters between pairs of the tlwee niodels were calculated for milk, fat and protein yields and somatic cell score for the three data sets. Correlations for EBV of sires between pairs of niodels for all traits ranged froni 0.971 to 0.999. Fractioiis of sires with bST-treated progeny selected in coninion (top 10 to 15%)A. Al-Seaf et al. 80
were 0.94 and usually greater for all pairs of inodels for all traits and parities. For this study, the method of statistical adjustment for bST treat- ment resulted in a negligible effect on genetic evaluations of sires when soine daughters were treated with bST and suggests that selection of sires to produce the next generation of sires and cows might not be significantly affected by how the effect of bST is modeled for prediction of breeding values for milk, fat and protein yields and somatic cell score. Key words: Bovine somatotropin, Estimated breeding values,
Genetic parameters, Somatic cell score, Milk yield ranlting
INTRODUCTION
Effects of bovine soinatotropin (bST) on milk production traits have been reported by several studies (Bauman et al., 1985; Peel and Bauman, 1987; Soderholm et al., 1988; Bauman, 1992; Weigel et al., 1998; Al-Juinaah, 200 1). Jordan et al. (1 99 1) showed that milk and protein yields increased 18.8 and 3.3%, respectively, for high-producing cows, but with no effect on somatic cell score (SCS). Hartnell et al. (1991) indicated that response of milk yield to bST treatment depends on the amount of bST injected. Reproductive performance has been found to be similar for treated and untreated cows (Eppard et al., 1985; Chalupa et al., 1988; Soderholin et al., 1988; Nytes et al., 1990; Bauinan et al., 1999). Burnside and Meyer (1988) with a simu- lation study presented results of the effects of bST on bias of sire evaluation, on within herd variance, and on accuracy of genetic evaluation. They showed that if bST was administered equally to all cows in the herd, there would be no problem with genetic evaluation of sires. However, if adjustment for use of bST is not made and bST does influence genetic evaluation, then soine cows could be selected to be bull-dams even though they were not genetically supe- rior. As a consequence, a serious bias may occur in sire evaluation if some young sires evalu- ated by Animal Improvement Programs Laboratory have different fractions of treated daugh- ters or their herdmates treated with bST. In addition, Weigel et al. (1998) determined the effects of bST on estimated breeding value (EBV) using animal inodels with bST injection ignored, with bST as part of the management group, and with bST treatment as a fixed effect. They reported that correlations between estimates of sire and cow breeding values between different inodels were 0.99. Frangione and Cady (1988), however, reported a significant effect ofbST on ranking of sires. Tsuruta et al. (2000) from a study of test day records concluded that bias in genetic evaluation programs caused by ignoring bST treatment might be significant. Al-Jumaah (200 1) suggested that failure to adjust for bST treatment would have a minimal effect on genetic evaluations of cows.
The objective of the present study was to compare rankings of sires on EBV witli different models that attempt to account for effect of bST treatment on genetic evaluations for lactation yields for milk, fat and protein and soniatic cell score from first, secoiid and third and later lactations.
Bovine solnatotropin impact on sire rankings
MATERIAL AND METHODS
Data for this study were provided by the Dairy Records Management System (DRMS) (Raleigh, NC), and consisted of milk yield adjusted to 305 days in lactation, twice a day inillting, and to a mature equivalent basis for Holstein cows calving between 1990-2001. Although, re- cording of use of bST by DRMS began in 1994, cows born between 1990- 1993 were included to be certain that records from cows receiving bST in later lactations were included. To assure more accurate identification, only records with official Holstein registration numbers were in- cluded. Three different data sets were used. Data set 1 included only first-lactation records. Data set 2 included only second-lactation records. Data set 3 included records from lactations 3 through 5. Approximately 10% of all lactation records included in the data sets were from cows treated with bST. Numbers of records in this study are shown in Table 1. The three data subsets contained 65,720, 50,644 and 45,505 records, respectively. The numbers of cows recorded as treated with bST at least three tiines during lactation and numbers of untreated cows are shown in Table 1. Lactation records considered treated with bST had to be from cows recorded as injected three or more tiines during lactation. Records of cows indicated as treated but less than three tiines during lactation were not used. Numbers of sires of cows with records with bST treatment in the three data sets were 1,366, 1,254 and 1,35 1, respectively. Percentages of herds using bST in the three data sets were 23, 25 and 26%, respectively. Records from herds with less than five cows treated with bST were not included.
Table 1. Numbers of records, herds, slres. co\+s. and herd-year-months of calvlng (HYM) for parltles one and t\+o
and for lactations three and later for cows treated or not treated 1 ~ 1 t h bovlne solnatotrop~n (bST)
bST Parity 1 Parity 2 Lactation 3+
Yes N o Yes N o Yes No
Records 6,374 59,346 4.557 46.137 3.878 4 1.627
Herds 15 1 499 170 5 04 176 495
Slres 1,366 7,889 1.254 6.820 1.35 1 6.705
Dams 4,203 48,2 18 3.554 38.104 3.404 34.1 87
HYM 1,629 17,206 1.697 16.857 1.816 18.309
+Lactations three, four, and five.
Three different models were used to calculate EBV of cows and sires: Model 1 : bST treatment was ignored.
For data sets 1 and 2:
yii = HYM.
+
3
+
e,where J,, is lactation record of cow j in contemporary group i,
HYM, is fixed effect of herd-year-month of calving contemporaiy group i, a, is random additive genetic value of cow j, and
eU is random residual effect for record of cow j in contemporary group i.
A. Al-Seaf et al.
For data set 3:
ylih = HYM
+
3
+
cJ+
e,/\where J,/, is the kth lactation record for cow j in contemporary group i,
HYMl is fixed effect of the herd-year-month of calving conteinporary group i, al is a random additive genetic value of cow j ,
cl is random permanent environmental effect associated with cow j , and e,, is random residual effect for lactation lc of cow j in contemporary group i.
Model 2: bST treatment considered to be a fixed effect. For data sets 1 and 2:
J'll/\ = HYM
+
b S q+
a/\+
eq, where J,/, is lactation record of cow k in conteinporary group i,HYMl is fixed effect of the herd-year-month of calving conteinporary group i, bST, is fixed effect of bST injection (j' = 1 if bST given a n d j = 2 if not given bST),
a, is random additive genetic value of cow k, and
el, is random residual effect for record of cow k i n contemporary group i with bST treatment j .
For data set 3:
where J,,, is the Ith lactation record of cow k in contemporary group i with bST treatment j ,
HYMl is fixed effect of the herd-year-month of calving conteinporary group i, bST, is fixed effect of bST injection (j' = 1 if given bST and j = 2 if not given bST),
a, is random additive genetic value of cow k,
c, is random permanent environmental effect associated with cow k, and
e,,, is random residual effect for lactation record 1 of cow k i n contemporary group i with bST status j .
Model 3: bST administration used to create contemporary groups. For data sets 1 and 2:
where J , , is lactation record of cow j in conteinporary group i,
HYMbl is fixed effect of the combination of herd-year-month of calving and bST status (con-
temporary group i),
a, is randoni additive genetic value of cow j, and
e, is randoni residual effect for record of cow j in contemporary group i.
Bovine solnatotropin impact on sire rankings
y, = HYMb,
+
3
+
cJ+
e,,where yu1, is the kth lactation record of cow j in contemporary group i,
HYMbl is fixed effect of contemporary group i (herd-year-month of calving and bST status),
a, is random additive genetic value of cow j ,
cl is random permanent environmental effect of cow j , and
el, is random residual effect for lactation record k of cow j in contemporary group i.
The general equation for the aniinal inodel used for estimation of genetic parameters for data sets 1 and 2 was
where 4 is the vector of lactation records,
fl
is the vector of fixed effects,a is the vector of random additive genetic values of the animals, X and Z are ltnown design matrices, and
e is the vector of random residual effects.
The general equation for the aniinal inodel used for estimation of genetic parameters for data set 3 was:
where 4 is the vector of lactation records, p i s the vector of fixed effect,
a is the vector of random additive genetic effects of the animals,
c is the vector of permanent environmental effect of cows with records, X , Z,, and Z, are ltnown design matrices, and
e is the vector of random residual effects.
The first inoinents for all models were assumed to be E(y) = X[3. The first moments and second inoinents from the means for random effects for data sets 1 and 2 were:
and
First and second inoinents for parities 3 to 5 with one or more records for each aniinal were assumed to be:
A. Al-Seaf et al. 84
where A is the inatrix of numerator relationships ainong animals augmented for animals without records (such as sires) which contribute to relationships among animals with records,
Ic is an identity inatrix with order equal to the nuinber of cows with records, In is an identity inatrix with order equal to the nuinber of records
is additive genetic variance,
is permanent environmental variance, and is residual variance.
Variance components for random effects were estimated using a derivative free REML algorithm (Graser et al., 1987) with the computer program (MTDFREML) developed by Boldrnan et al. (1995). Local convergence was considered to be met if the variance of the -2 log lilteli- hoods in the simplex was less than 1 x 10-(I. After first convergence, restarts were made to find global convergence with convergence declared when the values of -2 log liltelihood did not change to the second decimal. Breeding values were estimated for all animals for all data sets. The EBV for sires were examined for effect of models on ranlting of sires.
Sires with bST-treated daughters were ranlted from high to low based on the EBV for each model and trait. Fractions of sires in common for the high 10 to 25% of EBV were compared with the three models. Correlations were calculated for sires between EBV for pairs of models for all data sets.
RESULTS AND DISCUSSION
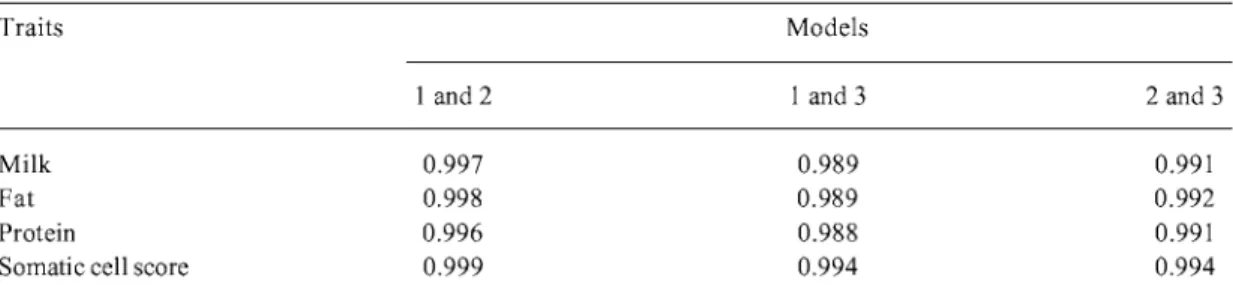
Correlations ainong estimated breeding values for milk yield for sires with daughters treated with bST for pairs of the three different inodels using the three data sets are shown in Tables 2, 3 and 4. Correlations between pairs of two inodels (1 and 2), (1 and 3) and (2 and 3) for parity one were 0.997,0.989 and 0.991; for parity two were 0.998,0.989 and 0.990, and for lactations 3 to 5 were 0.997, 0.988 and 0.991, respectively.
Table 2. Col-relations among estimated breeding halues for yield traits and solnat~c cell score for sires with the three models for parity one.
Traits Models
1 and 2 1 and 3 2 and 3
Milk Fat Protein
Somatic cell score
For Model I , bovine somatotropin (bST) injection n-as ignored: for Model 2. bST i~ijection or not Ivas a fixed effect, and for Model 3, bST injection or not n-as used to form contemporary groups.
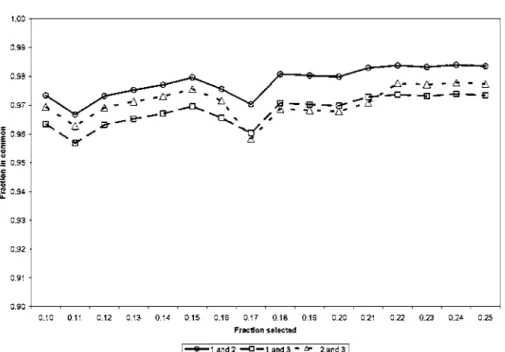
The fractions of sires having bST-treated progeny in common based on rankings with EBV for pairs of the three different niodels (1 and 2), (1 and 3) and (2 and 3) for milk yield for parity one are shown in Figure 1. The fractions to select based on raiiking by EBV raiiged from 0.10 to 0.25. The fractions of sires in coininoil with Models 1 and 2 raiiged from 0.965 to 0.985;
Bovine solnatotropin impact on sire rankings 85 Table 3. C o ~ ~ e l a t i o n s alnong estimated breeding halues for yield traits and solnatlc cell score for sires with the three models for parity two.
Traits Models
1 and 2 1 and 3 2 and 3
Milk Fat Protein
Somatic cell score
For Model I , bovine somatotropin (bST) injection n-as ignored: for model 2. bST i~ijection or not n-as a fixed effect. and for Model 3, bST injection or not n-as used to form contemporary groups.
Table 4. Correlations alnong estimated breeding halues for yield traits and solnatlc cell score for sires with the three
models for lactations 3 to 5.
Traits Models
1 and 2 1 and 3 2 and 3
Milk Fat Protein
Somatic cell score
For Model I , bovine somatotropin (bST) injection n-as ignored: for Model 2. bST i~ijection or not Ivas a fixed effect, and for Model 3, bST injection or not n-as used to form contemporary groups.
with Models 1 and 3, from 0.947 to 0.971, and with Models 2 and 3 from 0.959 to 0.974. For fractions selected by rankings on EBV from 0.14 to 0.19, fractions of sires in common between Models 1 and 3 and Models 2 and 3 were nearly identical.
For parity two, fractions of sires in common based on ranltings with EBV for pairs of the three different inodels (1 and 2), (1 and 3) and (2 and 3) for milk yield are shown in Figure 2. Fractions in coininon with Models 1 and 2 were 0.977 to 0.989, for Models 1 and 3 were 0.949 to 0.962, and for Models 2 and 3 were 0.955 to 0.968. For fractions selected from 0.13 to 0.20, the fractions of sires in coininon between Models 1 and 3 and Models 2 and 3 were nearly identical.
For data set 3, fractions of sires in common based on ranltings with EBV for pairs of the three different inodels (1 and 2), (1 and 3) and (2 and 3) for milk yield are shown in Figure 3. Fractions of sires in common with Models 1 and 2 were 0.964 to 0.978, with Models 1 and 3 were 0.935 to 0.956, and with Models 2 and 3 were 0.949 to 0.964.
Correlations among EBV for fat yield of sires with bST-treated daughters with the three models using the three data sets are also sliowii in Tables 2, 3 aiid 4. Correlatioiis between EBV for pairs of two inodels (1 and 2), (1 and 3) aiid (2 and 3) for parity one were 0.998,0.989 and 0.992; for parity two were 0.999, 0.991 aiid 0.992, aiid for lactatioiis 3 to 5 were 0.997,
0.998 and 0.991, respectively.
A. Al-Seaf et al.
-7
-0 1 -0 0 1 1 0 1 2 O t 3 0 1 4 0 1 5 015 0 1 7 0 1 6 0 1 9 U2O 0 2 1 0 7 2 U 2 ? 0 2 4 0 2 5
Fractbn s c l ~ t c d
Figure 1 . Fractions of sires (1,366 total sires) in common for different fractions selected based on ranlzings on estimating
breeding values n-ith pairs of the three models (I and 2), (1 and 3) and (2 and 3) for millz yield for parit) one. For Model I , bovine somatotropin (bST) injection n-as ignored: for Model 2. bST i~ijection or not Ivas a fixed effect. and for Model 3, bST injection or not n-as used to form contemporary groups.
Figure 2. Fractions of sires (1,254 total sires) in common for different fractions selected based on ranlzings on estimating
breeding values with pairs of the t h e e models (1 and 2), (1 and 3 ) and (2 and 3 ) for milk yield for parity two. For Model 1, bovine sonlatotropin (bST) injection was ignored; for Model 2, bST injection or not was a fixed effect, and for Model
Bovine solnatotropin impact on sire rankings (I 9: 0 9 1 0 o y : 90
1
0 1 0 0 1 1 0 1 2 1113 0 1 4 0 1 5 0 1 6 0 1 7 0 1 8 0 1 3 0 2 0 0 1 1 0 2 2 0 2 3 0 2 4 0 2 5 FracUon selected - 1 a n d ? 4 - 1 and 3 - ,'- l a n d 3 1Figure 3. Fractions of sires (1,351 total sires) in common for different fractions selected based on ranlzings on estimating
breeding values n-ith pairs of the three models ( I and 2), (1 and 3) and (2 and 3) for millz yield for lactations 3 to 5. For Model I , bovine somatotropin (bST) injection n-as ignored: for Model 2. bST injection or not n-as a fixed effect. and for Model 3, bST injection or not n-as used to form contemporary groups.
Fractions of sires in coininon based on ranltings with EBV for pairs of the three differ- ent inodels (1 and 2), (1 and 3) and (2 and 3) for fat yield for parity one are shown in Figure 4. The fractions of sires in common with Models 1 and 2 were from 0.984 to 0.992, with Models 1 and 3 were from 0.952 to 0.969, and with Models 2 and 3 were from 0.949 to 0.974.
For parity two, fractions of sires in common based on ranltings with EBV for pairs of the three different inodels (1 and 2), (1 and 3) and (2 and 3) for fat yield are shown in Figure 5. Fractions of sires in common with Models 1 and 2 were 0.984 to 0.992, with Models 1 and 3 were 0.946 to 0.971, and with Models 2 and 3 were 0.949 to 0.974.
For lactations 3 to 5, fractions of sires in coininon with pairs of the three different inodels (1 and 2), (1 and 3) and (2 and 3) for fat yield are shown in Figure 6. Fractions of sires in coininon with Models 1 and 2 were 0.966 to 0.984, with Models 1 and 3 were 0.957 to 0.974, and with Models 2 and 3 were 0.962 to 0.977.
Correlations among estimated breeding values for protein yield of sires with bST-treated daughters with the three inodels using the three data sets are also shown in Tables 2, 3 and 4. Correlations between EBV for pairs of two inodels (1 and 2), (1 and 3) and (2 and 3) were: for parity one 0.996,0.988 and 0.991; for parity two 0.998,0.988 and 0.990, and for lactations 3 to 5 0.996,0.987 and 0.990, respectively.
Fractions of sires in coninion based on rankings with EBV for pairs of the three differ- ent models (1 and 2), (1 and 3) and (2 and 3) for protein yield for parity one are shown in Figure 7. The fractions of sires in coininoil with Models 1 and 2 were from 0.974 to 0.983, wit11 Models 1 and 3 were froni 0.945 to 0.967, and with Models 2 and 3 were from 0.953 to 0.970.
A. Al-Seaf et al.
> .."
0 1 0 0 1 1 0 1 2 0 1 3 Old 0 1 5 0 1 6 017 0 1 8 01Y 0 2 0 0 2 1 0 1 2 0 2 3 0 ? d 0 2 5
Frffllon selwted - 1 and 2 - 0 - 1 and 3
-
8- ?and3 1Figure 4. Fractions of sires (1,366 total sires) in common for different fractions selected based on ranlzings on estimating
breeding values n-ith pairs of the three models ( I and 2), (1 and 3) and ( 2 and 3) for millt yield for parit) one. For Model I , bovine somatotropin (bST) injection n-as ignored: for Model 2. bST i~ijection or not Ivas a fixed effect. and for Model 3, bST injection or not n-as used to form contemporary groups.
Fraction selected
Figure 5. Fractions of sires (1,254 total sires) in common for different fractions selected based on ranlzings on estimating
breeding values n-ith pairs of the three models ( I and 2), (1 and 3) and ( 2 and 3) for millz yield for parity two. For Model I , bovine somatotropin (bST) injection n-as ignored: for Model 2. bST i~ijection or not Ivas a fixed effect. and for Model 3, bST injection or not n-as used to form contemporary groups.
Bovine solnatotropin impact on sire rankings
Figure 6 . Fractions of sires (1,351 total sires) in common for different fractions selected based on ranlzings on estimating
breeding values n-ith pairs of the three models ( I and 2), (1 and 3) and ( 2 and 3) for millz yield for lactations 3 to 5. For Model I , bovine somatotropin (bST) injection n-as ignored: for Model 2. bST injection or not n-as a fixed effect. and for Model 3, bST injection or not n-as used to form contemporary groups.
0 90
0 1 0 011 0 1 2 0 1 3 014 0 1 5 0 1 6 0 1 7 O l e 019 0 2 0 O ? l 0 2 2 023 024 0 2 5
F r a d o n selected
Figure 7. Fractions of sires (1,366 total sires) in common for different fractions selected based on ranlzings on estimating
breeding values n-ith pairs of the three models ( I and 2), (1 and 3) and ( 2 and 3) for millz yield for parit) one. For Model I , bovine somatotropin (bST) injection n-as ignored: for Model 2. bST i~ijection or not Ivas a fixed effect. and for Model 3, bST injection or not n-as used to form contemporary groups.
A. Al-Seaf et al. 90
For parity two, fractions of sires in common based on ranltings with EBV for pairs of the three different inodels (1 and 2), (1 and 3) and (2 and 3) for protein yield are shown in Figure 8. Fractions in coininon with Models 1 and 2 were 0.974 to 0.984, with Models 1 and 3 were 0.953 to 0.967, and with Models 2 and 3 were 0.960 to 0.972.
Figure 8. Fractions of sires (1,254 total sires) in common for different fractions selected based on ranlzings on estimating
breeding values n-ith pairs of the three models ( I and 2), (1 and 3) and (2 and 3) for millz yield for parity two. For Model I , bovine somatotropin (bST) injection n-as ignored: for Model 2. bST i~ijection or not Ivas a fixed effect. and for Model
3, bST injection or not n-as used to form contemporary groups.
For lactations 3 to 5, fractions of sires in coininon based on ranltings with EBV for pairs of the three different inodels (1 and 2), (1 and 3) and (2 and 3) for protein yield are shown in Figure 9. Fractions of sires in common with Models 1 and 2 were 0.958 to 0.976, with Models 1 and 3 were 0.943 to 0.954, and with Models 2 and 3 were 0.956 to 0.964.
Correlations among estimated breeding values for SCS of sires with bST-treated daughters with the three inodels using the three data sets are also shown in Tables 2, 3 and 4. Correlations between pairs of two inodels (1 and 2), (1 and 3) and (2 and 3) were: for parity one 0.999,0.994 and 0.994; for parity two 0.999,0.993 and 0.993, and for lactations 3 to 5 0.979,0.97 1 and 0.991, respectively.
Fractions of sires in coininon based on ranltings with EBV for pairs of the three differ- ent inodels (1 and 2), (1 and 3) and (2 and 3) for SCS for parity one are shown in Figure 10. Fractions of sires in common with Models 1 and 2 were from 0.993 to 0.998, with Models 1 and 3 were from 0.967 to 0.982, and with Models 2 and 3 were from 0.967 to 0.983.
For parity two, fractioiis of sires in coniinoii based on rankings witli EBV for pairs of the three different models (1 and 2), (1 and 3) and (2 and 3) for SCS are shown in Figure 11. Fractions of sires in coininoil with Models 1 and 2 were 0.993 to 0.997, witli Models 1 and 3 were 0.963 to 0.979, and with Models 2 and 3 were 0.963 to 0.978.
Bovine solnatotropin impact on sire rankings
Fraction selected
Figure 9. Fractions of sires (1,351 total sires) in common for different fractions selected based on ranlzings on estimating
breeding values n-ith pairs of the three models (I and 2), (1 and 3) and (2 and 3) for millt yield for lactations 3 to 5. For Model I , bovine somatotropin (bST) injection n-as ignored: for Model 2. bST injection or not n-as a fixed effect. and for Model 3, bST injection or not n-as used to form contemporary groups.
1-1 and 2 --0-1 and 3
-
* l a n d 3 10 90
Figure 10. Fractions of sires (1,366 total sires) in common for different fractions selected based on ranlzings on
estimating breeding values with pairs of the three models (1 and 2 ) , (1 and 3 ) and ( 2 and 3 ) for milk yield for parity one. For Model 1, bovine sonlatotropin (bST) injection was ignored; for Model 2 , bST injection or not was a fixed effect, and for Model 3, bST injection or not was used to form contemporary groups.
0 1 0 0 1 1 0 1 2 0 1 3 0 1 4 0 1 5 0 1 6 017 0 1 8 0 1 9 0 2 0 0 2 1 0 2 2 0 2 3 024 025
Genetics and Molecular Research 6 (1): 79-93 (2007) www.funpecrp.com.br Fraction rekcred
A. Al-Seaf et al.
- 1 and 2 - 0 - 1 and 3 ' * ?and3 1
Figure 1 1 . Fractions of sires (1,254 total sires) in common for different fractions selected based on ranlzings on
estimating breeding values n-ith pairs of the three models (I and 2). ( 1 and 3) and (2 and 3) for millt yield for parity two. For Model I , bovine somatotropin (bST) injection n-as ignored: for Model 2. bST i~ijection or not xvas a fixed effect, and for Model 3, bST injection or not n-as used to form contemporary groups.
- - -
0 1 0 0 1 1 0 1 2 0 1 3 014 0 1 5 016 0 1 7 O M 019 0 2 0 021 0 2 2 on 024 ox
Fmtbion selected
1-1 a n d 2 - ( 3 - 1 a n d 3 '
*
2 a n d 3 1t o o "
Figure 12. Fractions of sires (1,351 total sires) in c o ~ l ~ ~ l ~ o n for different fractions selected based on rankings on
estimating breeding x-alues with pairs of the three nlodels (1 and 2), ( 1 and 3) and (2 and 3) for milk yield for lactations 3 to 5. For Model 1, box-ine sonlatotropin (bST) injection was ignored: for Model 2, bST injection or not was a fixed effect, and for Model 3, bST injection or not was used to form contemporary groups.
099 - 0 9 8 - 0 'I
-
- - -
A * * - - v .. v-
9 =&-&A 9 &:-8( ' ABovine solnatotropin impact on sire rankings 93
For lactations 3 to 5 , fractions of sires in coininon based on ranltings with EBV for pairs
of the three different inodels (1 and 2), (1 and 3 ) and (2 and 3 ) for SCS are shown in Figure 12.
Fractions in common with Models 1 and 2 were 0.990 to 0.998, with Models 1 and 3 were 0.980
to 0.988, and with Models 2 and 3 were 0.981 to 0.990.
The overall high correlations among estimated breeding values of sires with different inodels for effect of bST on yield traits and on somatic cell score with the three data sets (parity one, parity two, and lactations 3 to 5 ) show that differences in the three models had little impact
on which sires would have been selected.
Future research should be designed to examine the effects of bST on estimates of the genetic parameters including genetic correlations between production traits and SCS for the three ways of including bST effects in the animal models.
REFERENCES
Al-Jumaah RS (2001). Influences of using bovine sonlatotropin on estimates of genetic paranleters and genetic evaluation of dairy cows. Ph.D. dissertation, University of Nebraska, Lincoln.
Baunlan DE (1992). Bovine somatotropin: review of an emerging animal technology. J. Dairy Sci. 75: 3432- 345 1.
Baunlan DE, Eppard PJ, DeGeeter MJ and Lanza G M (1985). Responses of high-producing dairy cows to long-term treatnlent with pituitary sonlatotropin and reconlbinant somatotropin. J. Dairy Sci. 68:
1352-1362.
Baunlan DE, Everett RW, Weiland WH and Collier RJ (1999). Production responses to bovine somatotro- pin in northeast daily herds. J. Daily Sci. 82: 2564-2573.
Boldman ICG ICriese LA, Van Vleck LD and Van Tassell CP (1 995). A manual for use of MTDFREML. A set of progranls to obtain estinlates of variances and covariances [Draft]. ARS, USDA, USMARC, Clay Center, Nebraska.
Burnside E and Meyer IC (1988). Potential inlpact of bovine sonlatotropin on dairy sire evaluation. J. Dairy
Sci. 71:2210-2219.
Chalupa W, ICutches A, Swager D, Lehenbauer T, et al. (1988). Responses of cows in conlnlercial daily to somatotropin. J. Daily Sci. 7 1 : 2 10.
Eppard PJ, Baunlan DE and McCutcheon SN (1985). Effect of dose of bovine growth hornlone on lactation of dairy cows. J. Daily Sci. 68: 1 109- 1 1 15.
Frangione T and Cady RA (1988). Effect of bovine sonlatotropin on sire summaries for nlilk production and nlilk yield heritability. J. Daily Sci. 71: 239.
Graser HU, Snlith SP and Tier B (1987). A derivative-free approach for estimating variance components in animal nlodels by restricted nlaxinlunl likelihood. J. Alziri~. Sci. 64: 1362-1370.
Hal-tnell GF, Franson SE, Baunlan DE, Head HH, et al. (1991). Evaluation of sometribove in a prolonged- release systenl in lactating dairy cows - production responses. J. Dairy Sci. 74: 2645-2663.
Jordan DC, Aguilar AA, Olson JD, Bailey C, et al. (1991). Effects of recombinant methionyl box m e ' soma-
totropin (sometribove) in high producing cows nlilked three tinles daily. J. Dairy Sci. 74: 220-226. Nytes AJ, Conlbs DIC, Shook GE, Shaver RD, et al. (1990). Response to recombinant bovine sonlatotropin
in daily cows with different genetic merit for nlilk production. J. Dairy Sci. 73: 784-79 1. Peel CJ and Baunlan DE (1987). Somatotropin and lactation. J. Dairy Sci. 70: 474-486.
Soderholnl CG, Otterby DE, Linn JG, Ehle FR, et al. (1988). Effects of recombinant bovine sonlatotropin on nlilk production, body composition, and physiological parameters. J. Dairy Sci. 7 1 : 355-365. Tsuluta S, ICeown JF, Van Vleck LD and Misztal I (2000). Bias in genetic evaluations by records of cows
treated with bovine somatotropin. J. Daily Sci. 83: 2650-2656.
Weigel IL4, Fisher TM, Van der LC, Gianola D, et al. (1998). Inlpact of bovine sonlatotropin on genetic evaluation of dairy sires and cows. J. Daily Sci. 8 1 : 2045-205 1.