A FRAMEWORK TO MINIMIZE SYSTEMIC INDEBTEDNESS: A FINANCIALISATION THEORETICAL PERSPECTIVE
by
LEHLOHONOLO GABRIEL MAMBONA
submitted in accordance with the requirements for the degree
of
DOCTOR OF BUSINESS LEADERSHIP at the
UNIVERSITY OF SOUTH AFRICA
SUPERVISOR: PROFESSOR PHILIP SERUMAGA-ZAKE
TABLE OF CONTENTS
LIST OF ACRONYMS ... VII ACKNOWLEDGEMENTS ... VIII DECLARATION ... IX ABSTRACT ... X
CHAPTER 1: ORIENTATION ... 12
1.0INTRODUCTION ... 12
1.1BACKGROUNDTOTHESTUDY ... 13
1.2RATIONALEFORTHESTUDY ... 18
1.3PROBLEMSTATEMENT ... 19
1.4RESEARCHQUESTIONS ... 20
1.5PURPOSEOFTHESTUDY ... 20
1.6OBJECTIVESOFTHERESEARCH ... 20
1.7RESEARCHDESIGN ... 21
1.8ASSUMPTIONS ... 21
1.9STRUCTUREANDCONTENTOFTHERESEARCH ... 22
1.10CONCLUDINGREMARKS ... 23
CHAPTER 2: CONTEXTUAL BACKGROUND ... 24
2.0INTRODUCTION ... 24
2.1GLOBALBANKINGENVIRONMENT... 24
2.2SOUTHAFRICANBANKINGENVIRONMENT ... 28
2.2 1 South African banking system and the major commercial banks ... 32
2.2.2 Trend Analysis of Factors influence Monetary Policy ... 40
2.3 THE SOUTH AFRICAN ECONOMIC CONTEXT ... 43
2.3.1 Economic Indicators ... 44
2.3.2 Main Industry Sectors ... 45
2.3.3 Economic Activity by Sector ... 46
2.3.4 Socio Economic Context... 47
2.4SUMMARY ... 48
CHAPTER 3: LITERATURE REVIEW – THEORETICAL AND CONCEPTUAL FRAMEWORKS ... 49
3.0 INTRODUCTION ... 49
3.1THEORETICALFRAMEWORK:FINANCIALISATION ... 49
3.1.1 Financialisation: The Liberal Perspective ... 51
3.1. 3 Financialisation and indebtedness ... 63 3.2CONCEPTUALFRAMEWORK ... 74 3.3 CONCLUDINGREMARKS ... 75 CHAPTER 4 ... 77 RESEARCH METHODOLOGY ... 77 4.0 INTRODUCTION ... 77
4.1PHILOSOPHICALISSUES:CRITICALREALISM ... 79
4.2 RESEARCHDESIGN ... 80
4.3DATADESCRIPTION ... 81
4.4VARIABLEMEASURESANDDATASOURCE... 82
4.5ADDRESSINGSTUDYOBJECTIVESANDMODELSPECIFICATION ... 83
4.5.1 Addressing Objective 1 ... 83 4.5.2 Addressing Objective 2 ... 83 4.5.3 Addressing Objective 3 ... 83 4.6MODELESTIMATION ... 84 4.7 ETHICALCONSIDERATIONS ... 87 4.8 CONCLUSION ... 88
CHAPTER 5: ANALYSIS AND RESULTS ... 89
5.0INTRODUCTION ... 89
5.1DESCRIPTIVESTATISTICS ... 89
5.1.1 Graphical presentation of economic development variables ... 89
5.1.2 Graphical presentation of household debt ... 90
5.1.3 Graphical presentation of financialisation variables ... 92
C. ASSET PRICE VOLATILITY ... 93
5.1.4 Descriptive statistics of the study variables ... 95
5.2CHECKINGDATAFORAUOTOCORRELATION ... 96
5.2.1 Checking Household indebtedness time series for autocorrelation... 96
5.2.2 Checking Human development Index time series for autocorrelation ... 97
... 98
5.2.3 Checking financial reform index time series for autocorrelation... 98
5.2.4 Checking stock of foreign liabilities time series for autocorrelation ... 99
5.2.5 Checking asset price volatility time series for autocorrelation ... 99
5.2.6 Checking stock market value traded time series for autocorrelation ... 100
5.3UNITROOTTESTS... 100
5.3.1 Unit root test of household indebtedness series ... 102
5.3.3 Unit root test of foreign financial inflows series ... 104
5.3.4 Unit root test of asset price volatility series ... 105
5.3.5 Unit root test of financial reform index series ... 106
5.3.6 Unit root test of stock market value traded series ... 107
5.4TRANSFORMINGNONSTATIONARYSERIES ... 108
5.5FINDINGSRELATEDTOOBJECTIVEONE ... 108
5.5.1 Foreign financial inflows 1990-2008 vs 2009-2017 ... 109
5.5.2 Asset price volatility 1990-2008 vs 2009-2017 ... 110
5.5.2 Stock market value traded 1990-2008 vs 2009-2017 ... 112
5.6FINDINGSRELATEDTOOBJECTIVETWO... 113
5.6FINDINGSRELATEDTOOBJECTIVETHREE ... 114
5.6.1 Error correction model 1: Effects of indebtedness and deregulation on economic development ... 115
5.6.2 Error correction model 2: Effects of indebtedness and foreign financial inflows on economic development ... 116
5.6.3 Error correction model 3: Effects of indebtedness and asset price volatility on economic development ... 118
5.6.4 Error correction model 4: Effects of indebtedness and stock market value traded on economic development ... 119
5.7INDEBTEDNESS FRAMEWORK ... 121
5.8CONCLUDING REMARKS ... 122
CHAPTER 6: DISCUSSION AND CONCLUSIONS ... 123
6.0 INTRODUCTION ... 123
6.1DISCUSSIONANDCONCLUSIONS:OBJECTIVE1 ... 123
6.2DISCUSSIONANDCONCLUSIONS:OBJECTIVE2 ... 125
6.3DISCUSSIONANDCONCLUSION:OBJECTIVE3 ... 130
6.4CONTRIBUTIONTOKNOWLEDGE ... 131
6.5POLICYIMPLICATIONSANDRECOMMENDATIONS ... 132
7.9 LIMITATIONSOFTHESTUDY ... 137
7.10 FUTURESTUDY ... 138
REFERENCES ... 140
APPENDIX1:TIMESERIESSTUDYDATA(1990-2017) ... 157
APPENDIX2:TIMESERIESSTUDYDATA2008-2017 ... 158
LIST OF TABLES
TABLE 1:MARKET CAPITALIZATION AND P/ERATIO ... 36
TABLE 2:ECONOMIC INDICATORS ... 44
TABLE 3:ECONOMIC ACTIVITY BY SECTOR ... 46
TABLE 4:COMPARING FINANCIALISATION OF THE SAECONOMY TO OTHER EMERGING ECONOMIES (1997-2015) ... 74
TABLE 5:DATA SOURCE AND A PRIORI EXPECTATIONS ... 82
TABLE 6:DESCRIPTIVE STATISTICS OF THE STUDY VARIABLES (1990-2017) ... 96
TABLE 7:HOUSEHOLD INDEBTEDNESS UNIT ROOT TEST RESULTS ... 102
TABLE 8:HUMAN DEVELOPMENT INDEX SERIES UNIT ROOT TEST RESULTS ... 102
TABLE 9:FOREIGN FINANCIAL INFLOWS SERIES UNIT ROOT TEST RESULTS ... 104
TABLE 10:UNIT ROOT TEST RESULTS FOR ASSET PRICE VOLATILITY SERIES ... 105
TABLE 11:UNIT ROOT TEST RESULTS FOR FINANCIAL REFORM INDEX SERIES ... 106
TABLE 12:UNIT ROOT TEST RESULTS FOR STOCK MARKET VALUE TRADED SERIES ... 107
TABLE 13:1ST DIFFERENCE AND 2ND DIFFERENCE SERIES STATISTICS ... 108
TABLE 14:ANOVA FOREIGN FINANCIAL INFLOWS ... 109
TABLE 15:ANOVAASSET PRICE VOLATILITY PRE AND POST 2008 FINANCIAL CRISIS... 111
TABLE 16:ANOVA- STOCK MARKET VALUE TRADED ... 113
TABLE 17:GRANGER CAUSALITY TEST -FINANCIALISATION AND INDEBTEDNESS ... 114
TABLE 18:ERROR CORRECTION MODEL 1 FINDINGS ... 115
TABLE 19:ERROR CORRECTION MODEL 2 FINDINGS ... 117
TABLE 20:ERROR CORRECTION MODEL 3 FINDINGS ... 118
TABLE 21:ERROR CORRECTION MODEL 4 FINDINGS ... 120
LIST OF FIGURES FIGURE 1:CREDIT AND STORE CARD DEBT MORE THAN 120 DAYS... 13
FIGURE 2:INEQUALITY IN SOUTH AFRICA ... 14
FIGURE 3:HUMAN DEVELOPMENT INDEX BY COUNTRY (1990-2017) ... 15
FIGURE 4:UNEMPLOYMENT RATE IN SOUTH AFRICA (2002-2008) ... 16
FIGURE 5:INFLATION RATE IN SOUTH AFRICA 2002-2017... 16
FIGURE 6:TOTAL CREDIT EXTENDED TO PRIVATE SECTOR 2002-2017 ... 17
FIGURE 7:PUBLIC DEBT TO GDP ... 18
FIGURE 8:ABSA ... 38
FIGURE 9:STANDARD BANK ... 39
FIGURE 10:NEDBANK... 39
FIGURE 12:FNB ... 40
FIGURE 13:TOTAL CREDIT EXTENDED TO PRIVATE SECTOR 2002-2017 ... 41
FIGURE 14:PUBLIC DEBT TO GDP ... 42
FIGURE 15:UNEMPLOYMENT RATE 2002–2018 ... 43
FIGURE 16:INFLATION RATE 2002-2018 ... 43
FIGURE 17:CONCEPTUAL FRAMEWORK OF THIS STUDY ... 75
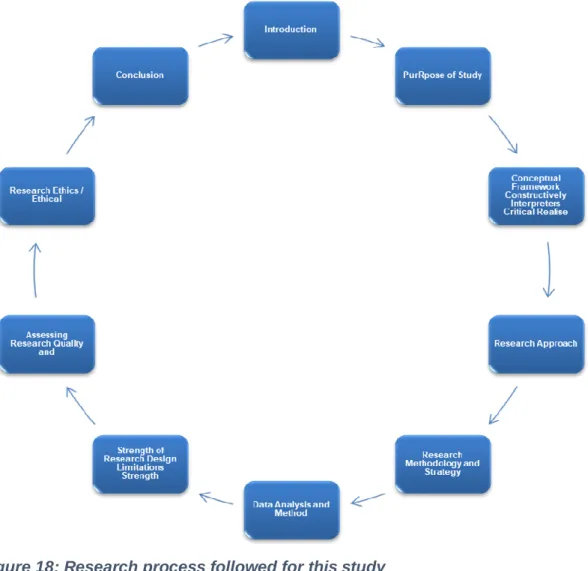
FIGURE 18:RESEARCH PROCESS FOLLOWED FOR THIS STUDY ... 78
FIGURE 19:STUDY DESIGN ... 81
FIGURE 20:VARIABLES OF THIS STUDY ... 81
FIGURE 21:GDP(ZARMILLION)1990-2017 ... 89
FIGURE 22:HUMAN DEVELOPMENT INDEX FOR SOUTH AFRICA (1990-2017) ... 90
FIGURE 23:HOUSEHOLD LOAN (%GDP) ... 91
FIGURE 24:HOUSEHOLD DEBT TO DISPOSABLE INCOME (1990-2017) ... 91
FIGURE 25:GRAPHICAL PRESENTATION OF FINANCIAL DEREGULATION (1990-2005) ... 92
FIGURE 26:FOREIGN FINANCIAL INFLOWS (1990-2017) ... 93
FIGURE 27:ASSET PRICE VOLATILITY (1990-2017) ... 94
FIGURE 28:STOCK VALUE TRADED (% OF GDP)(1990-2017) ... 95
FIGURE 29:HOUSEHOLD INDEBTEDNESS CORRELOGRAM ... 97
FIGURE 30:HUMAN DEVELOPMENT INDEX SERIES CORRELOGRAM ... 98
FIGURE 31:FINANCIAL REFORM INDEX CORRELOGRAM ... 98
FIGURE 32:STOCK OF FOREIGN LIABILITIES ... 99
FIGURE 33:ASSET PRICE VOLATILITY CORRELOGRAM ... 99
FIGURE 34:STOCK MARKET VALUE TRADED SERIES CORRELOGRAM ... 100
FIGURE 35:EXTENT OF FINANCIALISATION - FOREIGN FINANCIAL INFLOWS ... 109
FIGURE 36:EXTENT OF FINANCIALISATION ASSET PRICE VOLATILITY ... 111
FIGURE 37:EXTENT OF FINANCIALISATION - STOCK MARKET VALUE TRADED... 112
FIGURE 38:ACTUAL FITTED RESIDUAL GRAPH FOR MODEL 1 ... 116
FIGURE 39:ACTUAL FITTED RESIDUAL GRAPH FOR MODEL 2 ... 117
FIGURE 40:ACTUAL FITTED RESIDUAL GRAPH FOR MODEL 3 ... 119
FIGURE 41:ACTUAL FITTED RESIDUAL GRAPH FOR MODEL 4 ... 120
FIGURE 42:INDEBTEDNESS FRAMEWORK ... 121
LIST OF ACRONYMS
ABSA Amalgamated Banks of South Africa BASA Banking Association of South Africa BIS Bank of International Settlement CDC Credit Default SwapsCDO Collateralized Debt Obligation FNB First National Bank
FSB Financial Services Board GCM Global Credit Market GDP Gross Domestic Product
IIF International Institute of Finance IMF International Monetary Fund ING International Netherlands Group JSE Johannesburg Stock Exchange NCR National Credit Regulator
NM Neo Marxists
RM Revolutionary Marxists
ROE Return on Equity
SARB South African Reserve Bank WFE Federation of Exchanges
ACKNOWLEDGEMENTS
I would like to give a special thanks to my Supervisor, Professor Philip Serumaga-Zake for the immense contribution he made in this doctoral thesis. The statistical and econometric expertise brought into this study during our monthly sessions ensured that the research remained on course despite the challenges that were confronted along the way. I am also thankful to Professor Noel Ngwenya whose guidance and coaching especially when the pressure became unbearable, was indispensable. I would also like to extend my gratitude to Tumi Seopa whose administrative support at the SBL was incredible.
Data collection was the toughest challenge, and in this regard, I would like to extend my gratitude to Professor Msweli for her assistance in the collection and analysis of the data under extreme difficult circumstances. Thank you, Alison Fourie, for providing exceptional secretarial services ensuring that all the due dates were met without fail.
This dissertation is dedicated to my late beloved parents Mapule and Tabane Mampone without whom this journey could never have been undertaken. May this work also serve as a great inspiration to all my beloved children and grand-children, my sister, brother in-law, immediate and extended family, who gave me unwavering support and stood by me during extraordinary personal challenges.
Above all, I thank God of my Ancestors who breathed unto me hope, resilience and faith throughout this demanding academic exercise. Thank You God.
DECLARATION
I declare that the thesis “A Framework to Minimize Systemic Indebtedness: A
Financialisation Theoretical Perspective” is my own work and that all the sources that I have used or quoted have been indicated and acknowledged by means of complete references. This research has not been previously accepted for any degree and is not being currently submitted in candidature for any degree.
Signed……… Date……….
ABSTRACT
The purpose of this study is to develop an indebtedness framework that explains the effects of financialisation and household indebtedness on economic development. For this purpose, the study empirically examines annual South African data covering the years 1990-2017 to look at the effect of financialisation before and after the 2007/08 financial crisis. South Africa adopted an inflation targeting monetary policy regime in the 1990s before the global economic crisis in response to the global financial crisis of 2007-08. Examining data from 1990-2017 made it possible to look at the effects of financial deregulation policies that were introduced post the 2007-08 financial meltdown.
The study addressed three objectives. The first objective sought to establish the extent of financialisation in the South African economy pre and post the 2008 financial crisis. To achieve this objective, annual time series data from 1990-2017 on financialisation variables was split into two, before and after the financial crisis. Graphical presentations of the four financialisation variables (financial deregulation, foreign financial inflows, asset price volatility, and shift to market-based finance) showed that there was a difference in financialisation before and after the 2008 financial crisis. Analysis of variance showed that there is a statistically significant difference between the foreign financial inflows’ series before and after the financial meltdown of 2008 (t-test value -6.527, p ≤ 0.0001). (1990-2008). The findings also showed that there was no statistically significant difference between asset price volatility before and after the financial meltdown of 2008. Interestingly, there is a statistically significant difference between stock market value traded in the period from 1990-2008 and 2009-2017 after the financial crisis (t = -4.295, p ≤0.001).
The second objective sought to examine the causal direction between financialisation and household indebtedness. Contrary to a priori expectations, the findings showed that financial deregulation, foreign financial inflows and shift to market-based finance do not Granger cause indebtedness. However, the findings showed that the null hypothesis that asset price does not Granger
cause household indebtedness was rejected. This implies that there is a causal direction between asset price volatility and household indebtedness
Lastly, the third objective of this study was to explain the effects of financialisation and indebtedness on economic development to inform the indebtedness framework that this study set out to develop. Using annual data for the period of 1990 to 2017, the third objective was addressed by examining the effect of household indebtedness and financialisation on economic development. These effects were tested using OLS regression and error correction modelling technique (ECM) for each of the four financialisation variable: (1) financial deregulation measured using the financial reform index; (2) foreign financial inflows measured using stock of foreign liabilities as percentage of GDP; (3) asset price volatility; and (4) shift to market-based finance, measured using stock market value traded as percentage of GDP. The findings showed that foreign financial inflows and asset price index when regressed with household indebtedness showed a statistically significant effect on economic development in a long-run model. The indebtedness framework was duly presented showing that economic development is likely to be negatively and strongly affected by financialisation as experienced in asset price volatility and foreign financial inflows.
Keywords: Financialisation, Indebtedness, foreign financial inflows, asset price volatility, financial deregulation, market-based finance, economic development, human development index, financial system.
CHAPTER 1: ORIENTATION
1.0 INTRODUCTION
The purpose of this study is to shed light into the effects of systemic indebtedness and financialisation on income inequality in South African. To understand systemic indebtedness this study looks at the concept from a financialisation theoretical framework. The approach is shaped by several authors (Gloukovieczoff, 2006; Krippner, 2005; Servet and Saiag, 2013; Stockhammer, 2000) who have observed the interconnectedness between indebtedness and financialisation. Krippner (2005) defines financialisation as the increasing role of financial motives, financial markets, financial actors and financial institutions in the operation of the domestic and international economies. Gloukovieczoff, 2006 puts it simply as the growing necessity to use financial products to meet every day needs. For this reason, Kaworski and Stockhammer (2016) view household indebtedness as household financialisation.
Systemic indebtedness on the other hand refers to an economy which is sustained almost entirely by credit. Other scholars (Brennan and Gallagher, 2007; Gloukoviczoff, 2006; Schicks, 2013) look at indebtedness at household level and define the term as the inability to meet financial commitments. It is from the household outlook that Gutierrez-Nieto, Serrano-Cinca and Cuesta-Gonzalez (2016) view indebtedness as one of the main contributing factors in creating poverty.
If household indebtedness is viewed as household financialisation as indicated by Kaworski and Stockhammer (2016), how is this concept related to income inequality and financialisation of the economy? Other questions to ask include: What drives indebtedness? What are the pros and cons of household financialisation? The study seeks to address these questions in this study. First background information related to indebtedness is provided in the section below. Next, the rationale for the study is provided, which is followed by the
problem statement and corresponding research questions and objectives. The philosophical underpinnings and design of the study is briefly articulated and further expounded
1.1 BACKGROUND TO THE STUDY
In the past three decades, the world has witnessed an acute rise of interest in the operations of the financial markets in the economies of the world. This interest is related to the increase of financialisation and the globalization of systemic indebtedness, as well as the substantial deregulation of monetary policies in the market economies of the world (Lapavitsas, 2016).
Increase in financialisation coincided with the increase in inequality, after South Africa opened its economy in the 1990’s. James (2017) traces the origins of indebtedness to the colonial roots of labour market “South African capitalism”
when labourers were recruited to work in the mines. According to James (2017) wage advances, which resulted to indebtedness, were tied to labour procurement.
Figure 1: Credit and store card debt more than 120 days
(Source: Van Rensburg, D. (2018) Don't be fooled, there is a credit problem.
Furthermore, increase in indebtedness in South Africa overlaps with the increase in inequality. As Figure 1 shows Gini Coefficient increased from 59,3 in 1992 to 63 in 20014 (World Bank 2017).
Figure 2: Inequality in South Africa
Source :Data sourced from the World Bank (2018)
https://data.worldbank.org/indicator/SI.POV.GINI?locations=ZA
Literature has been consistent on the relationship between inequality, income, and education. For example, as early as in 1955, Kuznets (1955) argued that there is a long-term relationship between income inequality and the development process based on changes in the structure of different sectors in the economy. Much later Friedman and Friedman (1980) concurred with the view that inequality has a dampening effect of growth.
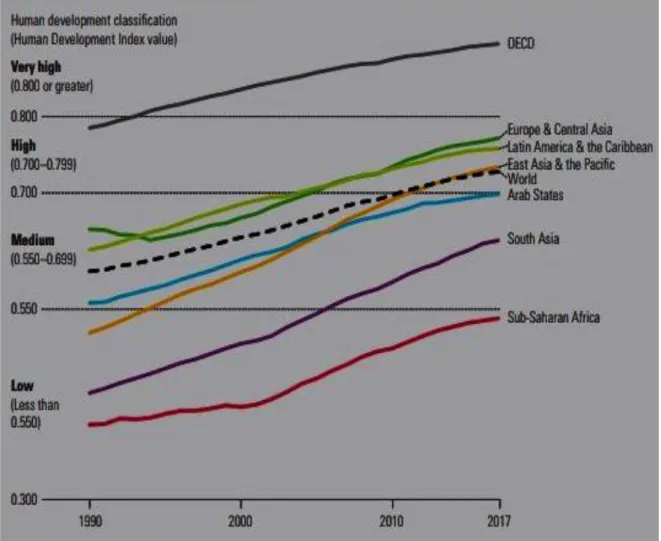
The human development index developed by the United Nations (UNDP, 2018) captures Income, education, and health achievements at a national level. Figure 3 shows human development levels by country from 1990- 2017. Sub-Saharan Africa shows the lowest levels of human development (around 0.550), as measured by the HDI, compared to the rest of the world (UNDP, 2018). OECD countries have HDI levels greater than 0.8, which is regarded as very high
Figure 3: Human Development Index by country (1990-2017)
Source: UNDP (2018) UNDP (2018). Human development indices and Indicators.
Income inequality and human development have been associated with unemployment in development economics literature (Bhorat, van der Westhuizen and Jacobs, 2009). It is not surprising that employment levels, corresponding to inequality, are high in South Africa.
The unemployment rate in South Africa has never been below 20% since 2002 according to Figure 5.3. The highest experiences were in 2002 which hit 29.3% and slowed down to the levels of 24% between 2004 to 2010. Unemployment rose to 25% in 2012 and 27.7% in 2017.
Figure 4: Unemployment rate in South Africa (2002-2008) Source: SARB 2018
The inflation rate went below zero (-4%) in 2003 to 2004 falling from two digit figures in 2002 (SARB, 2015). Inflation rate is uneven due to fluctuating consumer prices (SARB, 2015). In 2010 inflation accelerated to a maximum of 8.6% from 0.4% level in 2006 (SARB, 2015). However poor economic conditions dropped inflation rate to 3.4% in 2010 which struggled to rise above 5.5% levels from 2010 to 2017 (SARB, 2018).
Figure 5: Inflation rate in South Africa 2002-2017
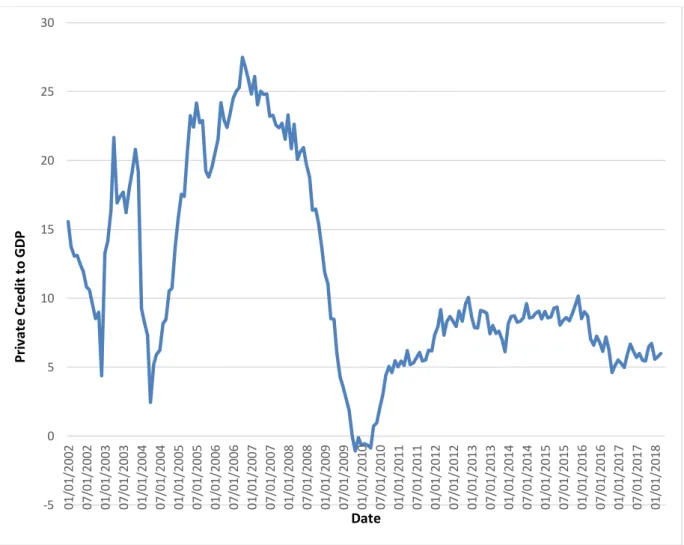
Figure 6 show the trends of instalment debtors, suspensive sales and leases, Instalment sale over per capita GDP, debt to GDP, unemployment rate, and
20 21 22 23 24 25 26 27 28 29 30 01 /0 1/ 20 02 09 /0 1/ 20 02 05 /0 1/ 20 03 01 /0 1/ 20 04 09 /0 1/ 20 04 05 /0 1/ 20 05 01 /0 1/ 20 06 09 /0 1/ 20 06 05 /0 1/ 20 07 01 /0 1/ 20 08 09 /0 1/ 20 08 05 /0 1/ 20 09 01 /0 1/ 20 10 09 /0 1/ 20 10 05 /0 1/ 20 11 01 /0 1/ 20 12 09 /0 1/ 20 12 05 /0 1/ 20 13 01 /0 1/ 20 14 09 /0 1/ 20 14 05 /0 1/ 20 15 01 /0 1/ 20 16 09 /0 1/ 20 16 05 /0 1/ 20 17 01 /0 1/ 20 18 R at e in % Date -6 -4 -2 0 2 4 6 8 10 12 14 0 1/ 0 1 /2 0 0 2 0 8/ 0 1 /2 0 0 2 0 3/ 0 1 /2 0 0 3 1 0/ 0 1 /2 0 0 3 0 5/ 0 1 /2 0 0 4 1 2/ 0 1 /2 0 0 4 0 7/ 0 1 /2 0 0 5 0 2/ 0 1 /2 0 0 6 0 9/ 0 1 /2 0 0 6 04 /0 1/ 20 07 1 1/ 0 1 /2 0 0 7 0 6/ 0 1 /2 0 0 8 0 1/ 0 1 /2 0 0 9 0 8/ 0 1 /2 0 0 9 0 3/ 0 1 /2 0 1 0 1 0/ 0 1 /2 0 1 0 0 5/ 0 1 /2 0 1 1 1 2/ 0 1 /2 0 1 1 0 7/ 0 1 /2 0 1 2 0 2/ 0 1 /2 0 1 3 09 /0 1/ 20 13 0 4/ 0 1 /2 0 1 4 11 /0 1/ 20 14 0 6/ 0 1 /2 0 1 5 0 1/ 0 1 /2 0 1 6 0 8/ 0 1 /2 0 1 6 0 3/ 0 1 /2 0 1 7 1 0/ 0 1 /2 0 1 7 R ate % Date
Inflation rate between 2002 and 2018. The credit extended to private sector was high between 2004 and 2008 with a maximum of above 25% in 2007. This sharply declined in 2008 to 2010 due to economic recession effects and never fully recovered from the effects of economic meltdown. From 2010 credit picked up by about 5% and remained consistent within 5%-10% of credit extended to private sector. In addition, 2003 and 2004 also saw a sharp decline due to a decline in economic growth confidence impacting on affordability. These anomalies dropped to below 5% in both 2003 and 2004. Thus 2005 to 2008 were lucrative in terms of credit extended to private sector compared to years post 2008.
Figure 6: Total credit extended to private sector 2002-2017
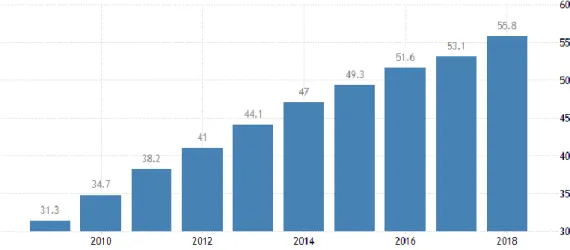
The debt to GDP on the other hand stood below 40% which improved to below 30% in 2007. However, the ratio began to rise above unacceptable levels from 30% in 2010 to 55% in 2017. This is due to high spend with a declining
-5 0 5 10 15 20 25 30 01 /0 1 /2 0 02 07 /0 1 /2 0 02 01 /0 1 /2 0 03 07 /0 1 /2 0 03 01 /0 1 /2 0 04 07 /0 1 /2 0 04 01 /0 1 /2 0 05 07 /0 1 /2 0 05 01 /0 1 /2 0 06 07 /0 1 /2 0 06 01 /0 1 /2 0 07 07 /0 1 /2 0 07 01 /0 1 /2 0 08 07 /0 1 /2 0 08 01 /0 1 /2 0 09 07 /0 1 /2 0 09 01 /0 1 /2 0 10 07 /0 1 /2 0 10 01 /0 1 /2 0 11 07 /0 1 /2 0 11 01 /0 1 /2 0 12 07 /0 1 /2 0 12 01 /0 1 /2 0 13 07 /0 1 /2 0 13 01 /0 1 /2 0 14 07 /0 1 /2 0 14 01 /0 1 /2 0 15 07 /0 1 /2 0 15 01 /0 1 /2 0 16 07 /0 1 /2 0 16 01 /0 1 /2 0 17 07 /0 1 /2 0 17 01 /0 1 /2 0 18 P ri va te C red it t o G D P Date
economic growth. The rise in the debt to GDP ratio is also attached to political instability and the country’s poor economic performance.
Figure 7: Public Debt to GDP
Source: National Treasury 2018
1.2 RATIONALE FOR THE STUDY
The economic outlook in South Africa as painted above signal structural problems that possibly affect indebtedness, and economic growth. According to a report by International Institute of Finance (IIF) (2018 first quarter), total global debt was $ 247 trillion, just over 318% of the world’s GDP. The records of IMF indicate that the banks and financial institutions have over recent years, extended credit facilities to individuals and businesses to a point of unmanageability. These figures sparked the interest of the researcher, to look at the role indebtedness has played in the poor growth rates of the South African economy. What started as a simple inquiry into indebtedness led to an understanding of the interconnectedness of indebtedness to financialisation (Lapavitsas, 2016; Servet and Saiag, 2013, Stockhammer, 2000). As argued below, the question that remained after a critical evaluation of literature was how financialisation enables or disables economic development? Out of this question emerged the rest of the research questions outlined below.
1.3 PROBLEM STATEMENT
According to Masso (2016) escalating private and public indebtedness can be examined as part of the historical trajectory of financialisation. Financialisation and systemic indebtedness as explained by Servet and Saiag (2013) are two sides of the same coin in that one cannot survive without the other. The financialisation of credit creation sits at the core of financial institutions’ wealth maximization (Lapavitsas, 2016). Stated differently, financialisation enhances highly profitable credit by leveraging assets and income optimally (Stockhammer, 2000). Servet and Saiag (2013) as well as Fine (2007) explain that at the base of financialisation and indebtedness is the monetisation of the economy which is due to the increased commodification of everyday needs. Aalbers (2017) and Kohl (2018) point out that financialisation does not only structurally transform economies and firms, but also households as they participate in the housing markets.
Servet and Saiag (2013) links indebtedness with the reversal of the roles where finance does not rely on production and trade, but on finance led accumulation regime. As explained by Servet and Saiag (2013), stock prices do not just determine household debt, but they also determine investment decisions, fiscal and monetary policy. This scenario poses a problem where volatility and instabilities ingrained in the financial markets befall businesses and households forcing them into protracted indebtedness (Stockhammer, 2000; Lapavitsas, 2016). Currie and Largoarde-Segot (2017, 214) put forward a contention that deregulation of financial markets “has enabled banks to focus on arbitrage within secondary markets by creating exotic and complex financial.
The productive sector of the economy, as explained by Stockhammer (2000) starts to shrink in a highly financialised economy, as it becomes more beholden to the financial sector. This shift has an adverse effect on employment, because as the productive sectors shrinks, unemployment and income inequality increase (Servet and Saiag, 2013). Servet and Saiag (2013) lament that the negative outcomes of financialisation create an “unstable equilibrium” where poverty becomes an outcome of inequality. Current studies have not looked at the impact of indebtedness and financialisation on development. As will be
discussed later, the increase in financialisation in South Africa coincides with a rise in indebtedness and inequality. While the impact of the apartheid system on inequality is indisputable, it is not clear whether indebtedness influences economic development positively or negatively. It is also not clear whether income inequality is an outcome of financialisation or not.
Servet and Saiag (2013), however do state that living standards are enabled or disabled by financialisation, and they also state that financialisation creates indebtedness but these relationships are not tested in literature. On the basis of this gap in knowledge this study seeks to shed light on how indebtedness, financialisation, and income inequality are linked in the South African economy.
1.4 RESEARCH QUESTIONS
Given the problem articulated above, this study seeks to address the following questions:
1. To what extent is the South African economy financialised? 2. How is financialisation linked to indebtedness?
3. What are the effects of household indebtedness and financialisation on economic development?
1.5 PURPOSE OF THE STUDY
The purpose of this research is to determine the extent to which financialisation aggravates indebtedness and consequently develop an indebtedness framework that sheds light into the link between financialisation, household indebtedness, economic development in South Africa. To achieve this aim, the study is designed to achieve the objectives outlined below.
1.6 OBJECTIVES OF THE RESEARCH
To determine the extent to which the South African economy is financialised.
Research Objective 2
To determine the causal direction of the relationship between financialisation and indebtedness.
Research Objective 3
To establish and explain the effects of household indebtedness and financialisation on economic development.
1.7 RESEARCH DESIGN
The purpose of this study is to develop an indebtedness framework that explains the effects of financialisation and household indebtedness on economic development. For this purpose, the study empirically examines South African data covering the years 1990-2017 to look at the effect of financialisation before and after the 2007/08 financial crisis. The study first tests the effect of financialisation on household indebtedness with the aim of identifying the causal direction of the two variables. Thereafter the study, develops an error correction model to test the effect of financialisation and household indebtedness on economic development. Human development index (HDI) was used as a proxy measure for economic development.
1.8 ASSUMPTIONS
This section discusses the theoretical and philosophical assumptions of this study. Theoretically, this study assumes that household financialisation (indebtedness) is motivated by the need to have a decent quality of life. Capital holders (owners of firms and managers) on the other hand are motivated by profit.
As will be explained in chapter four, this study takes a critical realism philosophical approach that there is a “real” world with characteristics, phenomena and elements that are not observable (Bhaskar, 2011). This
approach informs the epistemological stance of this study, where the indebtedness framework is constructed by first identifying financialisation structure of the South African economy. Bhaskar (2011) explains that with social structures there are underlying structural powers and tendencies that exist whether or not detected or known. Critical realism as explained by Bhaskar, shifts the focus from epistemology (theory of knowledge) to “theory of being”. The implications here are that the world must also be explained in relation to particular points in time. This ontological view informs the following assumption that this study makes:
1. Even though the study is conceptualised to look at the empirical relationship between financialisation, household indebtedness and economic development, it is assumed that there are structural powers, such as the monetary policy regime, the fiscal policy and the institutional powers vested with various institutional bodies in the South African economy that affect the relationships and equations specified in this study.
2. It is assumed that the time period (1990- 2018) selected to address the research questions of this study captures the effects of indebtedness and financialisation on economic development.
1.9 STRUCTURE AND CONTENT OF THE RESEARCH
Chapter 1 serves as an introduction and orientation to the research under review. Chapter 1 also gives a broad outline of background issues, the problem statement, research questions, objectives, and brief explanation of how the study is designed. The ontological stance and the philosophical assumptions the study is based on are explained.
Chapter 2discusses the contextual issues around indebtedness, including the regulatory framework that shapes credit creation, social economic indicators and performance of the banking sector in South Africa. Chapter 3 follows with
the theoretical, and conceptual framework of this study. The study methodology including, the critical realism philosophical approach, variable measures, model specification and analytical tools are explained in chapter 4. Chapter 5 presents the findings of this study. Chapter 6 discusses the findings, and mounts arguments on how this work contributed to original knowledge.
1.10 CONCLUDING REMARKS
This chapter provided the overview and introduced the research topic by providing the background of the study, problem statement as well as aim and objectives of the study. Included is the rationale behind what motivated this study to be done by. Knowledge gaps were highlighted. The next chapter proceeds to paint the contextual background of the study.
CHAPTER 2: CONTEXTUAL BACKGROUND
2.0 INTRODUCTION
This chapter presents the contextual issues pertaining to indebtedness with a particular focus on banking environment. The global outlook is presented in the next section. Thereafter, the South African banking environment is presented followed by a discussion on the South African economic environment.
2.1 GLOBAL BANKING ENVIRONMENT
The Basel Accords are the banking supervision accords. Basel I, Basel II and Basel III are issued by the Basel Committee on Banking Supervision to ensure the implementation of a regulatory framework in the global banking industry. The Basel IV accord is an extensive review of the previous Basel Accords to minimize the risk of bank capital and bank credit as a major driver of potential bank instability. The Basel Accords have been developed not only to ensure smooth financial intermediation, but also financial stability. This view is not always shared amongst scholars. For example, Werner (2013) in a landmark empirical study conducted in 2013, established strong evidence that the notion that financial institutions are merely financial intermediaries can no longer be left unchallenged. Werner (2012) argues that when banks create credit, they set up numerous chain reactions both locally and globally with numerous multiplier effects. A simple explanation of this theory is that money is created endogenously when banks create new loans.
Vivian and Spearman (2015) hold a conservative approach that the banks’ primary function is a financial intermediary role between buyer and seller as opposed to borrower and lender. According to Vivian and Spearman’s (2015) argument, this is an erroneous representation of the banks’ role in the money creation process. The correct explanation, as per their argument, is that the role banks play in the money creation process needs to be re-explained to accentuate the significance of the value-for-value exchange transaction which
forms the basis of the money creation process and the banks function as facilitator of this crucial transaction between buyers and sellers.
Vivian and Spearman’s (2015) critique denotes the need to correctly define the banks’ role in this relationship to uphold corporate credibility which is ultimately vital for influencing public policy and academic integrity. The two authors contend that there is deliberate confusion created between cash money and bank money. That is, banks create money - bank money not cash money. Their argument is that bank money is a record of debt-credit relationship and that the creation of this type of money has been misunderstood to be an act of creating something out of nothing, thereby disregarding the value-for-value transaction between the buyer and the seller.
According to Vivian and Spearman, the reason for banks’ existence is not motivated by money creation but by the reduction of various risks and costs associated with value-for-value transactions. This process, they maintain, exposes the banks to high levels of impaired accounts, solvency risks and liquidity risks associated with cash demand and supply dynamics. Vivian and Spearman argue that commercial and retail banking’s role is that of intermediation between the seller and the buyer transactions. The authors articulate the purpose of commercial and retail banks as that of facilitating “the process of inter-temporal exchange transactions between buyers and sellers”.
The buyer and seller transactions are based on value-for-value inter-temporal exchange which must be completed by the immediate settlement and payment of the debt raised by the buyer. If the bank’s role is merely reduced to facilitating these debt-credit transactions, this then begs the question: who then provides the funds to pay the seller and how is this money created?
From the Marxist perspective, the underlying principles of the credit creation policy in commercial banks flow from the “institutionalized powers and freedoms of banking and other financial institutions” (Pixley and Harcourt, 2013). These freedoms and powers of banks as financial intermediaries involve the provision,
banks entering high risk areas of speculative credit creation which is mainly focused on, amongst other things, the financing of loans to private equity, loans for hedge funds, real estate, mortgages and direct financial investment by banks. Marxist economists have identified speculative credit creation as the main cause of economic bubbles in the financial markets.
The Marxist position is that when a portion of financial credit creation rises, it creates capital gains from the speculation and bolsters the balance sheets artificially. This creates a sense of elation in the market driving asset prices to go up and encouraging the banks to increase loans and credit book. The situation becomes unsustainable as credit creation falls forcing asset prices down, leading to the increase of bad debts as banks get more risk averse causing deflation in the economy. According to Pixley, and Harcourt (2013), most of the banking crises have been caused by the multiple incidents of speculative credit creation practices from the 1980’s to the late 2000’s.
The Marxist Socialist interpretation of the debt creation phenomenon is that there are powerful vested interests with pressure group capabilities empowered by the institutionalized mechanics of the credit creation and allocation in the financial system supported by specific ideological assumptions and models. The capitalist system and its banking system is considered to be predestined to ultimate disintegration amidst continuous attempts to reinvent and reconstruct its endemic deficient financial system. Pixley and Harcourt (2013) maintain that “the general arrangements of credit creation and allocation are more or less maintained and reconstituted through crises after crises even after a major failing and crash”. This means a reformation rather than a fundamental transformation and transition disabling potential alternatives to the current global credit creation mechanism.
Pixley and Harcourt (2013) view, that an entirely new and different credit creation system will have to be conceptualized, tested and implemented, is a sensible view. Their recommendation is that credit creation should be understood as a public good and made more decentralized and diverse than is currently the case. Putting it differently, Pixley and Harcourt’s position is that
the credit creation mechanism should be de-privatized in favour of diverse and broadly-based public institutions. Thus, they are making a case to refocus credit creation towards a national development agenda. They are calling for a migration from a commercially driven system to a broad social, financial and ethical development imperative executed by various public institutions and agencies answerable to the state. To them, the current capitalist system of lending and borrowing on interest is by and large responsible for the present economic instability. Such a view would not work in a government with high levels of corruption. Most importantly, management of financial institutions requires unique banking skills and experience that is not necessarily available among public sector employees.
There are alternative banking models including the Swiss JAK bank model premised on zero interest for both deposits and withdrawals (Kennedy, 1995). The North Carolina public banking model which relies entirely on a productive investment agenda for the development and growth of the economy (Tesseman and Kruger, 2012). Said bases his argument on ethical banking practices derived from the Islamic finance philosophy (2008). Tesseman and Kruger (2012) argue for an interest rate commission agent banking system which they contend will remove the current technical and strategic deficiencies in the banking system. Baicu and State (2012) argue for an improved banking model that will ensure sustainable financial stability. This long-term sustainability includes the state playing a key role. The traditional banking system is under pressure as the result of recurring global economic disruptions in the financial system. The conceptualization and implementation of an effective banking model designed to address national development objectives has been viewed as being long overdue. Baicu (2012) argues that government requires formation of strong network of national industrialization banks (NIB’s) to carry out the onerous task of economic development and industrialization. Maintaining an acceptable industry debt ratio is argued to be the principle would underpin the operations of the NIBs
The critical realist model of financialisation expects actors in the financialisation processes to go the extra mile and incorporate ethical behaviours in their day-to-day activities (Danemark et al, 2000, p. 5-6). Ethical behaviour as several authors have indicated, can save the banks from systemic crises of conflicts, contradictions, domination, inequalities and, above all, indebtedness.
The Marxist solution however, seeks the removal of capitalism. It is based on the argument that the terminal contradictions motivated by the demand of indefinite profit motif cannot provide a precise strategic mechanism for running the banks. The Marxist model as argued earlier calls for a socialist solution in the financial system.
The neo-classical conservative models on the other hand, call for cosmetic amendments without breaking the genetic code of the global capitalist market economy. The retention of financialisation and debt creation policies under this model would therefore remain unchanged.
The liberalist-based critical realist solution is pragmatic in that it seeks to provide a conscious appreciation of how the banks, central banks and stock exchange markets would operate to manage both private and public indebtedness in the economy (Brown, 2013; JAK Members Bank, 2004, Swart, 2013). Empirically, King and Levine (1993) demonstrated that the level of financial intermediation is a good procedure of long run rates of economic growth, capital accumulation and productivity improvement.
2.2 SOUTH AFRICAN BANKING ENVIRONMENT
Within the South African credit environment, the banking system is dominated by five major commercial banks. The WEF Global Competitiveness Report 2017-2018 ranks South Africa 44th in the world in terms of financial market
development out of 148 countries (WEF Global Competitiveness Report 2017-2018).
This ranking reflects in part the effectiveness of the South African banking system as was demonstrated by the country’s ability to endure the 2008 global financial crises. Furthermore, South Africa’s financial service sector, supported by a sound regulatory and legal framework is comparably advanced comprising various domestic and foreign institutions who provide multiple range of services in commercial, retail and merchant banking, mortgage lending, insurance and investment banking (BASA, 2014).
The South African banking system is well developed and sophisticated and comprising a central bank, the South African Reserve Bank, as well as financially strong banks, investment institutions and other small and medium sized banks. Many foreign banks and investment institutions have established businesses in South Africa. Investment and Merchant banking remains the most competitive in the corporate banking industry, whilst the country’s big five banks - ABSA, FNB, Standard Bank, Nedbank and Capitec are dominant in the retail market (BASA, 2014).
The legislation and regulatory frameworks governing the financial sector is primarily, the Banks Act of 1990 and Mutual Banks Act 1993, which ensures the attainment of a sound, efficient system in the interest of the depositors of banks and the economy in its totality. The Reserve Bank, is responsible for administering the registration of institutions as banks or mutual banks as well as for discharging all the requirements of the Act (BASA, 2014).
There are a number of role players in the financial services sector, including commercial banks, investment banks, the Central Bank, Bank Association of Southern Africa, Banks’ Ombudsman, and the Prudential Authority, and National Treasury. The commercial banks usually hold reserves that are less than their deposit liabilities (SARB, 2016). Therefore, fractional reserve banking system allows the money circulation to grow beyond the amount underlying the reserves of base money created in the first instance by SARB. A basic example would mean for every R10.00 issued by SARB, a commercial bank can issue
the same note 25 times more than the original base amount to its customers (Werner, 2014).
The SARB regulates bank credit creation and management of banks by imposing reserve requirements and capital ratios. Rather than directly controlling the money supply, the SARB operate within an inflation targeting regime with a sharp focus on interest rate and prices (SARB, 2016).
The non-banking sector before the promulgation of the Financial Sector Regulations Act (2018) was adjudicated by the Financial Services Board (FSB). FSB which responsible for the regulation of financial markets and institutions including insurers, fund managers and broking operations, is subsumed within the Prudential Authority located with the SARB. The Prudential Authority was established under the Financial Sector Regulations Act (2018) .
The National Credit Regulator is accountable for regulating the South African credit industry, including the registration of credit providers, credit bureaux and debt counsellors. It is responsible for enforcing compliance with the National Credit Act and is focused on developing an accessible credit market to meet and provide the needs of the people who are marginalized economically (National Credit Act of 2005).
The Banking Association of South Africa is an industry body representing all registered banks in South Africa. It is the mandated representative of the sector and represents the industry through lobbying engagement with key stakeholders from the political, economic and financial jurisdiction in the country.
The Ombudsman for Banking Services (OBS) resolves individual complaints about banking services and products. The mandate of the OBS is to resolve complaints through negotiations. A formal ruling is then made in the form of a recommendation that is binding or a determination that is not subject to OBS jurisdiction guidelines.
The National Treasury is one of the institutions responsible for developing and maintaining the legislative and regulatory frameworks in South Africa. There are close ties between the SARB and the National Treasury. The Minister of Finance is the ultimate administrator of the Banks Act of 1990, the Financial Intelligence Centre (FIC) which is a regulatory body in South Africa that was established to identify the proceeds of unlawful activities and combat money laundering activities (RSA, 2001b:1). The FIC was established under the Financial Intelligence Act 2001 in February 2002.
Other legislation applicable to South African banks include the Financial Intermediary and Advisory Services (FAIS Act) which regulates the activities of all financial service providers who give advice or provide intermediary services to clients in respect of certain financial products. The Act requires such providers to be licensed; and requires that professional conduct be controlled through a code of conduct and specific enforcement measures.
The National Credit Act (NCA) no 34 of 2005 is designed to achieve specific objectives most of which are to benefit and protect the consumer. It regulates consumer credit and seeks to ensure fair and non-discriminatory access to consumer credit and improved standards of consumer information. It also seeks to promote responsible granting of credit and provides for debt re-organization in case of over-indebtedness. The consumer Protection Act seeks to promote a fair accessible and sustainable marketplace for consumer products and services.
Kelly-Louw (2008) has indicated that many legislative changes have been implemented by the introduction of the National Credit Act which seeks to promote and advance the social and economic welfare of South Africans. A further objective is to encourage responsible borrowing and the avoidance of reckless lending. He maintains that one of the key attributes of this act is the “in duplum” rule which limits the interest recoverable in terms of a loan or credit transactions. According to this rule, Vessio (2005, p. 34) points out that interest in area is legally claimable in terms of the agreement between the parties and
which interest is due and in this calculation, what has already been paid by way of interest will not be taken into account. A creditor is therefore not prevented by the rule to collect more than double the unpaid or paid capital amount in interest provided that at no time he allows unpaid arrear interest to reach the unpaid capital amount. Should this augmentation occur, interest would cease to run (Sanlam Insurance Ltd 652 H-J). The loopholes that were exploited in this rule and in the Act were closed by the National Credit Act amendment of 2016.
The Competitions Act promotes and maintains competition in South Africa in order to sustain efficiency, adaptability and development of the economy which provide consumers with competitive pricing and product choices. The competition Act also promotes employment and advances the social and economic welfare of South Africans. It expands opportunities for participation in world markets, and recognizes the role of foreign competition and ensures that small and medium sized enterprises have equitable opportunities to participate in the economy, thus promoting a greater spread of economic ownership (Competitions Act of 1998 as amended by Act. No 39 of 2001).
The SA Banks are expected to comply with the King Code on corporate governance. The King IV code applies to all corporate institutions regardless of the manner and form of incorporation. The South African major banks are listed on the Johannesburg Securities Exchange (JSE). King IV is part of the JSE’s listing requirements. King IV code on corporate governance “asks for mindful application of the King IV code and for its recommended practices to be interpreted and applied in a way that is appropriate for the organization and the sector in which it operates” (King Report, 2016)
2.2 1 South African banking system and the major commercial banks PwC’s (2017) analysis of major banks shows that domestically, economic growth in South Africa registered a disappointing 0.3% in 2017 on the back of a negative 4th quarter GDP figure. The RMB/BER Business Confidence Index
which demonstrated that South African business and consumers were under financial pressure.
According to the PwC analysis, the overall composition of the major banks combined loan portfolios remained largely unchanged at FY 16 when compared to FY 15. In many ways, this reflected that the banks’ strategic decisions to maintain the shape of their balance sheets and portfolio structures was not that easy, given the heightened levels of economic uncertainty and forecast. The combined loans and advances grew from by 0.7% and 2.1 % against 1H16 and FY 15 respectively. The PwC analysis indicated that aggregate credit demand, across retail and wholesale portfolios continued to be constrained by economic factors ranging from slow economic growth, increasing pressure on household incomes and subdued levels of business confidence – all amplified by the heightened rate that persisted over the rand.
SARB Economic and Financial Data (2016) showed that both financial and non-financial companies increased their reliance on bank funding during Q 3, with the utility sector showing demand for bank intermediated funding in the second half of the year. Their report indicated that the banks reduced their risk exposure from sectors which were under financial stress including agriculture, mining, oil and gas sectors. Mortgage portfolios continued to show sluggish levels of growth in the domestic real sector with combined residential mortgage advances growing at 1.7% in FY 16 compared to FY 15 and growing by 0.7% against 1H 16.
The sustained reduction in aggregate demand for credit of residential mortgages was a clear indication that combined household incomes were under severe pressure, providing an opportunity for major banks to refocus lending to other asset classes. As an outcome, both capital and interest repayment were affected, thus denying households the ability to settle contractual repayments as early as they possibly could have.
over time is an indication of financial stability in any nation, especially if credit and debt equity is extended to ensure productivity and output. It is for this reason that, Luqman (2014) and Kolapo, Ayeni and Oke (2010) noted that when banks extend credit to the public for productive activities they are likely to accelerate the pace of a nation’s economic growth and its long-term sustainability.
Vosloo and Styger (2009) provide a solid argument for the necessity of a strong governance regime for the risk management in financial institutions. They have emphasized that a focused and unceasing contraction of non-performing loans (NPL’s) strengthens the risk-adjusted-return on capital (RAROC) which is a vital instrument in the banks profit optimization framework. In South Africa banks have put much effort in the past four years to keep NPL at less than 5% Vosloo and Styger (2009) note that the banks are operating in a cumbersome environment in which the pursuit of a RAROC driven credit structure does not necessarily guarantee the financial health of impaired accounts but increases the total cost structure of maintaining them.
According to the Campbell and Coco’s (2015) model, the existence of impaired accounts emanates from endogenous and exogenous factors ranging from negative home equity, low finance resources to levels of high inflation and high interest rates.
Due to a multitude of non-performing loans, the Basel II Accord has put an emphasis on credit risk management and practices. This Accord ensures adherence to the governance protocol of credit management. Compliance manages credit risk exposure to safeguard profitability and growth in the market. The resource and capital allocation are enabled to operate within a stabilized environment. The commercial banks of South Africa had high levels of non-performing loans in 2007 up to 2010, as indicated in the PwC 2016 report. High NPL levels not only have a negative impact on banks’ lending to the economy but also affect the operating efficiency of such banks.
PWC’s (2016) analysis of major banks showed that a focused and unceasing contraction of NPL’s in bank balance sheets is invaluable to the economy from both a micro-prudential and macro-prudential perspective (ECB Banking Supervision, 2016). The main task is to do an asset quality review and a stress test to determine the performance of each asset. The objective is to assess varying approaches and ascertain the identification, measurement, management and write offs of the NPL’s. The combined NPL’s decreased 2.8% against 1H16 but increased 4.5% against FY 15. Impairment charges grew 13.6% against FY 15 on an annualized basis. The number and value of clients in debt counselling continued to increase in FY 16. Debt counselling clients are over-indebted consumers who have affordable repayment plans with credit providers.
The PWC analysis indicated that the South African commercial banks have started to dedicate teams to deal with operational and business- related matters pertinent to this NPL portfolio while continuing to monitor provisioning assumptions used in calculating impairments relative to this portfolio. Overall, the NPL have been kept to a total gross loan ratio of 3% well below the 4% level last seen in 2H 12 and comfortably below the elevated levels seen in some international territories. On an annualized basis, operating expenses grew 9.2% and, in some ways, reflect the heightened inflationary environment that persisted in 2016. The combined cost to income ratio deteriorated marginally by 28 bps to 54% against 2 H15.
Guided by Barros (2012) research on technical efficiency of Japanese banks, this study examines the extent of NPL’s impact on the banks’ financial performance. PwC has painted a positive NPL outlook, however individual assessment of each bank may produce a different view.
The National Credit Regulator places about 9.87mn people on impaired account records. The total private debt is about R 1.6 trillion which suggests that the financial sector led by the commercial banks is trapped in a gridlock of non-performing loans.
According to Gidlow (2008), from the late 1930’s, the South African banking sector was dominated by Standard and Barclays banking institutions. Prior to the major consolidation of the South African banking sector, the market was contested competitively by various banks which amongst others included Trust Bank, Volkskas, United Allied, Sage, Bankorp, Senbank, and Bankfin, all of which became merged into Amalgamated Banks of South Africa (ABSA).
Table 1: Market Capitalization and P/E Ratio
Bank Market Cap Share Price Price/E ratio
First Rand (FNB) R 265,89 bn R 47.50 11.15 Standard Bank R 231,36 bn R 142.89 9.84 ABSA Bank R 121,36 bn R 148.48 8.07 Nedbank R 103,86 bn R 207.30 8.63 Capitec R 94,16 bn R 826.49 24.82 Finance
Bank Income Headline
Earnings HEPS Standard Bank R 99.9 bn R22.1 bn 1 440 First Rand (FNB) 71.8 bn 22.4 bn 399 ABSA 72.4 bn 15.04 bn 1 769 Nedbank 26.0 bn 11.5 bn 2 400 Capitec 10.7 bn 3.8 bn 3 281
Reach & Network
Bank Employees Branches ATMs
Standard Bank 54 767 1 211 7 410
ABSA 30 739 744 8 885
Firs Rand (FNB) 8 216 676 4 641
Nedbank 32 401 786 4 052
Banking Clients
Bank Dec 2015 June 2016 Dec 2016
Standard Bank 11.6 mn - 11.8 mn
ABSA Bank 9.4 mn 8.9 mn 8.8 mn
Capitec 7.3 mn 7.9 mn 8.3 mn
First Rand (FNB) 7.2 mn 7.4 mn 7.7 mn
Nedbank 7.4 mn 7.7 mn 7.4 mn
The Permanent Bank of South Africa was incorporated into Nedbank. The consolidation of the banking sector gave birth to four major competitors comprising Standard Bank, First National Bank, ABSA, and Nedbank. The rise of major commercial banks was motivated primarily by the decline of confidence levels in small banks as a result of the Saambou Bank debacle (Gidlow, 2008; Moloi, 2014).
In terms of market capitalisation, First Rand is South Africa’s biggest bank with a capitalization of just under R 266 billion followed by Standard Bank at R 231 billion. Both Banks carry fair value with a price/earnings ratio that is relatively low-unlike Capitec, which carries a P/E of 25.
Standard Bank, Absa and Nedbank implemented their new banking fees early in the year which included a complete restructuring from Standard Bank, a moderate increase from ABSA, while Nedbank’s fees increases were marginal.
In March 2017, Capitec announced its new banking fees which saw prices increase across most of its transactions albeit from a low base involving single price transaction costs. The FNB’s new banking fees came into effect from 1 July 2017 and included a marginal increase in the monthly account fee for its Gold account. FNB kept its fees largely unchanged from 2016/2017 period, introducing two new accounts in the form of FNB and FNB Premier Fusion Account. The R1.40 fee makes it the most affordable point of sale (POS) withdrawal fee of the major banks, except for Nedbank which still offers the transactions free. The next banking fees review took place at the end of 2017,
when Standard Bank, ABSA and Nedbank updated their fee structures. Capitec conducts its annual fees review in March whilst FNB does it in July.
The FNB has published its new banking fees for the 2018/19 period. The bank has kept some of its prices unchanged, that is, the monthly fee for the Gold Account. Other prices have been hiked in line with inflation and include the adjustments for the recent VAT increase. From 1 April 2018, the VAT rate was hiked to 15%, which translated to a 1% increase in fees across most of the commercial banks, though some of these costs have been absorbed by the banks.
The tables below show how fees for SA’s five major retail banks have changed year-on-year, taking into account the change in VAT. The accounts used are the banks’ mid-market accounts (Business Tech, 4 June 2018). The calculations are based on a R500 transaction, which the banks have said is the most common range for cash-based transaction in the country. Absa, Standard Bank, Nedbank and Capitec rates (adjusted for VAT) have been in effect since 1 April 2018, with FNB’s new rates commencing from 1 July 2018.
Figure 8: ABSA
(Source: Staff Writer 4 June 2018. South Africa’s banking fees compared.
Figure 9: Standard Bank
(Source: Staff Writer 4 June 2018. South Africa’s banking fees compared.
https://businesstech.co.za/news/banking/249251/south-africas-banking-fees-compared/)
Figure 10: Nedbank
(Source: Staff Writer 4 June 2018. South Africa’s banking fees compared.
https://businesstech.co.za/news/banking/249251/south-africas-banking-fees-compared/)
Figure 11: Capitec
Figure 12: FNB
(Source: Staff Writer 4 June 2018. South Africa’s banking fees compared.
https://businesstech.co.za/news/banking/249251/south-africas-banking-fees-compared/)
2.2.2 Trend Analysis of Factors influence Monetary Policy
According to the Constitution of South Africa, the ultimate objective of the monetary policy in the country is “to establish a stable financial environment in support of sustainable real economic growth over the medium and long-term”.
Since 2000, the core inflation has been targeted in the 1 – 6% range. The SARB achieves financial stability by influencing the money supply and bank credit extension to the private sector. The bank does this with operational instruments such as the minimum cash reserves for banking institutions, open market operations and short-term money market interventions through swaps and repurchase transactions (Mboweni, 2000).
SARB influences the demand for credit through influencing the level of the repo interest rates as the operational instrument. Its primary objective is to influence interest rates in order to combat inflation. There must therefore be a link between the quantity of money circulating in the economy and interest rates; and the macroeconomic variables such as price level, the level of employment and the gross domestic product (GDP).
Lower interest rates bring about more investment projects to South Africa. Increased investments in the country, result in an increase in GDP. The danger though is that lower interest rates and concomitant greater money supply might
increase the inflation rate. The repo rate is the rate at which the SARB grants assistance to the banking sector and therefore represents a cost of credit to the banking sector. When the repo rate is changed, the interest rates on overdrafts and other loans extended by the banks also tend to change. In this way the Reserve Bank indirectly affects the interest rates in the economy.
In 2000,SA government and the SARB targeted the CPIX inflation rate between 3 to 6 percent measure on annual average by the end of 2002. SARB reviewed the monetary policy in 2015.
The following graphs show the trends of instalment debtors, suspensive sales and leases, instalment sale over per capita GDP, debt to GDP, unemployment rate, and Inflation rate between 2002 and 2018.
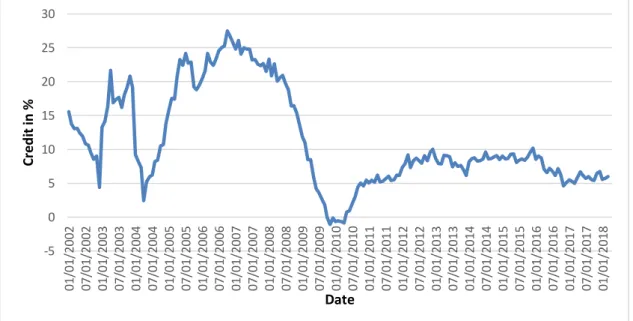
Figure 13: Total credit extended to private sector 2002-2017
Figure 8 shows that the credit extended to private sector was high between 2004 and 2008 with a maximum of above 25% in 2007. This sharply declined in 2008 to 2010 due to credit crunch which was precipitated by the global financial crisis of 2008. Figure 13 shows that the total credit extended to private sector, although improved slightly around 2011, it never reached the pre-2008 levels. As illustrated in Figure 13, in 2010 credit picked up by about 5% and
-5 0 5 10 15 20 25 30 01 /0 1/ 20 02 07 /0 1/ 20 02 01 /0 1/ 20 03 07 /0 1/ 20 03 01 /0 1/ 20 04 07 /0 1/ 20 04 01 /0 1/ 20 05 07 /0 1/ 20 05 01 /0 1/ 20 06 07 /0 1/ 20 06 01 /0 1/ 20 07 07 /0 1/ 20 07 01 /0 1/ 20 08 07 /0 1/ 20 08 01 /0 1/ 20 09 07 /0 1/ 20 09 01 /0 1/ 20 10 07 /0 1/ 20 10 01 /0 1/ 20 11 07 /0 1/ 20 11 01 /0 1/ 20 12 07 /0 1/ 20 12 01 /0 1/ 20 13 07 /0 1/ 20 13 01 /0 1/ 20 14 07 /0 1/ 20 14 01 /0 1/ 20 15 07 /0 1/ 20 15 01 /0 1/ 20 16 07 /0 1/ 20 16 01 /0 1/ 20 17 07 /0 1/ 20 17 01 /0 1/ 20 18 C red it in % Date
remained consistent within 5%-10% of credit extended to private sector (SARB, 2015). In addition, 2003 and 2004 also saw a sharp decline due to a decline in economic growth confidence impacting on affordability (SARB, 2015). These anomalies dropped to below 5% in both 2003 and 2004. Thus 2005 to 2008 were lucrative in terms of credit extended to private sector compared to years post 2008 (SARB, 2015).
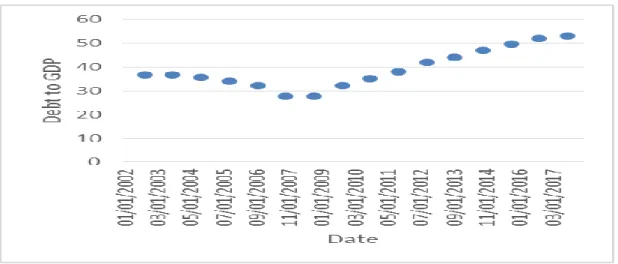
Figure 14: Public Debt to GDP
Figure 14 shows that the public debt to GDP ratio stood below 40% which improved to below 30% in 2007. However, the ratio began to rise above unacceptable levels from 30% in 2010 to 55% in 2017. This is due to high spend with a declining economic growth. The rise in the debt to GDP ratio is also attached to political instability and the country’s poor economic performance.
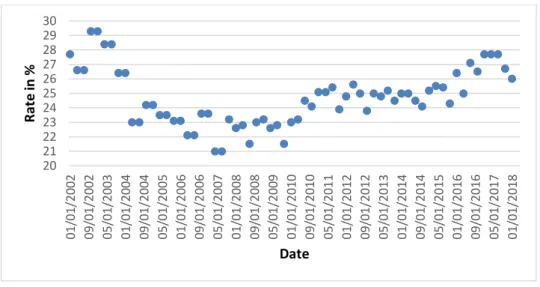
The unemployment rate in South Africa has never been below 20% since 2002 according to Figure 10. The highest experiences were in 2002 which hit 29.3% and slowed down to the levels of 24% between 2004 to 2010. Unemployment rose to 25% in 2012 and 27.7% in 2017. There is however the presence of trend and seasonality behavior in this pattern.
The inflation rate went below zero (-4%) in 2003 to 2004 falling from 11% levels in 2002. Inflation rate is uneven due to fluctuating consumer price spend. In 2010 inflation accelerated to a maximum of 8.6% from 0.4% level in 2006.