Bhangale C J et al / Int. J. of Pharmacy and Analytical Research Vol-8(2) 2019 [185-193]
IJPAR |Vol.8 | Issue 2 | Apr - Jun - 2019
Journal Home page: www.ijpar.com
Research article
Open Access
Validated stability indicating HPTLC methods for the determination
of entecavir in bulk and dosage form
C. J.Bhangale * and D.H.Nandal
1
PRES’s College of Pharmacy (For Women), Chincholi, Nashik.
2
Pravara Institute of Medical Sciences Deemed University (PIMS), Loni,
*Corresponding Author: C. J.Bhangale
E-mail: [email protected]
ABSTRACT
The objective of the present work is to develop a simple, precise, accurate, validated stability indicating HPTLC method for the determination of Entecavir in bulk and tablet dosage form. The HPTLC method employed TLC aluminium plates precoated with silica gel 60F-254 as the stationary phase. The solvent system consisted of Chloroform:Toluene: methanol: ammonia (7:2:1:0.2v/v) and then scanned .The system was found to give compact spot for Entecavir (Rf value of 0.51 ± 0.02). The linearity was found to be in the concentration range 300-1800 ng/spot. The reliability and analytical performance of the proposed methods, including linearity, range, precision, accuracy, detection and quantitation limits, were statistically validated. When entecavir was subjected to different stress conditions; the proposed methods could effectively separate the drug from its degradation products, and were thus considered as good stability-indicating procedures. It is concluded that this method can be applied for routine quality control of Entecavir in dosage forms as well as in bulk drug.
Keywords:
Entecavir, High pressure thin layer chromatography, Method development and validation, Stability indicating.INTRODUCTION
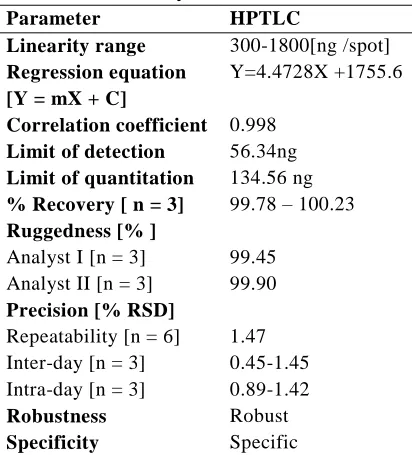
Entecavir (ETV) is a nucleoside analog [1] with the chemical name 2-Amino-9-[(1S,3R,4S)-
4-hydroxy-3-(hydroxymethyl)-2- methylidenecyclopentyl]-6,9-dihydro-3H-purin-6-one(Fig.1) [2]. Entecavir is a guanosine nucleoside analogue with selective activity against hepatitis B virus (HBV). It is designed to
selectively inhibit the Hepatitis B virus, blocking all three steps in the replication process[3, 4].
Literature survey revealed, few analytical methods which include UV-spectrophotometric methods [5-7] liquid chromatographic methods [8, 9] have been reported for estimation of ETV. However, to our knowledge, no information related to the stability-indicating UV and high-performance thin-layer chromatography (HPTLC) determination of ETV in
pharmaceutical dosage forms has ever been mentioned in literature. According to the stability test guidelines issued by ICH [11-12], in the present study the stress induced stability studies were carried out for ETV to establish its stability characteristics. Hence, an attempt has been made to develop an accurate, specific and reproducible method for the determination of ETV in presence of degradation product for the content analysis during stability studies from pharmaceutical dosage form.
EXPERIMENTAL
Materials and Reagents
Pharmaceutical grade of Entecavir kindly supplied as a gift sample by Cipla Ltd., Mumbai, India. All chemicals and reagents used were of HPLC of analytical grade and were purchased from Merck Chemical. India. Analytical grade sodium hydroxide, hydrochloric acid and 30% hydrogen peroxide were used.
Instrumentation and chromatographic
conditions
HPTLC was performed on 20 cm x 10 cm aluminium plates coated with silica gel aluminium plate 60F-254 (0.2 mm thickness E. Merck, Germany).ETV was spotted in the form of bands of width 6 mm with Camag microlitre syringe using Camag Linomat V (Switzerland). A constant application rate of 150 nl/sec was employed and space between two bands was 15 mm. The slit dimension was kept 6 mm x 0.45 mm micro, 20 mm/s scanning speed was employed. The mobile phase consisted of Chloroform: Toluene: methanol: ammonia (7:2:1:0.2v/v). The chromatogram was developed in twin trough glass chamber saturated with mobile phase using linear ascending technique. The optimized chamber saturation time for mobile phase was 20 min at room temperature. The length of chromatogram run was approximately 80 mm. The system was found to give compact spot for ETV (Rf value of 0.51 ± 0.02). Subsequent to the development; TLC plates were dried in current of air with the help of an air dryer. Densitometric scanning was performed using Camag TLC scanner III in the absorbance mode at 254 nm. The source of radiation utilized was deuterium lamp emitting a
continuous UV spectrum in the range of 200 - 400 nm.
Preparation of standard solution and
calibration graphs
Accurately weighed quantity of ETV (10 mg) was transferred to 10.0 ml volumetric flask. Then small amount methanol was added and ultra sonicated for 5 min and diluted up to the mark with methanol (Concentration: 1000 μg/ml). Different volume of stock solution 0.3, 0.6, 0.9, 1.2, 1.5, 1.8 μl were spotted in six replicates on TLC plates to obtain concentration of 300, 600, 900,1200,1500,1800 ng/spot of ETV respectively
The plate was developed on previously described mobile phase. The peak areas were plotted against corresponding concentrations to obtain the calibration graphs
PREPARATION OF SAMPLE
SOLUTION
For HPTLC Densitometry
Twenty tablets were accurately weighed and average weight per tablet was determined. Tablets were ground to fine powdered, and weighed tablet powder equivalent to 10mg of ETV was transferred to 100 mL volumetric flask. The powder was dissolved in 30 mL methanol by intermittent shaking and the volume was made up to the mark with methanol. The solution was then filtered through Whatmann filter paper no.45. 1µLof above solution was spotted on TLC plate followed by development and scanning as described in Section 2.2.3.The analysis was repeated for six times. ETV gave sharp and well defined peaks at Rf 0.51, when scanned at 254 nm.
METHOD VALIDATION
The method was validated for its linearity range, accuracy, precision, sensitivity and specificity. Method validation is carried out as per ICH guidelines
Precision
procedure was replicated on different days (n=3). Recovery studies by standard addition method were performed in view of justifying accuracy of the proposed methods. Previously analysed samples containing ETV was spiked with standard ETV, and the mixtures were analysed in triplicate (n=3) by proposed methods. Precision was calculated from percentage relative standard deviation (RSD %) for repeated measurements, whereas accuracy was expressed as % of recovery.
Robustness and ruggedness of the method
For HPTLC–densitometric method
Robustness was studied in six replicate at the concentration level of 1000 ng/spot. In this study, seven parameters (mobile phase composition, mobile phase volume, development distance, relative humidity, duration of saturation, time from spotting to chromatography and chromatography to spotting) were studied and the effects on the results were examined.
Ruggedness of the proposed method was studied by two different analysts using the same experimental and environmental conditions. The spots 1000 ng/band of ETV was applied on TLC plates. This procedure was repeated in triplicates.
Limit of detection and limit of quantitation
Sensitivity of the proposed method was estimated in terms of limit of detection (LOD) and limit of quantitation (LOQ). The LOD and LOQ were calculated by the use of the equation LOD = 3.3 Х ASD/S and LOQ = 10 Х ASD/S; where, ‘ASD’ is Average standard deviation of the peak height and area of the drugs , taken as a measure of noise, and ‘S’ is the slope of the corresponding calibration curve.
Different volume of stock solution in the range 300-600 ng/band was spotted on TLC plate. The procedure was repeated in triplicate.
Specificity
To confirm the specificity of the proposed method, ETV sample was spotted on TLC plate. The mobile phase designed for the method resolved ETV very efficiently. The peak purity of ETV was tested by correlating the spectra of ETV extracted from capsules and standard ETV at the peak start (S), peak apex (A) and at the peak end (E) positions. Correlation between
these spectra indicated purity of ETV peak {correlation r (S, M) = 0.999, r (M, E) = 0.9992}.
Recovery studies
Recovery experiments were performed at three different levels i.e. 80, 100 and 120 %. To the pre-analysed sample solutions, a known amount of standard drug solution of ETV was added at three different levels.
Forced degradation studies
A stock solution containing 10 mg for ETV in 10 mL methanol was prepared. This solution was used for forced degradation to provide an indication of the stability-indicating property of the method.
Acid degradation
Methanolic solution of the drug (10 mg) was separately dissolved in 10 mL of 1M HCl and these solutions were kept for 8 h at room temperature in dark in order to exclude the possible degradative effect of light. The solutions (1 mL) were taken and neutralized and then diluted up to 10 mL with methanol. The resultant solutions were applied on TLC plate in triplicate (10 μL each, i.e. 1000 ng/band). The plate was chromatographed as described above.
Base degradation
Methanolic solution of the drug (10 mg) was separately dissolved in 10 mL of 1 M NaOH solution. These solutions were kept for 8 h at room temperature in dark in order to exclude the possible degradative effect of light. The solutions (1 mL) were taken and neutralized and then diluted up to 10 mL with methanol. The resultant solutions were applied on TLC plate in triplicate (10 μL each, i.e. 1000 ng/band). The plate was chromatographed as described above.
Oxidative degradation
Photochemical degradation
The photochemical stability of the was studied by exposing the methanolic stock solution to direct sunlight for 8h (from 9 AM to 5 PM, at 20oC).
Thermal
degradation
at
different
temperature and different time interval
Expose about 2 gm of sample at different time intervals viz. 0, 90, and 180 days and at different temperatures viz. -200C, 250C, and 400C.
A solution of the treated powder was then prepared and 1000 ng/band was applied to a plate in triplicate. The plate was then chromatographed and treated as described above.
No degradants were observed. However, for 180 days and 400C the chromatographic peak area of Entecavir decreased insignificantly. Hence, the sample was stable at least for 180 days at 250C.
Thermal stress (Test sample exposed to
sunlight)
Transfer about 2 gm of sample into a clean dry watch glass and spread evenly. Expose to sunlight for 10 hours. A solution of the treated powder was then prepared and 1000 ng/band was applied to a plate in triplicate. The plate was then chromatographed and treated as described above.
RESULT AND DISCUSSION
Optimization of procedures
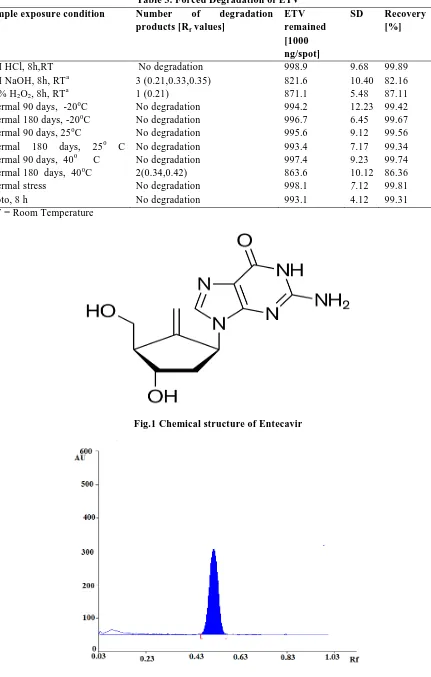
The TLC procedure was optimized with a view to develop a stability indicating assay method. Initially Chloroform and toluene was tried but does not show proper movement. Therefore, methanol was added in various proportions to toluene and chloroform. Finally, chloroform, toluene and methanol in the ratio of 7:2:1 v/v was selected as mobile phase the developed spot was diffused. To the above mobile phase, 0.2 ml ammonia was added. It gave good resolution, sharp and symmetrical peak with Rf value of 0.51 for (Fig.2). Also the spot for was compact and not diffused. It was observed that prewashing of TLC plates with methanol (followed by drying and activation) and pre-saturation of TLC chamber with mobile phase for 20 min ensure good reproducibility and peak shape of.
Linearity
In case of UV linearity was found to be in the range of 4-24 µg/ml. In case of HPLC, linearity was studied by injecting six concentrations of standard ETV (2,4,6,8,10,12 μg/mL) in triplicate. In HPTLC, a series of dilutions and standard curves were prepared over a concentration range from 300-1800 ng/band of ETV from stock solution. The graph of peak area versus concentration data was performed by least square linear regression analysis, whereby slope, intercept, and correlation coefficient were determined.
Precision
An Intra-day variation was assessed by analysing three different concentrations 900, 1200 and 1500 ng/band of ETV for three times within a day.
Inter-day variation was assessed using same concentration of drug (mentioned above) and analysing it for three different days, over a period of week. The results are as shown in
Table 1.
Robustness and ruggeddness of the method
The parameters such as mobile phase composition, volume of mobile phase, development distance, relative humidity, activation of plates, duration of saturation were studied. The standard deviation of peak areas was calculated for each parameter .The low %R.S.D. 0.56-1.34 indicates robustness of the method.
The ruggedness of the proposed method was evaluated by two different analysts. The results for ETV were found to be 99.45% and 99.90% respectively
LOD and LOQ
Detection limit and quantification limit was calculated and the LOD and LOQ were found to be 56.34 ng and 134.56 ng, respectively.
Recovery studies
To the preanalysed 1000 ng/band solutions, a known amount of standard drug solutions of ETV was over spotted at 80 %,100 % and 120 % levels i.e.900,1200 and 1500 ng/band. The chromatogram was developed and scanned. The result of % recovery was found to be 0.67-1.43
System Suitability
System suitability tests were also carried out to verify reproducibility. The system suitability was assessed in HPTLC by using six replicate analysis of drugs at concentration of 1000 ng/spot of ETV respectively.% RSD was found to be 1.31 which was less than 2 indicated the method is reproducible.
Summary of validation parameter are as shown in Table 2.
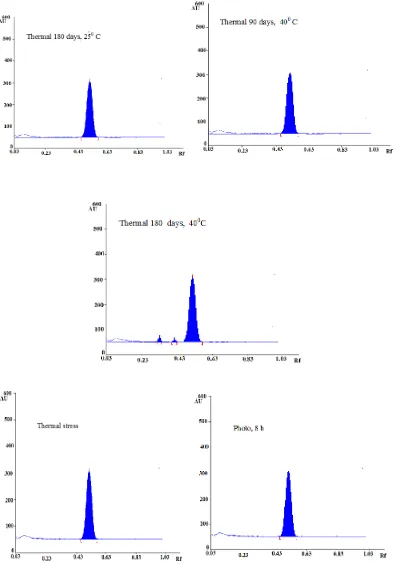
Stability- indicating property
The chromatogram of samples degraded with acid, base, hydrogen peroxide, thermal photo light and thermal stress showed well separated spots of pure ETV as well as some additional peaks at different Rf values (Fig. 3). Content of
ETV remained, and percentage recovery were calculated and listed in Table 3.
Analysis of the marketed formulation
Six replicate determinations were performed on the commercially available tablets. For ETV the spots of Rf 0.51 was observed in chromatograms obtained from drug samples extracted from tablets and recovery was found to be 99.87±0.65%. There was No interference was observed from the excipients commonly present in the tablets. It may, therefore, be inferred that degradation of ETV had not occurred in the marketed formulations analysed by this method. The low RSD indicated that the method is suitable for routine estimation of ETV in pharmaceutical dosage forms.
Table 1. Intra-day and Inter-day Precision Studies Drug Conc.
[ng/band]
Intra- day
Amount found [ng]
Inter- day
Amount found [ng] Mean SD
[n = 3]
% RSD Mean SD [ n = 3]
% RSD
ETV 900 896.23 6.56 0.75 898.09 27.21 0.89 1200 1194.47 32.32 1.45 1203.32 42.37 1.42 1500 1498.49 45.92 0.45 1505.84 24.57 1.23
Table 2.Summary of Validation Parameter Parameter HPTLC
Linearity range 300-1800[ng /spot]
Regression equation [Y = mX + C]
Y=4.4728X +1755.6
Correlation coefficient 0.998
Limit of detection 56.34ng
Limit of quantitation 134.56 ng
% Recovery [ n = 3] 99.78 – 100.23
Ruggedness [% ]
Analyst I [n = 3] 99.45 Analyst II [n = 3] 99.90
Precision [% RSD]
Repeatability [n = 6] 1.47 Inter-day [n = 3] 0.45-1.45 Intra-day [n = 3] 0.89-1.42
Robustness Robust
Table 3. Forced Degradation of ETV Sample exposure condition Number of degradation
products [Rf values]
ETV remained [1000 ng/spot]
SD Recovery [%]
1 M HCl, 8h,RT No degradation 998.9 9.68 99.89
1 M NaOH, 8h, RTa 3 (0.21,0.33,0.35) 821.6 10.40 82.16
10 % H2O2, 8h, RTa 1 (0.21) 871.1 5.48 87.11
Thermal 90 days, -200C Thermal 180 days, -200C Thermal 90 days, 250C
Thermal 180 days, 250 C Thermal 90 days, 400 C Thermal 180 days, 400C Thermal stress
No degradation No degradation No degradation No degradation No degradation 2(0.34,0.42) No degradation
994.2 996.7 995.6 993.4 997.4 863.6 998.1
12.23 6.45 9.12 7.17 9.23 10.12 7.12
99.42 99.67 99.56 99.34 99.74 86.36 99.81
Photo, 8 h No degradation 993.1 4.12 99.31
aRT = Room Temperature
Fig.1 Chemical structure of Entecavir
Fig. 3. Forced degradation of ETV by HPTLC: A) 1N HCl + ETV; B) 1N NaOH + ETV; C) 10% H2O2 + ETV; D) Thermal 90 days, -200C; E) Thermal 180 days, -200C ;F) Thermal 90 days,
250C;G) Thermal 180 days, 250C; H) Thermal 90 days, 400C;I) Thermal 180 days, 400C; J)Thermal stress K) Photolioght,8h.
CONCLUSION
The proposed HPTLC methods provide simple, accurate and reproducible quantitative
from their degradation products; therefore, it can be employed as a stability indicating study.
Acknowledgements
The authors are thankful to PRES’s College of Pharmacy, Chincholi, Nashik for providing necessary facilities. The authors are also thankful to Cipla Ltd., Mumbai for providing gift sample
and Merck Chemicals, India for analytical grade reagents.
CONFLICT OF INTERESTS
The authors declare that they have no conflict of interests.
REFERENCES
[1]. Sims KA, Woodland AM. Entecavir: a new nucleoside analog for the treatment of chronic hepatitis B infection Pharmacotherapy. 26(12), 2006, 1745–1757.
[2]. O' O' Neil M J, editor. The Merck Index: An Encyclopaedia of Chemicals,Drugs and Biologicals. Merck & Co. Inc: 14, 2006, 613.
[3]. Bertam G Katzaung, editor. Basic and Clinical pharmacology, 9, 2007, 814.
[4]. Honkoop P, de Man RA. Review of Pharmacology and Clinical Experience. Expert opin. Invest. Drugs 12, 2003, 683-688.
[5]. Malipatil SM, Bharath S Athanikar and Mogal Dipali.Validated UV spectroscopic estimation of Entecavir in bulk and formulation. RJPS, 1(2), 2011, 111-116
[6]. Reddy R, Jampani S, Vidyadhara S, Battula S L: Visible spectrophotometric determination of entecavir in pharmaceutical dosage forms .Journal of Scie nce, 4(10), 2014, 600-603.
[7]. Jampani S, Reddy R, Vidyadhara S:Estimation and validation of entecavir in bulk and pharmaceutical dosage forms by UV spectrophotometry .World Journal of Pharmaceutical Sciences, 2(10), 2014, 1339-1344
[8]. Swathi P,Vidyadhara S, Sasidhar R. L. C., Chakravarthi K K :Method development and validation for the estimation of entecavir in bulk and pharmaceutical dosage forms by RP -HPLC .International Journal of Current Pharmaceutical Research, 9(5), 2017, 107 -111
[9]. Appala Raju N,Rao JV,Prakash kV,Khagga M . Estimation of entecavir in tablet dosage form by RP -HPLC. Asian Journal of Chemistry, 21(3),2317-2320
[10]. International Conference on Harmonisation (ICH) of Technical Requirements for the Registration of Pharmaceutical for Human Use Stability testing of new drugs substance and products Q1A (R2), 2003, 1-18.
[11]. Bakshi M. and Singh S J. Pharm. Biomed. Anal. 28, 2002, 1011-1040.