P R O C E E D I N G S
Open Access
Comparing performance of non
–
tree-based
and tree-based association mapping
methods
Katherine L. Thompson
1*and David W. Fardo
2FromGenetic Analysis Workshop 19 Vienna, Austria. 24-26 August 2014
Abstract
A central goal in the biomedical and biological sciences is to link variation in quantitative traits to locations along the genome (single nucleotide polymorphisms). Sequencing technology has rapidly advanced in recent decades, along with the statistical methodology to analyze genetic data. Two classes of association mapping methods exist: those that account for the evolutionary relatedness among individuals, and those that ignore the evolutionary relationships among individuals. While the former methods more fully use implicit information in the data, the latter methods are more flexible in the types of data they can handle. This study presents a comparison of the 2 types of association mapping methods when they are applied to simulated data.
Background
Linking variation in quantitative traits to locations along the genome (single nucleotide polymorphisms [SNPs]) is a central goal in the biomedical and biological sciences. The rapid growth of sequencing technology in recent decades has given researchers the ability to sequence genomes in a time-efficient and cost-efficient way. De-velopment of statistical methods appropriate to search for associations among SNPs and quantitative traits (or phenotypes) has been quite active, often with complex data sets [1]. These complex scenarios include, but are not limited to, the case that the trait is simultaneously influenced by external covariates, multiple genes, or by gene–gene interactions. This complexity is exacerbated by the fact that many of the influences of SNPs on quantitative traits have only been through small effect sizes. Understanding these associations could prove useful in the disease diagnosis and/or treatment of human diseases, as well as in answering questions in evolutionary biology.
The search for SNPs associated with variation in a quan-titative trait under study is often referred to as quanquan-titative trait mapping (QTM). There are 2 specific goals of QTM: detection of SNPs associated with variation in quantitative trait(s) and localization of SNPs associated with variation in quantitative trait(s). In detection, the goal is to deter-mine if any SNP in the region of the truly associated SNP is statistically significant. However, when analyzing hundreds of thousands of SNPs, the chance of detecting the exact causal locus is very small. As such, preferred methods will detect SNPs that are nearer to the causal SNP. This goal is referred to aslocalization.
Some association mapping methods (such as the clas-sical t-test and those in McClurg et al. [2]) analyze gen-omic data efficiently and can detect strong associations among SNPs and a quantitative trait under study. In these methods, samples are grouped according to allele type at a single site or set of sites, and tests are performed to look for differences in trait value among such sites. However, these methods may miss weaker signals because they fail to use all available information, such as uneven evolu-tionary relatedness present in population-based samples of individuals.
* Correspondence:[email protected]
1Department of Statistics, University of Kentucky, Lexington, KY 40536-0003,
USA
Full list of author information is available at the end of the article
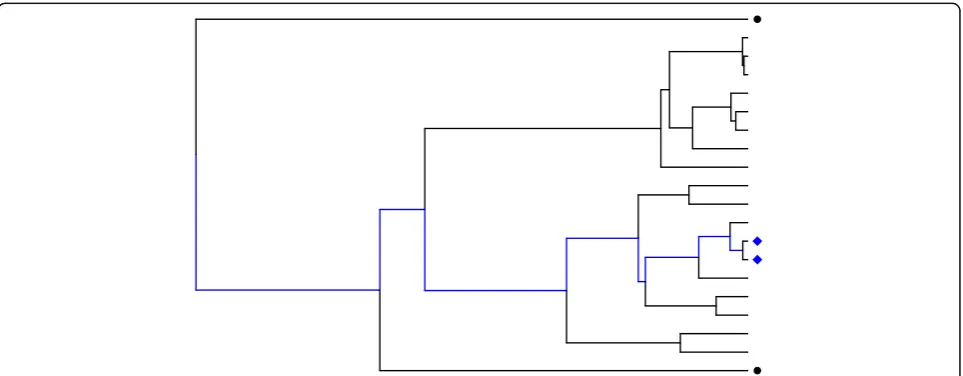
Uneven relatedness among randomly sampled individ-uals can be attributed to the evolutionary history that exists within each SNP. Each SNP has an evolutionary history that can be represented by a bifurcating tree called a phylo-genetic tree. For example, in the phylogenetic tree in Fig. 1, each tip represents a copy of the SNP shown. Time moves from past to present from left to right across the tree, and longer branch lengths represent longer times. For any 2 observations, the amount of shared evolutionary time is represented by the shared branches along the tree. Wher-ever 2 observations share a lineage (collection of branches), they share an evolutionary history. After a split in their lineages, the 2 observations evolve independently.
Consider the evolutionary history of a SNP associated with a trait. If 2 observations share a large portion of their evolutionary history (as is the case of the 2 blue diamonds in Fig. 1), their respective trait values are expected have a large correlation, whereas if 2 observations share little evolutionary history (as is the case of the 2 black circles in Fig. 1), their trait values are also expected to show little correlation. Thus, the evolutionary history of a SNP associated with a quantitative trait imposes a correlation structure on the trait values. Tree-based methods that use this correlation structure during analysis may have im-proved ability to detect weaker associations compared to methods that assume independence among observations.
Tree-based methods, such as those in Besenbacher et al. [3], Pan et al. [4], Thompson and Kubatko [5], Zhang et al. [6], and Zöllner and Pritchard [7], usually use the evolu-tionary history within each SNP, in the form of a phylo-genetic tree, to gain information about the relationships among observations of the trait during analysis of genomic
data. However, existing tree-based methods are also unable to consider complex, but biologically realistic data, such as external covariate data. In addition, by using more implicit information present in the data, tree-based methods also incur a computational cost. By using this implicit information, they may show improved performance compared to methods that are not tree based. In this study, both a non–tree-based method and a tree-based method are used to directly compare per-formance of the 2 classes of methods. The analyzed data contains simulated phenotypes on 1943 unrelated individuals [8]. Five genes (TNN, LEPR, GSN,TCIRG1, andFLT3) were analyzed.
Methods
The data analyzed was provided by the Genetics Analysis Workshop 19 [8]. Beagle was used to impute missing SNP data and to phase the genotypic data into haplo-types [9]. We analyzed SNPs in 5 genes and included 100,000 base pairs upstream or downstream from each gene (TNN, LEPR, GSN,TCIRG1, and FLT3). Locations of genes were determined using GeneCards Version 3 [10] and data was extracted using VCFtools Version 0.1.12b [11]. SNPs lacking 2 or more variants across samples were not analyzed.
The classical 2-sample t-test and the likelihood score statistic (LSS) approach [5] were studied to compare the performance of a non–based method and a tree-based method. For the classical t-test, at each SNP, the chromosomal observations were partitioned according to SNP state (minor or major allele), and a pooledt-test was performed using these 2 groups. It should be noted
that the number of observations is twice the number of individuals in the study.
For the LSS approach [5], at each SNP, a phylogenetic tree, denoted Θ, was estimated from the SNP data. Ini-tial tree topology (tree shape) estimation was performed using the method from Mailund et al. [12], in which neighboring SNPs are used to estimate a phylogenetic tree at each SNP. To reduce computational expense, a broad-scale estimate of this tree is used. Specifically, the tree is considered to be a set ofkclusters defined by the (k−1) earliest splits in the tree. Each cluster of observa-tions has a mean trait value (μi). The covariance among 2 observations is proportional to the length of their shared lineages in the tree. The method assumes the trait values follow a multivariate normal distribution with a mean structure (μ= [μ1,μ2,…,μk]), and covariance structure, V(Θ), defined by the estimated clustered tree. A constant variance, σ2, is assumed for all trait values. The LSS is based on the Bayesian information criterion and is defined to be the maximum penalized likelihood of the parameters given the data and the estimated tree. The likelihood is penalized by the number of parameters used in the calculation of the likelihood and the maximum is taken over the number of clusters (k= 2,3,…,kmax). At
theithSNP, the score is defined to be:
LSSi¼ max
Here, μ^ and σ^2 are the maximum likelihood estimates ofμandσ2, respectively. The LSS treats each allele as an observation, so that the number of observations, n, is twice the number of individuals under study.
We have 2 goals to address—detection of the gene and localization of the causal loci—and we compare the performance of a tree-based method (the LSS) to a non–tree-based method (the classicalt-test using chro-mosomes as observations as in Sasieni [13]) in terms of each goal. To address detection, permutation testing was performed. We created 100 permutation data sets by shuffling the trait values across genotypes, creating ran-dom trait–genotype pairs. The detectionp-value was taken to be the proportion of permuted data sets producing test
statistic values more extreme than the test statistic calcu-lated using the observed data. To address localization, the average LSS and t-statistic values are shown at each SNP for comparison to the absolute true effect size at each SNP analyzed. The performance of the phylogenetic method (LSS) and the pooled 2-samplet-test were compared in the case of each goal.
Results
Both the pooledt-test and the LSS (with a maximum of k= 15 clusters) were used to analyze systolic blood pres-sure using 5 genes from the 200 simulated phenotype data sets. All loci in all replicates chose far fewer than k= 15 clusters. We note that the allelest-test does not account for phenotypic correlation between repeated mea-sures across chromosomes. Four of these genes (TNN, LEPR,FLT3, andGSN) ranked in the top 9 genes in terms of total percentage variation in simulated systolic blood pressure (SBP).TNNandLEPRhad effect sizes as large in magnitude as 10.89 and 11.99, respectively. We also ana-lyzed genes accounting for a smaller percentage of the total variation in SBP, includingFLT3,TCIRG1, andGSN, which had effect sizes as large in magnitude as 3.89, 3.38, and 0.76, respectively. Detection and localization perform-ance was compared across the non–tree-basedt-test and the tree-based LSS approach.
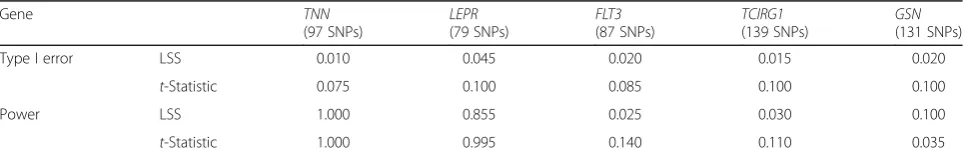
In terms of detection, both methods performed well in finding the signal present inTNNand LEPR(see rows 3 and 4 of Table 1). In the remaining 3 genes that had weaker signals (FLT3, TCIRG1, and GSN), much lower power was achieved by both methods, and neither method uniquely outperformed the other. In addition, 200 simu-lated Q1 trait data sets (data sets including a trait simusimu-lated without any direct genotype–phenotype association) were also analyzed to assess the type I error of each method. The LSS showed error rates lower than 0.05, whereas the t-test showed error rates above 0.05 in the case of all 5 genes (see rows 1 and 2 of Table 1). Although both methods showed similar power of detection, the t-test showed a type I error slightly larger than expected, whereas the LSS appeared somewhat conservative across the considered genes.
Table 1Comparing power and type I error across methods using simulated data
Gene TNN Type I error LSS 0.010 0.045 0.020 0.015 0.020
t-Statistic 0.075 0.100 0.085 0.100 0.100 Power LSS 1.000 0.855 0.025 0.030 0.100
t-Statistic 1.000 0.995 0.140 0.110 0.035
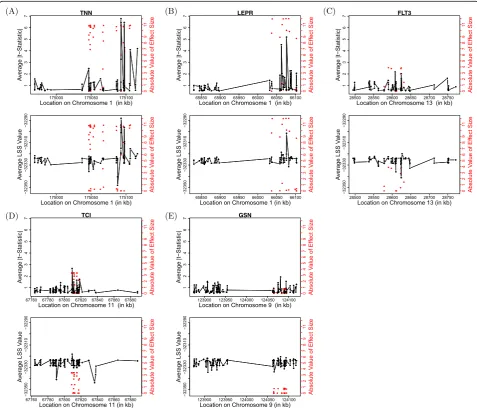
Figure 2 shows the average statistic value at each SNP within each considered gene. Because the LSS should be larger in the case of an associated SNP, we consider the average LSS over the 200 replicate data sets at each SNP (shown in lower plots in Fig. 2). Similarly, for the t-test, we consider the average of the absolute value of the t-statistic over the 200 replicate data sets at each SNP (see upper plots in Fig. 2). The red dots in each plot show the true absolute value of the effect size at each locus (axis on right). As neither method shows a strong advantage in having higher values nearer to the truly causal variants, both the t-test and LSS appear to show similar ability to localize the true causal loci. However, LSS shows more similar values for nearby SNPs, while
thet-test varies widely across each gene. This is expected because thet-test considers each SNP marginally, whereas LSS uses the estimated phylogenetic tree at each SNP, and, biologically, trees from neighboring SNPs along a chromosome are expected to be more similar than trees from SNPs farther apart. With respect to magnitude of effect size, the LSS showed higher power in detecting SNPs associated with simulated SBP than the 2-sample t-test inGSN, where the magnitudes of effect sizes within the gene were much smaller than in other cases. In the other cases with larger effects, thet-test outperformed the phylogenetic method. This may point to the reason that the methods had mixed performance when analyzing the considered genes.
Discussion
In this study, genomic data were analyzed using both a classical non–tree-based approach (the 2-sample t-test) and a more recently proposed tree-based approach (the LSS). The results highlight the differences between the considered methods with respect to both the detection and the localization analyses. In the detection analysis, the methods showed similar power, but differed slightly in type I error rates. However, allelic tests can be biased [13], and this could be the root of the inflation in the type I error rate of the t-test. In a separate simulation study, we used an empirically derived critical value from the Q1 (null) trait data to make decisions about detec-tion. In this case, the powers of detection were similar (within 2.5 %) of the results shown in Table 1 (data not shown). When considering localization, the LSS and the t-test had similar trends in estimating the location of the truly causal loci. In the case of a smaller effect size (GSN), the LSS outperformed the t-test, which may point to an advantage of using additional implicit information in genomic data sets to search for weaker genetic signals rather than excluding this information.
The study performed here was advantageous in that the simulated phenotypes were far more complex [8] than most previous simulated genetic data sets (e.g., see Besenbacher et al. [3], Pan et al. [4], Zhang et al. [6], and Zöllner and Pritchard [7]). However, the analyses were simplified in that they considered only the SNP data and phenotype of interest but ignored information about external variables (such as sex) present in the data. Although some existing non–tree-based methods are flexible enough to handle more complex biological scenar-ios such as the additional influence of external covariates on the trait under study, these methods fail to use all the information present in the data by ignoring the uneven evolutionary relatedness among the sampled individuals. Tree-based methods gain information about the covari-ance structure of the trait observations by considering the phylogenetic tree within each SNP, but incur a computa-tional cost by doing so. In addition, existing tree-based methods are limited by an inelasticity to handle complex, but biologically realistic, data, such as data including external covariate information. As such, discussion and analyses here included SNP and phenotypic data to show an even comparison of the 2 classes of methods. However, as the phylogenetic method showed some promise in its ability to detect weaker genetic signals, developing tree-based techniques that are flexible enough to handle more complex data types could improve the success of associ-ation mapping using genomic data.
Conclusions
Even though the rapid advancement of sequencing tech-nology has produced large quantities of genomic data to
analyze, improvements upon QTM methods continue to be developed. Non–tree-based methods exist to analyze complex data sets, but such methods tend to find large genetic effects. Currently, tree-based methods are able to analyze only basic genetic data sets, but more fully use implicit information in the genetic data to estimate the evolutionary relatedness among observations. These methods may improve upon QTM performance of non– tree-based methods, and could be extended so they are able to analyze more complex scenarios, such as inclusion of external covariates. Doing so would address a current limitation of tree-based association mapping methods and could improve the performance of methods in explaining variation in quantitative traits under study.
Declarations
This work was partially supported by National Institutes of Health (NIH) grant K25AG043546 (DWF). The Genetic Analysis Workshop (GAW) is supported by NIH grant R01 GM031575. The GAW19 whole genome sequence data were provided by the Type 2 Diabetes Genetic Exploration by Next-generation sequencing in Ethnic Samples (T2D-GENES) Consortium, which is supported by NIH grants U01 DK085524, U01 DK085584, U01 DK085501, U01 DK085526, and U01 DK085545. The other genetic and phenotypic data for GAW18 were provided by the San Antonio Family Heart Study and San Antonio Family Diabetes/Gallbladder Study, which are supported by NIH grants P01 HL045222, R01 DK047482, and R01 DK053889. The GAW is supported by NIH grant R01 GM031575.
This article has been published as part ofBMC ProceedingsVolume 10 Supplement 7, 2016: Genetic Analysis Workshop 19: Sequence, Blood Pressure and Expression Data. Summary articles. The full contents of the supplement are available online at http://bmcproc.biomedcentral.com/ articles/supplements/volume-10-supplement-7. Publication of the proceedings of Genetic Analysis Workshop 19 was supported by National Institutes of Health grant R01 GM031575.
Authors’contributions
Both KLT and DWF planned the data analysis. KLT performed the computation and drafted the manuscript. Both DWF and KLT revised and edited the manuscript. Both authors read and approved the final manuscript.
Competing interests
The authors declare that they have no competing interests.
Author details
1Department of Statistics, University of Kentucky, Lexington, KY 40536-0003,
USA.2Department of Biostatistics, University of Kentucky College of Public
Health, Lexington, KY 40536-0003, USA.
Published: 18 October 2016
References
1. Donnelly P. Progress and challenges in genome-wide association studies in humans. Nature. 2008;456(7223):728–31.
2. McClurg P, Pletcher TM, Wilthsire T, Su AI. Comparative analysis of haplotype association mapping algorithms. BMC Bioinformatics. 2006;7:61. 3. Besenbacher S, Mailund T, Schierup MH. Local phylogeny mapping of
quantitative traits: higher accuracy and better ranking than single-marker association in genomewide scans. Genetics. 2009;181(2):747–53. 4. Pan F, McMillan L, de Villena FPM, Threadgill D, Wang W. TreeQA:
quantitative genome wide association mapping using local perfect phylogeny trees. Pac Symp Biocomput. 2009;415–26.
5. Thompson K, Kubatko L. Using ancestral information to detect and localize quantitative trait loci in genome-wide association studies. BMC Bioinformatics. 2013;14:200.
7. Zöllner S, Pritchard JK. Coalescent-based association mapping and fine mapping of complex trait loci. Genetics. 2005;169(2):1071–92. 8. Blangero J, Teslovich TM, Sim X, Almeida MA, Jun G, Dyer TD, Johnson M,
Peralta JM, Manning AK, Wood AR, et al. Omics squared: human genomic, transcriptomic, and phenotypic data for Genetic Analysis Workshop 19. BMC Proc. 2015;9 Suppl 8:S2.
9. Browning SR, Browning BL. Rapid and accurate haplotype phasing and missing data inference for whole genome association studies using localized haplotype clustering. Am J Hum Genet. 2007;81(5):1084–97. 10. Safran M, Dalah I, Alexander J, Rosen N, Iny Stein T, Shmoish M, Nativ N,
Bahir I, Doniger T, Krug H, et al. GeneCards Version 3: the human gene integrator. 2010;2010:baq020.
11. Danecek P, Auton A, Abecasis G, Albers CA, Banks E, DePristo MA, Handsaker R, Lunter G, Marth G, Sherry ST, et al. The variant call format and VCFtools. Bioinformatics. 2011;27(15):2156–8.
12. Mailund T, Besenbacher S, Schierup MH. Whole genome association mapping by incompatibilities and local phylogenies. BMC Bioinformatics. 2006;7:454.
13. Sasieni P. From genotypes to genes: doubling the sample size. Biometrics. 1997;53(4):1253–61.
• We accept pre-submission inquiries
• Our selector tool helps you to find the most relevant journal • We provide round the clock customer support
• Convenient online submission • Thorough peer review
• Inclusion in PubMed and all major indexing services • Maximum visibility for your research
Submit your manuscript at www.biomedcentral.com/submit