Improving the Use Case Point and COCOMO with Expert
Judgment and Analogy based Estimation
Chetan Nagar
Ph.D. Student Mewar University Chittorgarh Rajasthan India
Anurag Dixit,
PhD. DirectorSiddhi Vinayak group of Colleges Alwar
ABSTRACT
Software effort estimation is an important part of software development work and provides essential input to project feasibility analyses, bidding, budgeting and planning. A lot of methods are used in industry for efforts estimation, Use Case Point; COCOMO, Analogy and Expert Judgment are most popular methods of estimation. But these all methods are used separately. One method is not suitable for all kind of projects .This paper is combining these methods to use the advantages of these methods and overcome the disadvantages of these methods. This paper using expert judgment and Analogy based estimation in Use Case Point and COCOMO to improve the Use Case Point and COCOMO.
.
KEYWORDS
Analogy Based Estimation, Expert Judgment, COCOMO, Use Case Point.
1.
INTRODUCTION
In the efforts estimation either we are using model or expert / analogy based estimation. We treat Expert estimation and model based estimation as a different process of estimation. Both approaches have some advantages and disadvantages. In the model we have several parameters that we have to predict. We have to predict these values based on experience, expertise or analogy. That means expert based estimation or analogy based estimation is already involve in model based estimation. Suppose we are using COCOMO model for estimation than we have to predict the KLOC required building the project and 22 EAF. So the result of model depends on the prediction and how better we can predict will depend on our expertise, experience and how better we can utilize the analogy. It means model cannot work alone, it requires the assistance of experience expertise and analogy. To combine the model along with analogy and expert based estimation we have to add another column in the model that will provide the suggested value.
In case of COCOMO model has three columns first for Serial Number second for parameter description third for value and fourth column that we want to add, that will contain the suggested values. Now the question is that how the suggested values will come. We will take data of at least 10 successful projects, each entry will be average of these 10 values. Despite this fact, expert judgment is the most widely adopted technique for effort estimation, with 15 industry based studies showing the level of expert judgment adoption ranging from 60% to 100% [10]. Possible reasons for such a high level of adoption include: a general aversion to models that are not fully understood, and a tendency to favor simpler estimation strategies which require less mental effort from the user.
Software effort estimation research is inconclusive regarding which estimation approach is better, e.g. a recent review [4] of studies comparing models and experts in software development effort estimation concludes that experts typically performs no worse than the models.
Greater consistency may, to some degree, be achieved by greater use of formal estimation models. In many other fields in which forecasts are made, such as the making of diagnoses in medicine, expert judgments are typically outperformed by even the simplest prediction models, partly due to the higher degree of consistency of the models [1]. The obvious consequence of this is that we should switch to effort estimation models instead of expert judgment in software development projects. However, the situation in software engineering seems to be different from that in many other disciplines. A recent review of sixteen studies comparing models and experts in software development effort estimation shows that the experts typically performed no worse than the models [10]. One reason for this may be that it is difficult to develop meaningful estimation models that do not require a high degree of expert judgment as input to the models in the first place; that being so, the difference between models and expert judgment-based effort estimates in software development with regard to consistency may not be large. Understanding the nature and degree of inconsistency in expert judgment may consequently benefit estimation processes based on models, as well as those based on expert judgment.
If we are using analogy based estimation alone than we required the complete information of previous projects, but some time we do not have sufficient information of previous projects. We are using expert based estimation, its success depends upon expert and it can be biased.
We should accept that Estimation by Analogy and Expert Estimation are good estimation technique, methods of efforts estimation.
A lot of methods are used in software efforts estimation, but in this research paper we are considering only four methods:
1.1 Expert based Estimation [2].
1.2 Analogy Based Estimation [5]
1.3 COCOMO [9]
1.4 Use Case Point [3] [12] [13].
1.1
Expert based Estimation [2].
estimation or techniques for reaching a consensus between several.
1.2 Analogy Based Estimation [5]
An estimate is found by comparing the project at hand to other, already completed projects in the same application domain. In this context, the proportions between the projects and the effort that was actually required for the completed projects are considered.
1.3 COCOMO [9]
One after one three models of COCOMO given by Barry Boehm:
I. Simple COCOMO. II. Intermediate COCOMO. III. Advance COCOMO
I. Simple COCOMO:- It was the first model suggested by Barry Boehm, which Follows following formula:
Efforts= a*(KLOC) b
[image:2.595.320.549.70.236.2]Here a and b are complexity factor. TABLE I Complexity Factors
Model A B
Organic (simple in terms of size and complexity
3.2 1.0 5 Semi-ditched ( average in terms of
size and complexity
3.0 1.1 2
Embedded ( Complex) 2.8 1.2
0 II. Intermediate COCOMO:-Previous model does not include the factors which can affect the efforts. Intermediate COCOMO includes 17 factors that can affect the efforts estimation.
[image:2.595.316.548.274.384.2]Efforts= a*(KLOC) b *EAF Here a and b are complexity factor.
TABLE II Complexity Factors
Model A B
Organic (simple in terms of size and complexity
3.2 1.
05 Semi-ditched ( average in terms of
size and complexity
3.0 1.
12
Embedded ( Complex) 2.8 1.
20 Following are Efforts Adjustment Factors used in Intermediate COCOMO.Typical values for EAF range from 0.9 to 1.4.
TABLE III Cost Drivers
S NO Cost
Driver Value Description
1 DATA Database size.
2 CPLX Product complexity.
3 TIME Execution time constraint. 4 STOR Main storage constraint.
5 RUSE Required reusability.
6 DOCU Documentation match to
life-cycle needs.
7 PVOL Platform volatility.
8 SCED Scheduling factor.
9 RELY Required reliability. 10 TOOL Use of software tools. 11 APEX Application experience. 12 ACAP Analyst capability. 13 PCAP Programmer capability. 14 PLEX Platform experience.
15 LTEX Language and tools
experience.
16 PCON Personnel continuity.
[image:2.595.59.287.342.437.2]17 SITE Multisite development. Scale factors are new in COCOMO II. The effect of scale factor is in 1.01 to 1.26 ranges
TABLE IV New Cost Drivers
S NO Cost
Driver Value Description
18 PREC Precedence.
19 PMAT Process maturity.
20 TEAM Team cohesion.
21 FLEX Development flexibility. 22
RESL Architecture and risk resolution.
What we have to predict in the COCOMO, first we have to predict KLOC, second parameters specified in Table-III and Third Parameters specified in Table-IV. Experience data can help us in prediction .Now suppose we have a rich database for such kind of project so which projects can be taken as reference, Answer is that we must keep two parameters in mind first we have to take latest project and second we have to take successful project.
1.4 Use Case Point [3] [12] [13].
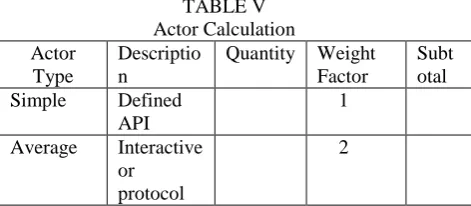
The Use Case Points (UCP) method provides the ability to estimate the man hours a software project requires from its use cases. Based on work by Gustav Karner [3], the UCP method analyzes the use case actors, scenarios, and various technical and environmental factors and abstracts them into an equation.
The UCP equation is composed of three variables: 1. Unadjusted Use Case Points (UUCP). 2. The Technical Complexity Factor (TCF). 3. The Environment Complexity Factor (ECF).
I. Calculate no of Actors:-We use following table to calculate no of Actors used in project
TABLE V Actor Calculation Actor
Type
Descriptio n
Quantity Weight Factor
Subt otal
Simple Defined
API
1
Average Interactive
or protocol
[image:2.595.61.288.541.638.2] [image:2.595.316.552.658.761.2]driven interface
Complex Graphical
user interface
3
Total Actor Points
[image:3.595.313.556.70.188.2]II. Calculate no of Use Cases:-We use following table to calculate no of Use Cases used in project
TABLE VI Use Case Calculation Use Case
Type
Description Quanti ty
Weight Factor
Subt otal Simple Up to 3
transactions
5 Average 4 to 7
transactions
10 Complex More than 7
transactions
15 Total Use Cases
UUCP =Weighted Actors + Weighted Use Cases UCP=UUCP*TCF*EF
Calculate TCF (Technical Complexity Factor)
[image:3.595.56.294.71.144.2]List of Technical factors where weight factor rate from 0-2 and project rating rate from 0-5
TABLE VII Technical Complexity Factors Technica
l Factor
Factor Description
Wight Factor
Project Rating
Sub Total T1 Must have a
distributed solution
2
T2 Must Respond to specific performance objective
1
T3 Must meet end
user efficiency desired
1
T4 Complex
internal processing
1
T5 Code must
reusable
1
T6 Must be easy
to install
0.5
T7 Must be easy
to use
0.5
T8 Must be
portable
2
T9 Must be easy
to change
1
T10 Include special
security feature
1
T11 Must provide
direct access to 1
third parties
T12 Requires
special user training facilities
1
T13 Must allow
concurrent user
1
TOTAL
TCF= (0.01 * TC factor) + 0.6
Calculate EF (EXPERIENCE FACTOR) TABLE III Experience Factors Experience
factor
Factor Description
Wight Factor
Project Rating
Sub Tot al E1 Familiar with
FTP software Process
1
E2 Application Experience
0.5
E3 Paradigm
Experience
1 E4 Lead analyst
capability
0.5
E5 Motivation 0
E6 Stable
Requirements 2
E7 Part time
workers
-1 E8 Difficulty of
programming Language
-1
TOTAL
EF= (-0.03 *E factor) + 1.4
In the Use Case Point approach is has to predict no of Actor (Table-V), no of Use Cases (Table-VI), TCF (Table-VII) and EF (Table-VIII).Record of latest and successful project can help us in prediction of these values.
An early project estimate helps managers, developers, and testers plan for the resources a project requires. As the case studies indicate, the UCP method can produce an early estimate within 20 percent of the actual effort, and often, closer to the actual effort than experts and other estimation methodologies [13].
2.
USE CASE POINT AND COCOMO
WITH ANALOGY AND EXPERT BASED
ESTIMATION
[image:3.595.54.286.187.305.2]So now the modified COCOMO will be like that: Efforts= a*(KLOC) b *EAF
[image:4.595.317.560.105.275.2]We have to take value of KLOC from the below given table
TABLE IX KLOC estimation Estimated value KLOC for the project
Recommended value of KLOC
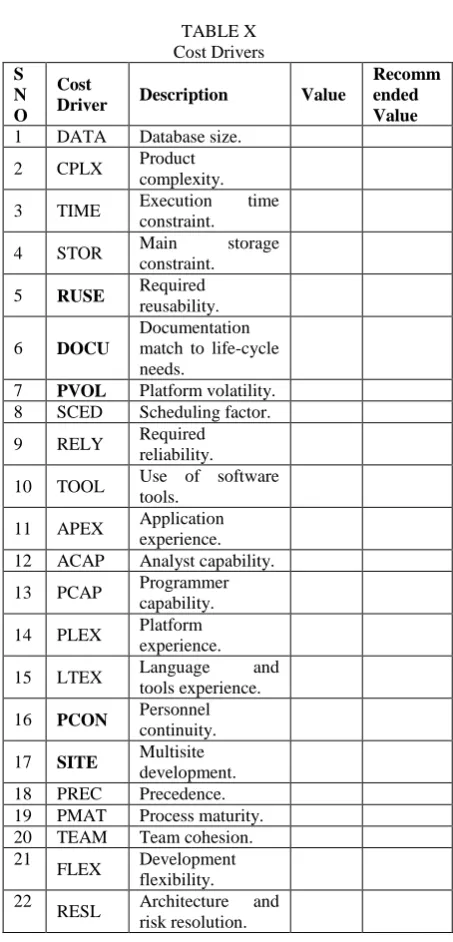
[image:4.595.57.284.232.704.2]We have to take the values of EAF from Following Table: TABLE X
Cost Drivers S
N O
Cost
Driver Description Value
Recomm ended Value 1 DATA Database size.
2 CPLX Product complexity. 3 TIME Execution time
constraint. 4 STOR Main storage
constraint. 5 RUSE Required
reusability.
6 DOCU
Documentation match to life-cycle needs.
7 PVOL Platform volatility. 8 SCED Scheduling factor. 9 RELY Required
reliability. 10 TOOL Use of software
tools. 11 APEX Application
experience. 12 ACAP Analyst capability. 13 PCAP Programmer
capability. 14 PLEX Platform
experience. 15 LTEX Language and
tools experience. 16 PCON Personnel
continuity. 17 SITE Multisite
development. 18 PREC Precedence. 19 PMAT Process maturity. 20 TEAM Team cohesion. 21
FLEX Development flexibility. 22
RESL Architecture and risk resolution.
Now the modified Use Case Point approach is like that : UCP=UUCP*TCF*EF
I calculate no of Actors:-We use following table to calculate no of Actors used in project
TABLE XI Actor Calculation Actor
Type
Description Quant
ity
Recom mende d Value
Weig ht Facto r
Su bt ot al
Simple Defined API 1
Averag e
Interactive or protocol driven interface
2
Compl ex
Graphical user interface
3
Total Actor Points
II Calculate no of Use Cases:-We use following table to calculate no of Use Cases used in project
TABLE XII Use Case Calculation Use Case
Type
Descript ion
Quanti ty
Reco mme nded Value
Weig ht Facto r
Su bt ot al
Simple Up to 3
transacti ons
5
Average 4 to 7
transacti ons
10
Complex More
than 7
transacti ons
15
Total Use Cases
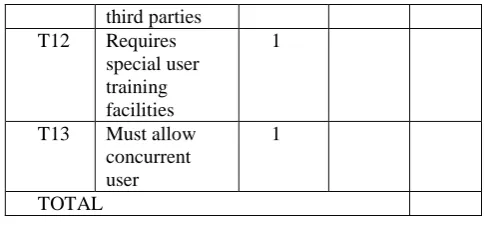
List of Technical factors where weight factor rate from 0-2 and project rating rate from 0-5
TABLE XIII
Technical Complexity Factors Techni
cal Factor
Factor Description
Wight Facto r
Project Rating
Rec om men ded Valu e
Sub Tota l
T1 Must have
a
distributed solution
2
T2 Must
Respond to specific performanc e objective
[image:4.595.317.558.324.523.2] [image:4.595.318.561.568.764.2]T3 Must meet end user efficiency desired
1
T4 Complex
internal processing
1
T5 Code must
reusable
1
T6 Must be
easy to
install
0.5
T7 Must be
easy to use
0.5
T8 Must be
portable
2
T9 Must be
easy to
change
1
T10 Include
special security feature
1
T11 Must
provide direct
access to
third parties
1
T12 Requires
special user training facilities
1
T13 Must allow
concurrent user
1
TOTAL
TCF= (0.01 * TC factor) + 0.6
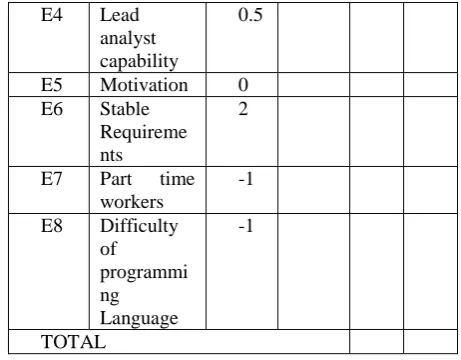
[image:5.595.316.547.71.251.2]Calculate EF (EXPERIENCE FACTOR)
TABLE XIV Experience Factors Experi
ence factor
Factor Description
Wight Facto r
Proje ct Ratin g
Rec om me nde d Val ue
Sub Tot al
E1 Familiar
with FTP
software Process
1
E2 Application
Experience
0.5
E3 Paradigm
Experience 1
E4 Lead
analyst capability
0.5
E5 Motivation 0
E6 Stable
Requireme nts
2
E7 Part time
workers
-1
E8 Difficulty
of programmi ng Language
-1
TOTAL
EF= (-0.03 *E factor) + 1.4
3.
RESULT
We know evidence is required to prove any model or method. But this approach required a rich and well managed set of data. In this approach last column containing the recommended value that will vary domain by domain and industry by industry, so we cannot fix it. On the basis of suggested concept industry can built software, so the estimation process will become automated, last column (recommended value) will contain average of at least 10 successful projects. Here we are not providing any kind of result because it would be better that you have generated your own result on the basis of the given concept
4.
CONCLUSION
It is always a topic of discussion that which is best either model or Expert/ Analogy based estimation. Research is going on from a long time but until we have not found any solid reason of what we have to adopt either model or analogy/ expert based estimation. Because every method has some advantages and disadvantages. Here we have provided a new concept of combining these two approaches (model and analogy/ Expert based Estimation) by adding an extra column of suggested/Recommended value. If in case it found that analogy/ expert based estimation is most suitable than use the recommended values and if it found that this new project is not matching with old projects in all aspect or we know the exact value of the parameter than do not use suggested or recommended value , use your predicted values for the parameters.
5.
REFERENCES
[1] P. E. Meehl, "When shall we use our heads instead of the formula?," Journal of Counselling Psychology, vol. 4, no. 4, pp. 268-273, 1957.
[2] M. Jørgensen, “Practical Guidelines for Expert-Judgment- Based Software Effort Estimation,” IEEE Software, vol. 22, no. 3, 2005, pp. 57–63.
[3] Karner Gautav “Resource Estimation for objector project “Objective system SF AB 1993
Models," Accepted for International Journal of Forecasting, 2007
[5] E. A.. Martin Shepperd and Chris Schofield, “Barbara KitchenhamEffort Estimation Using Analogy” IEEE Proceedings of ICSE-18 1996
[6] F. Walkerden and R. Jefferey, "An empirical study of analogy-based software effort estimation," Empirical Software Engineering, vol. 4, pp. 135-158, 1999 [7] Kristian Marius Furulund1 and Kjetil Moløkken-Østvold
“The Role of Effort and Schedule in Assessing Software Project Success - An Empirical Study”
[8] Bohem,” Software Engineering Economics”, Prentice Hall, 1981.
[9] M. Jørgensen and D. I. K. Sjøbert, "Impact of experience on maintenance skills," Journal of Software Maintenance and Evolution: Research and Practise, vol. 14, pp. 123-146, 2002.
[10]M. Jørgensen, "A Review of Studies on Expert Estimation of Software Development Effort," The
Journal of Systems and Software, vol. 70, pp. 37-60, 2004.
[11]Saleem Basha , Dhavachelvan P “Analysis of Empirical Software Effort Estimation Models” (IJCSIS) International Journal of Computer Science and Information Security, Vol. 7, No. 3, 2010
[12]Carroll, Edward R. “Estimating Software Based on Use Case Points.” 2005 Object-Oriented, Programming, Systems, Languages, and Applications (OOPSLA) Conference, San Diego, CA, 2005.
[13]1Vahid Khatibi, 2Dayang N. A. Jawawi “Software Cost Estimation Methods: Review”, Journal of Emerging Trends in Computing and Information SciencesVolume 2 No. 1 January 2011