ISSN: 1992-8645 www.jatit.org E-ISSN: 1817-3195
365 1
BABAK ESMAEILPOUR GHOUCHANI*, 2AZIZOL ABDULLAH, 3NOR ASILA WATI ABDUL HAMID, 4AMIR RIZAAN ABDUL RAHMAN
1,2,3,4
Faculty of Computer Science and Information Technology, UPM Malaysia E-mail: [email protected] , [email protected], [email protected],
4
ABSTRACT
Most of the distributed systems such as a cloud environment have a nondeterministic structure, and it would cause a serious problem to perform tasks with a time limit. Therefore, many prediction models and performance analyzes being used in the cloud to determine environment for users. Nevertheless, most of these models have a single objective for optimal resource absorption. Which means, they considered just one objective, such as a time limit and other issues are overlooked. In this paper, we proposed a novel model in Cloud todetermine environment for the real-time workload. We applied a multi-objective model to absorb optimal resources under reasonable user cost and maximum user sharing. Performance evaluation on CloudSim proves that the new approach outperforms other existing, state-of-the-art methods.
Keywords: Cloud Computing, Prediction Model, Time Series, Feedback Based Prediction Model, Resource Provisioning
1. INTRODUCTION
The non-real time system could apparently work well for real- time workload, but it could collapse in certain rare, but possible situations[1]. If all the critical time constraints cannot verify by the host, and the system does not have specific mechanisms for handling real-time tasks, then it could collapse. Most of the parallel and distributed systems use a worst-case design methodology when they want to be suitable for the real-time workload. However, this strategy has very low efficiency in resource utilization, and also it can impose more cost for users and power consumption for providers. The reason behind the worst-case design methodology is the lack of predictability for distributed systems. In most supercomputers, during a process, the number of allocated resources remains unchanged. The simplest strategy to prevent a deadline miss during a peak load condition is to allocate more resources. Cloud computing prepares a strong opportunity for users, to request resources on demand, and also users have a chance to access a large number of resources during a peak load condition. However, the long initialization time of resources may cause system delay or failure during a process. The first and simplest solution is to ask the customers to determine the future requests.
Therefore, their requests can be done on time with the cloud service provider. However, it seems impossible because first, the customers have no duty to propose their schedule. Second. It seems to be unable to know when the computing resources are needed. Third, changing the combination of customers would be unpredictable. Fourth, an actual schedule has an ability to change at any time [2]. In the second solution, the incoming workload is classified based on some important metrics to help system to have powerful performance analyze. Analyzing a system performance needs a powerful understanding to make a decision when and how to scale virtual resources. Unfortunately, general classical systems are not suited for running a real-time workload, because several internal mechanisms are included that cause unbounded delays and a high level of unpredictability. Using reactive and feedback methods are the interesting way to adapt the system behavior dynamically. Therefore, some selected QoS metrics is kept under control even in the overload situations. Therefore, parameters will be reconsidered after the each feedback loop. According to the mentioned criteria, it is impossible to prevent failure, but it is possible to minimize their effects.
In fact, a soft real-time application can partially tolerate a degree of performance degradation without completely ignoring the timing constraint.
ISSN: 1992-8645 www.jatit.org E-ISSN: 1817-3195
366 There is no way to keep the system performance within a threshold if system missed too many deadlines. If we use less virtual resources, the cost of services from the cloud provider will become less and the system will need less power consumption. However, when the peak load occurs, the system or performance system will collapse. Therefore, the only proper solution for these problems are a resource demands prediction model and preparation of the Virtual Machines (VMs) in advance[3][4].
The rest of the current paper is structured as follows. In Section 2, some literature related to our research are reviewed. Section 3 introduces the proposed method and the prototype implementation. A discussion of the research results and usefulness of the proposed model explained in Section 4. The paper concludes with some comments on future research in Section 5.
2. LITERATURE REVIEW
Performance analysis and prediction model need a potent understanding of the system. This is mainly because, the real-time control completely depends on sensory input data and environmental conditions, which cannot fully replicate. The system must be analyzable to achieve a desired level of performance, to predict the consequences workload. One of the important workload characteristics is burstiness; it has a critical impact on resource provisioning and understanding a peak load on the performance of the cloud-based applications. Most of the predictors and performance analyzer have the challenge to understand systems and workload completely to model them. They use a different technique to determine system and identify the type of a workload and predict the changes in that type over the time.
2-1-Deterministic or non-deterministic:
The system can be categorized as a nondeterministic or deterministic, The qualification of a process as nondeterministic or deterministic is determined by the possibility of its prediction with an available model [5]. The conception of partial determinacy is based on the convention that one chooses predictability of an observed process with a certain predictive model when the observed process has a sign of randomness[5].
The deterministic behavior of a component is desired because it simplifies the understanding of the real-time behavior. In all deterministic systems the following issues must be completely clarified 1- timeline 2- logical reasoning based on a
deterministic cause and effect relationship 3- testability of a system [6]. Also, in terms of real-time system design before designing timing of a real-time system, it must be analyzed for how the system tolerates an uncertain observation. Scheduling requires having a time constraint on tasks’ execution, and it is impossible in non-deterministic environments to have without the proper prediction model. If a task cannot be guaranteed within its time constraints, the system must inform it in advance, to take substitute actions. Due to the uncertainty in the cloud, prediction models would be successful if the uncertainties are considered[6].
2-2-Real-Time Workload:
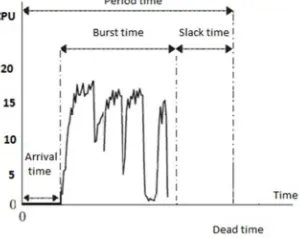
[image:2.612.343.493.372.491.2]In a real-time system, the meaning of the workload behavior depends on the temporal features of the computational activities (Figure 1). Also, in the soft and none real-time workloads the definition of workload denotes to the theory of standard queuing. According to that theory, the traffic intensity represents the expected number of jobs that arrive per mean service time.
Figure 1: Real-time workload
However, this definition does not task time limit take into account; hence, it is not mostly useful to define real-time workloads. If there is no feasible schedule based on worst-case assumptions for real-time tasks, then a system would be overloaded and probably one or more tasks will miss their deadline.[7]
ISSN: 1992-8645 www.jatit.org E-ISSN: 1817-3195
367 2-3-Resource Management:
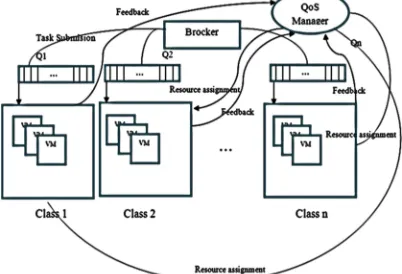
[image:3.612.90.291.262.399.2]Resource allocation must be fast enough and have an adequate reflection to requests. If a resource allocator does not have fast reflection, then it causes "noise of ignorance" problem [5]. Resource allocator must also consider the impact of its peripheral factors such as a resource sharing in a Cloud. The number of users in a Cloud is always unknown; that is causing a “dynamical noise”. The effect of these problems needs to reduce. Therefore, several solutions have been proposed to solve these problems 1- Resource Classification 2- Escalation strategy 3-Feedback based control and prediction 4- Checkpoint.
Figure 2 Task Classification Diagram
2-3-1-Resource classification:
Giorgio Buttazzo and et al. proposed QoS manager partition's system by using some mechanisms and policy. The mechanism being used for conceding a specified amount of resources to each task and as a base to modify the scheduling parameters.
The QoS manager uses the policy for deciding how to classify resources among tasks. Also, the QoS manager can perform its dynamic resource assignment decisions by using some form of feedback from the system as you can see in Error! Reference source not found. [4].
2-3-2-Sclation strategy:
The workload resource requirement may change over time and also user may have a different request. In these cases, fixed VM capacity may lead system to performance degradation. This can be addressed by dynamically scaling the VM according to the hosted application requirement. Most auto-scaling are threshold based; VM capacity will dynamically be increased or decreased if they exceed the predefined threshold values
according to the need without turning off the VMs [8]. However, initialize time for a new virtual instance in a cloud is not quick, and they have several minutes delay for new VM allocation in cloud hosting platforms[9]. The vertical scaling strategy provides a huge amount of resources, but it incurs a considerable waste of computing[10]. Due to the weaknesses of these two models, it is important to predict the number of requests before they received.
[image:3.612.316.520.497.572.2]2-3-3-Feedback based prediction model: The prediction model based on the feedback is mostly based on the difference between the predicted and the real value. Feedback has some advantages for system performance; it helps the system to be stable and amend itself. Feedback loops take the system output into consideration. The feedback controller sets some points in the evaluation of a desired value for the prediction model to converge towards stability around those points for desired QoS. The overview structure of a feedback prediction model is shown in Figure 3 Feedback controller is a system that has frequent connections with the environment in two directions. The actions formed by the actuators strictly depend on the present sensory data. As it clears some basic linear time series(such as MA, Mean, ARMA, GARCH, ARIMA) return an error as a feedback and involving them for future results. In these systems, sensing and control are trusted together. Sensors are often installed on actuators and are used to search the environment and continuously correct the actions based on real data[11].
ISSN: 1992-8645 www.jatit.org E-ISSN: 1817-3195
368 Figure 4: Checkpoint Mechanism
2-3-4-Checkpointing:
In this study checkpoints indicate points in the execution where a prediction should be achieved, and also the performance metrics should be sent back to the QoS controller as a feedback. There are some static (dynamic) thresholds in the model that bring out the checkpoint is called the “hook.”
2-3-5-Instability problem:
The instability problem is created on both the overloading and underloading problem. Most of the current resource managers just have to monitor for overload situations and are not able to monitor under load situations. Monitoring can solve the instability problem by observing both the deadline miss ratio and the system utilization[4]. Overload conditions can occur because of different events such as the bad system design, simultaneous arrival of events[7]. The under-load problem happens if the reserved resources are more than the actual demand [12].
3. METHODOLOGY:
Buttazzo proposed a simple method in his research to compute the traffic intensity for both real-time and none real-time tasks. Buttazzo suggested dividing the whole interval to the some small parts[4]. Then, the load in a given interval [ta, tb] can be defined as:
,
, ,
, 1
It is not clear how large enough the interval [ta, tb] should be to estimate the overall system load. According to this method, the load is computed from the current time t to deadline ([tk, dk] ) in all intervals. If l remains less than 1, then the real-time system has an opportunity to finish its jobs before a deadline.
3-1-The impact of checkpoints
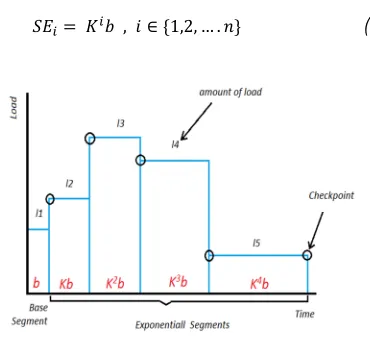
Unfortunately, the preparation of the requirements for real-time systems is so hard. Because they must be constructed from redundant resources that are capable of avoiding task failure. Also, it must be mentioned that the redundant resources cause system being significantly expensive. Figure 5 clearly depicted, each workload is segmented and at the end of each segment a checkpoint adds for a better scaling.
In the rest of the paper, each segment shown as SE and SEi, would be the i’th time segment of the prediction model and calculated by:
[image:4.612.328.513.134.306.2]! "!# , $ ∈ &1,2, … . *
(2
)Figure 5. Checkpoint For Computing Feedback
By adding the size of whole segments (e.g. each segment had k time bigger boundary than the prior segment) the total time for performing tasks can be calculated in a simple geometric progression by:
+ $ , - , $ . / # 0 /# 0
/ # 0 /1# 0 ⋯ 0 /3# 3
Therefore, it can be written as follows:
+ $ , - , $ . /
56
78
56 , / 9 0 4
K value is very important because it has a direct impact on the number of checkpoints. For finding the role of classification and model accuracy, two separate series of experiments had done.
3-2-SVM clustering:
Support Vector Machine (SVM) being used for data analysis and pattern prediction of the next segments load by classifying tasks, and SVM used to classify tasks based on CPU demands and the size of Cloudlet in this experiment. Figure 6 shows, how workloads are distributed.
ISSN: 1992-8645 www.jatit.org E-ISSN: 1817-3195
369 Also, the results can be used for the next phase to attract the economic resources with the economic model.
Figure 6: The Distribution Chart Of Entering Tasks
In the following Mean model has been implemented as a none feedback based model and some useful time series model have been used as a feedback based prediction models such as (MA,ARMA and ARIMA) which are useful for different purposes
4. EVALUATION:
4-1-Environment Settings: In this experiment:
We settled a cloud environment in CloudSim with 10 data centers. VMs had the same configuration and performance with VMs in Amazon Elastic Compute Cloud (Amazon EC2). Resource allocation intended to be dynamic and the number of training are automatically adjusted according to the application needs. The period for performing the sample tasks was one hour; the system was performed for 24 times (a day) for training. Every hour all tasks were executed with their time constraint. During a training process, the following performance metrics were extracted. As we mentioned before, it is impossible to allocate resources exclusively in a cloud; the best effort is to share resources among more users. In all experiments, the maximum amount of resource sharing considered up to a million users. During this experiment user sharing was stopped when tasks had missed the deadline. The user determined the number of segments and K, and it should be an integer greater than 1 to establish convergence during a reform process. If K considered a large value, fast reformed process with wrong value achieved. Otherwise, slow process with accurate value achieved. Researchers of this article found that the number of K has the inverse ratio of the number of training segments. Otherwise, it can
cause the number of tasks not be enough in primary segments for training.
4-2-Evaluation techniques:
These feedbacks based prediction models were 24 times tested and the following performance metrics were computed during each test. In this study, we followed these goals:
1- All tasks perform within the deadline 2- The selected prediction model must be
more effective than other models
3- The prediction models must have better accuracy.
For the first experiment feedback based prediction models were compared with an SVM-based prediction model. This experiment will show the effect of feedback on real-time workload when there is a time constraint on tasks. For the second experiment, researchers showed the efficiency of feedback-based prediction models.
1- To converge to the stable point during a reform process
2- To reach the maximum user sharing 3- To impose less cost for users.
In the third experiment, we considered to observe the prediction models' accuracy; then we measured if these models were fitted well. Hence, for above experiments we used following evaluation metrics.
4-2-1-Evaluation metrics:
In this study, according to the objectives that we've been looking for, several metrics computed and compared to evaluate the performance of our model. The first objective of this research was to design a model that would ensure that, in the face of real-time tasks does not violate the time limit. For this reason, the number of time limit violation in all models reviewed and compared. The second objective is truly important, therefore following metrics have been studied to evaluate how efficient model is. In this study, some metrics such as RMSE and R2 were considered to evaluate how models are effective and accurate. Also, the number of users who have shared resources between them, and the cost of those resources is considered as evaluation metrics to compare the model's efficiency.
4-3-Performance evaluation: 4-3-1-Deadline violation:
ISSN: 1992-8645 www.jatit.org E-ISSN: 1817-3195
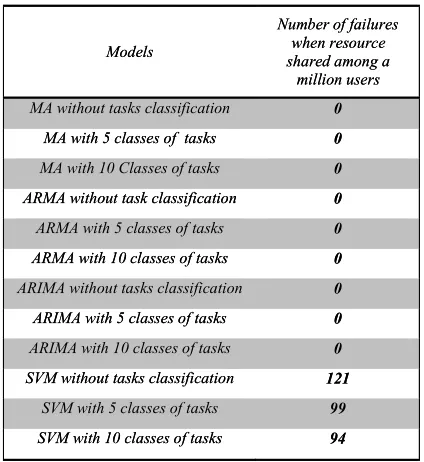
[image:6.612.83.295.210.441.2]370 the same time, the impact of classification on results was considered. A total 12 experiments were carried on to show the number of failures in each test when resources are shared among a million users. In all tests, two checkpoints were considered to adjust the prediction results based on the number of requested resources.
Table 1: Number Of Failures In Each Model When Resource Shared Around 1 Million Users
As you can see in
Table 1 all feedback based prediction models shared their resources with one million users, and they performed real-time tasks successfully within a deadline. It must be mention that, SVM-based mean prediction model that is predict requests based on the previous loads were failed to finish tasks just before a deadline. Also, the results of these experiments show that none-feedback based prediction model will have to deal with one of the following solutions.
1. The model must start with more primary resources
2. Tasks classified into different classes based on some characteristics.
3. Resources share between fewer users. 4. Increase the number of checkpoints
For the first solution, there is no specific and exact mechanism to estimate the primary resources. The second solution examined, and as you can see in the
above table, the last two experiments use task classification for incoming tasks. In those experiments,
we did task classification based on tasks size and the
number of required CPU then the number of unsuccessful tasks decreased. However, there is a limit to the number of classes based on our experiments. When the number of
classes was considered too much, the number of samples in some classes became too less. This situation will cause
weak, or even no prediction and the results will be displayed in the measurement of the effectiveness of the
algorithm. The third solution is attainable if we accept the system remain unstable for a few hours for training to
adjust the system to the proper number of users to share resources. However, this solution has the feedback concept inside, because it used the failures in previous
steps as a feedback to stabilize the situation to share resources with the proper amount of users. The following
table shows how the third solution will work. In Table 2 we performed mean model with and without SVM classification for five times. We let the system decrease the number of users and increase the number of resources both together.
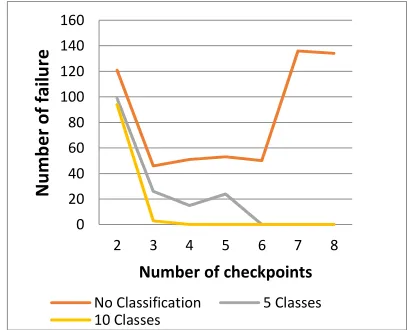
[image:6.612.306.529.497.605.2]Then we can conclude the following results; classification has a positive impact on the rate of failure handling, and if we do not have a plan to guarantee system against failure. The Mean model has faster adaptive process than the feedback based model. The fourth solution was examined, and the result was obtained. As it can be seen in Figure 7, the results show if task classification coupled with increasing the number of checkpoints, then the number of failure starts to reduce. This solution also needed to get the feedback from the previous steps to solve the failed problems. Because specific solutions to measure the exact amount of checkpoints is not provided.
Table 2: The Number Of Failed Tasks After Five Performs
Model
Number of failed task in different test
First run
Second run
Third run
Fourth run
Fifth run
Mean model without classification
583 0 186 107 0
Mean model
with 5 classes 258 0 0 0 0
Mean model with 10 classes
225 0 0 0 0
4-3-2-The models efficiency:
To measure the effectiveness of the prediction models, at first step we considered the amount of time that the system needs to reach the sustainable convergence point. All feedback based models performed with two checkpoints during this experiment and the sustainable convergence point considered the maximum user sharing. The following figure shows, model converge is faster than others.
Models
Number of failures when resource shared among a
million users
MA without tasks classification 0
MA with 5 classes of tasks 0
MA with 10 Classes of tasks 0
ARMA without task classification 0
ARMA with 5 classes of tasks 0
ARMA with 10 classes of tasks 0
ARIMA without tasks classification 0
ARIMA with 5 classes of tasks 0
ARIMA with 10 classes of tasks 0
SVM without tasks classification 121
SVM with 5 classes of tasks 99
SVM with 10 classes of tasks 94
Models
Number of failures when resource shared among a
million users
MA without tasks classification 0
MA with 5 classes of tasks 0
MA with 10 Classes of tasks 0
ARMA without task classification 0
ARMA with 5 classes of tasks 0
ARMA with 10 classes of tasks 0
ARIMA without tasks classification 0
ARIMA with 5 classes of tasks 0
ARIMA with 10 classes of tasks 0
SVM without tasks classification 121
SVM with 5 classes of tasks 99
ISSN: 1992-8645 www.jatit.org E-ISSN: 1817-3195
371 Figure 88 shows the impact of classification and model on how much time models need to reach the maximum user sharing. The whole feedback based prediction models with ten classes' share resources among more than 900,000 users before 11th period. The other hand, models without any classification could not share resources among more 500,000 users before 13th period.
Table 3 shows the prediction model based on ARIMA is more successful than other feedback based models.
This model also showed classification helped system to have better resource sharing in all scenarios. Also, we found there was a tradeoff between the number of classes and the number of training samples. The system cannot increase the
number of classes individually and keep the number of test samples unchanged. The results in
Figure 7 clearly show; if the number of classes reached 15, there are no more improvement in
[image:7.612.310.526.218.416.2]resource sharing.
Table shows the impact of classification and the number of checkpoints on the sharing of resources. As we can see clearly in Figure 8, all feedback based models with ten classes have a better average for user sharing among all experiments.
Figure 7: Number Of Tasks That Are Failed To Finish Before A Deadline
[image:7.612.91.295.275.440.2]Also, Table 3 shows classification has a positive impact on user sharing, and the whole feedback based prediction models have better resource sharing in comparing with others. Table 4 shows the improvement percentage on sharing resources based on the impact of classification and the number of checkpoints in all experiments. The experiments that have the same prediction algorithm compare with an experiment that does not have a classification and just have two checkpoints. The results shown, increasing the number of checkpoints is not effective without classification. Also, we can see all experiments with five checkpoints are less effective for resource sharing than four checkpoints.Our investigation, in this case, shown when the number of checkpoints starts to increase, then the number of samples in a training segment of proposed models have decreased.
Figure 8: How Models Converge To Maximum User Sharing
15 Classes
10 Classes
5 Classes
Without classifi
cation Prediction
model based on MA
753689 745538 592810 581103
Prediction model based on
ARMA
757002 744831 571092 547803
Prediction model based on
ARIMA
749658 745539 592820 581104
Table 3: The Average Of User Sharing After 24 Periods
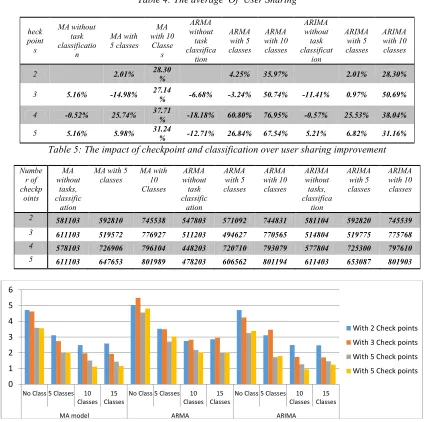
We evaluate the effectiveness of feedback based models by comparing the RMSE of each model. As we said before in evaluation metrics, this metric is defined as the square root of the mean squared error. A smaller RMSE value indicates a more effective prediction scheme. Therefore, we computed RMSE for all models with a different number of classes and checkpoints. The following figure shows very clear; all feedback based model with ten classes have better results among models with a different setting. Also, the results show that increasing the number of classes is not an 0
20 40 60 80 100 120 140 160
2 3 4 5 6 7 8
N
u
m
b
e
r
o
f
fai
lu
re
Number of checkpoints
No Classification 5 Classes
10 Classes
0 5 10 15 20 25 30
Share between more than 500,000
users
Share between more than 900,000 users
Maximum user sharing
ISSN: 1992-8645 www.jatit.org E-ISSN: 1817-3195
372 individual solution to improve the performance of prediction models because models with 15 classes are not more efficient than models with ten classes. Also, it is very clear; the number of checkpoints has a positive impact on efficiency except for few experiments. Among other results ARIMA feedback based model shows it has a better efficiency than MA and ARMA feedback based model.
4-3-3-Accuracy
In Figure10, R2 computed (for all models) to find which models are more accurate than others; the closer result to one is the most accurate one. Figure10 shows in none feedback based models classification has a positive impact on accuracy, although the results for feedback based are reversed. In all feedback based model classification caused less accuracy in results.
MA and ARIMA feedback based model are more accurate among other experiments because, the amount of R2 is closer to one than other models in all their experiments. The Mean model without feedback and classification has the worth accuracy among other models.
5- CONCLUSION:
In this paper, we have proposed a feedback based model and described a model for automatic identification and resolution of anomalies and automatic recognition of under-provisioning in a Hybrid Cloud. Our experimental results show that while we obviously cannot guarantee that we have created a system without exceeding the deadline.
It is very difficult to identify a minimum requested resource in proposed model that satisfies a time limit for a given workload, even using training and testing. However, our system is capable of identifying the proper amount of required resources by using checkpoints, tasks classification methods, feedback based predictive models, and with adaptive resource scaling. Cloud system can adopt our approach not only to offer their customers an SLA for without violation deadline guarantees but also to shrink the number of assigned resources to reduce the customer’s costs. Our model currently used to perform anomaly prediction in advance and is capable of overcoming the virtual machine boot-up latency problem
We are currently extending our system to support Hybrid Cloud host to incorporate the effects of heterogeneous physical machines on the prediction model, and we are planning to extend with more sophisticated methods.
REFERENCES:
[1] C. Bible, W. Publishing, and J. Wiley, Cloud Computing Bible. Wiley Publishing. [2] Y. Jiang, C.-S. Perng, T. Li, and R. Chang,
“Asap: A self-adaptive prediction system for instant cloud resource demand provisioning,” in Data Mining (ICDM), 2011 IEEE 11th International Conference on, 2011, pp. 1104– 1109.
[3] J. Yin, X. Lu, H. Chen, X. Zhao, and N. N. Xiong, “System resource utilization analysis and prediction for cloud-based applications under bursty workloads,” Inf. Sci. (Ny)., vol. 279, pp. 338–357, 2014.
[4] G. Buttazzo, G. Lipari, L. Abeni, and M. Caccamo, Soft Real-Time Systems. 2005 Springer ScienceBusiness Media, Inc., 2005. [5] D. A. Bezruchko, Boris P and Smirnov,
Extracting Knowledge From Time Series. Springer Science \& Business Media, 2010. [6] A. R. Systems, Advances in Real-Time
Systems. Springer Heidelberg Dordrecht London New York, 2012.
[7] G. C. Buttazzo, Hard RealTime Computing Systems. Springer New York Dordrecht Heidelberg London, 2011.
[8] H. Gilgen, Univariate Time Series in Geosciences. Springer-Verlag Berlin Heidelberg, 2006.
[9] H. C. Lim, S. Babu, J. S. Chase, and S. S. Parekh, “Automated Control in Cloud Computing : Challenges and Opportunities,” Design, vol. C, pp. 13–18, 2009.
[10] J. Yang, C. Liu, Y. Shang, B. Cheng, Z. Mao, C. Liu, L. Niu, and J. Chen, “A cost-aware auto-scaling approach using the workload prediction in service clouds,” Inf. Syst. Front., vol. 16, no. 1, pp. 7–18, Oct. 2013.
[11] Y. Lu, T. Abdelzaher, C. Lu, L. Sha, and X. Liu, “Feedback control with a queueing-theoretic prediction for relative delay guarantees in web servers,” Real-Time Technol. Appl. - Proc., pp. 208–217, 2003. [12] S. Chaisiri, B. S. Lee, and D. Niyato,
“Optimization of resource provisioning cost in cloud computing,” IEEE Trans. Serv. Comput., vol. 5, no. 2, pp. 164–177, 2012. [13] Y. Du, Y. Cai, M. Chen, W. Xu, H. Yuan, and
ISSN: 1992-8645 www.jatit.org E-ISSN: 1817-3195
[image:9.612.89.513.100.522.2]373
Table 4: The average Of User Sharing
heck point s
MA without task classificatio
n
MA with 5 classes
MA with 10
Classe s
ARMA without
task classifica
tion
ARMA with 5 classes
ARMA with 10 classes
ARIMA without task classificat
ion
ARIMA with 5 classes
ARIMA with 10 classes
2 2.01% 28.30
% 4.25% 35.97% 2.01% 28.30%
3 5.16% -14.98% 27.14
% -6.68% -3.24% 50.74% -11.41% 0.97% 50.69%
4 -0.52% 25.74% 37.71
% -18.18% 60.80% 76.95% -0.57% 25.53% 38.04%
5 5.16% 5.98% 31.24
% -12.71% 26.84% 67.54% 5.21% 6.82% 31.16%
Table 5: The impact of checkpoint and classification over user sharing improvement
Numbe r of checkp
oints
MA without
tasks, classific
ation
MA with 5 classes
MA with 10 Classes
ARMA without
task classific
ation
ARMA with 5 classes
ARMA with 10 classes
ARIMA without tasks, classifica
tion
ARIMA with 5 classes
ARIMA with 10 classes
2 581103 592810 745538 547803 571092 744831 581104 592820 745539
3 611103 519572 776927 511203 494627 770565 514804 519775 775768
4 578103 726906 796104 448203 720710 793079 577804 725300 797610
[image:9.612.89.527.545.711.2]5 611103 647653 801989 478203 606562 801194 611403 653087 801903
Figure 9: RMSE of Feedback Based Model With Different Number Of Classes And Checkpoints
Figure10: The Accuracy Of Models
0 1 2 3 4 5 6
No Class 5 Classes 10
Classes 15 Classes
No Class 5 Classes 10
Classes 15 Classes
No Class 5 Classes 10
Classes 15 Classes
MA model ARMA ARIMA
With 2 Check points
With 3 Check points
With 5 Check points
With 5 Check points
0 0.2 0.4 0.6 0.8 1 1.2
R
2
MODELS
Feedback based Feedback based
Feedback based Feedback based
Feedback based Feedback based
Feedback based Feedback based
Feedback based Non-feedback based