© 2005 - 2012 JATIT & LLS. All rights reserved.
ISSN: 1992-8645 www.jatit.org E-ISSN: 1817-3195
SYSTEMATIC SIMULATION ON SAFE DRIVING BEHAVIOR
IN STEEP CURVED SECTIONS OF TWO-LANE
1
ZHIGUO ZHOU, 2HAICHENG ZHANG, 1YUANWU ZHAN
1
ZheJiang Institute of Communications, Hangzhou 311112, Hangzhou, China
2
Urban mass transit railway research institute, Tongji University, Shanghai 201804, Shanghai, China
ABSTRACT
Three models are established under the multivariate nonlinear regression analysis technology, and on the base of the existing and survey data, which are the double-lane road alignment safety evaluation model, the psychological reaction of driver safety evaluation model and the driving safety comprehensive evaluation model. Then, a quantitative evaluation of the experimental section is made by the comprehensive established evaluation model, and the security level is gained. Moreover, how to improve the security level of the experimental section is advanced, that is to set the hollow LED variable speed-limit sign. Finally, a comparison of the experimental section’s security level before and after carrying out the hollow LED variable speed-limit sign is made by using the simulation software to verify the effectiveness and feasibility of this measure.
Keywords: Steep Curved Sections, Driving Safety Model, Hollow LED Variable Speed-Limit Sign, System
Simulation
1 INTRODUCTION
The driving safety behavior study[1] of double-lane steep curved sections is the basis for constituting the road safety evaluation standard, and it is one of the major measures for reducing the road accident rate.
Now scholars at home and abroad used the theory of qualitative analysis method to study on the safety of the steep curved sections, and Lixin Wu[2] applied the velocity distribution method which was in consistency analysis of IHSDM, it analyzed the cause of the accident happened in the dangerous part of the road[3][4] from the connection of the driver’s drive and road alignment; Jiangang Jiao[5](2006)discussed the relationship and rules of the running speed of automobile、 road alignment、 road environment and the physiological and psychological requirements of the drivers; American scholar Leisch[6] raised the conception of the operating speed, which was using to evaluate the consistency of the horizontal and vertical alignment of the highroad.
But these study weren’t formed a comprehensive evaluation system which is based on the driver-vehicle-road’s driving safety behavior and weren’t put forward the reasonable control measures[7-8]. Based on this, the article establishes the comprehensive evaluation model from two
aspect of the road alignment and driver’s psychology, and estimates the support section of the highway, and adopts the control measures to set up the LED variable speed-limit sign on the section of the highway which have hidden safety problems[9]. And it validates the control effect by exercising the simulation software of Vissim5.30. the results of the study provide the theory reference for the traffic management and decision makers to form the security design index of road alignment and evaluation method, and it provides technical basis for the technical problems of enactment the speed-limit sign on specific sections.
2 CONSTRUCTION AND APPLICATION
OF DRIVING SAFETY BEHAVIOR OMPREHENSIVE MODEL
Traffic accident is the result of the maladjusted person, car, road dynamic system. It needs us research from two aspects of the road alignment and the different types of drivers.
2.1Road Alignment Safety Evaluation Model
(1) Evaluation indicator
© 2005 - 2012 JATIT & LLS. All rights reserved.
ISSN: 1992-8645 www.jatit.org E-ISSN: 1817-3195
money which calculated by the accident compensation for the loss of life and personal injury and the accident direct economic loss.
(2) Analysis of the correlation between road alignment index and P.
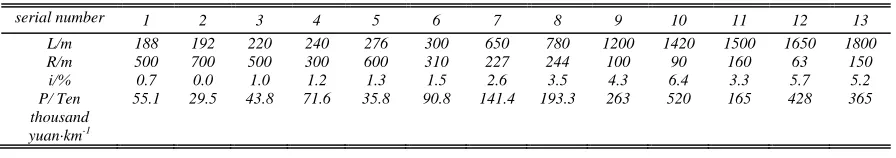
In dry conditions (The road is dry, applied to all the following), through field research, it gains the data value of the factors of the double-lane and the incident equivalent loss rate. As shown in Table Ⅰ :
TABLE I: Incident Equivalent Loss Rate Of Curve And Slope Segment In Double-Lane Highway P、Slope Length L、
Gradient I、Radius R
serial number 1 2 3 4 5 6 7 8 9 10 11 12 13
L/m 188 192 220 240 276 300 650 780 1200 1420 1500 1650 1800
R/m 500 700 500 300 600 310 227 244 100 90 160 63 150
i/% 0.7 0.0 1.0 1.2 1.3 1.5 2.6 3.5 4.3 6.4 3.3 5.7 5.2
P/ Ten thousand yuan·km-1
55.1 29.5 43.8 71.6 35.8 90.8 141.4 193.3 263 520 165 428 365
By analyzing the demonstration of the data, it can make regression analysis for “L-P”、 “R-P”、 “i-P” ,and can establish the regression equation as follows:
0.79 2
: 8099.6 ( 0.57)
L−P P= L− R = (1)
1.1873 2
: 79760 ( 0.89)
R−P P= R− R = (2) 0 .4 4 2
: 3 4 .6 8 5 i( 0 .9 4 )
i−P P = e R = (3)
From the correlation coefficient between three factors and the P, it can know: plane curve radius R, gradient I, slope length L and the incident equivalent loss rate have positive relation. By comparing the correlation coefficient value of the regression equation, it can know: plane curve radius、gradient and the incident equivalent loss rate have higher correlation coefficient than slope length. So, it can select the plane curve radius and gradient for the core influencing factors to establish the evaluation system of the incident equivalent loss rate[10].
(3) Model establishment and verification
On the basis of analyzing the core influencing factors and index in Table1, and it establishes the road alignment safety evaluation model by combining the regression technology of the multivariate nonlinear data, As shown (4):
2
( ) 0.5 ( ) 0.68 ( ) 7.02( 0.92)
Ln P = − Ln R + Ln i + R = (4)
By putting up the significance of the F test for equation (4) In the condition that the significance level is 0.01, applied to all the following, it can get: Statistical value
F
=
62.36
>
F
0.01(2,11)
, and it illuminates the highly significant of the regression equation.(4)Evaluation standard
It selects the commonly carve and slope sections of the maximum safety, the critical value
600
R
=
m
,i
=
2.5%
[11][12], and selects the steep curved sections of the minimum safety, the critical valueR
=
60
m
,i
=
6.5%
, and substituting into equation(4)to calculate for the road alignment safety evaluation model standard:Table Ⅱ : Standard For Safety Evaluation For The Carve And Slope Sections Of The Double-Lane Highway
Security Good Average Bad
the incident equivalent loss rate /Ten thousand yuan·km-1 P<80 80<P<498 P>498
2.2 The Safety Evaluation Model Of Driver’s Psychological Response
(1) Evaluation indicator and standard
It is practical to denote the driver’s psychological
stress by the heart rate, and there is certain regularity [13], but the heart rate is different for the drivers of different quality, so it can not be quantitative to response the driver’s stress level. The evaluation standard is as follows:
Table Ⅲ: The Grade Standard Of Driver Load [14]
[image:2.612.83.531.187.266.2]© 2005 - 2012 JATIT & LLS. All rights reserved.
ISSN: 1992-8645 www.jatit.org E-ISSN: 1817-3195
A N<20% Passenger can’t feel the curve, and feel smooth and comfortable extremely
B 20%<N<30% driver can feel curve, but feel smooth and comfortable
C 30%<N<40% Feel uncomfortable, receivability
D N>40% Beyond endurance, Travel is not stable
(2) Model establishment and verification
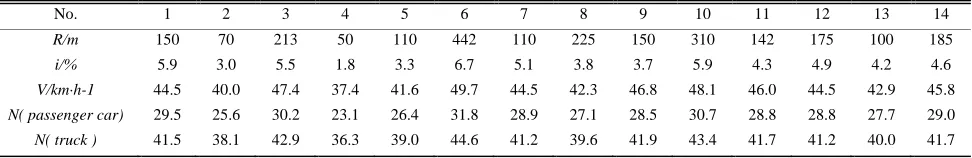
In dry conditions, Through field research, it gains the corresponding relationship data about the heart
rate growth rate N and running speed V of the passenger car and truck drivers, gradient i and the plane curve radius R, as shown in Table Ⅳ.
TABLE Ⅳ: The Plane Curve Radius Of The Double-Lane R、Gradient I、 Running Speed V And The Heart Rate Growth Rate Of The Passenger Car And Truck Driver N
No. 1 2 3 4 5 6 7 8 9 10 11 12 13 14
R/m 150 70 213 50 110 442 110 225 150 310 142 175 100 185
i/% 5.9 3.0 5.5 1.8 3.3 6.7 5.1 3.8 3.7 5.9 4.3 4.9 4.2 4.6
V/km·h-1 44.5 40.0 47.4 37.4 41.6 49.7 44.5 42.3 46.8 48.1 46.0 44.5 42.9 45.8
N( passenger car) 29.5 25.6 30.2 23.1 26.4 31.8 28.9 27.1 28.5 30.7 28.8 28.8 27.7 29.0
N( truck ) 41.5 38.1 42.9 36.3 39.0 44.6 41.2 39.6 41.9 43.4 41.7 41.2 40.0 41.7
By analyzing the data that the steep curved sections heart rate growth rate N, gradient I and running speed V in TableⅣ, and integrating the
multivariate nonlinear data regression technology. It establishes the safety evaluation model for psychological response of the different vehicle drivers, as shown in equation (5),(6).
passenger car: 2
( ) 0 . 5 4 ( ) 0 . 3 7 ( ) 0 . 0 7 ( ) 1 . 2 6 ( 0 . 8 6 )
L n N = L n V + L n i − L n R + R =
(5)
truck: 2
( ) 0 . 5 6 ( ) 0 . 0 3 ( ) 0 . 0 1 ( ) 1 . 5 3 ( 0 . 9 9 )
L n N = L n V + L n i − L n R + R =
(6) By putting up the significance test of the F for the
equation, it can know : passenger car
model
F
=
20.9
>
F
0.01(3,10)
=
6.6
; truckmodel
F
=
1158.7
>
F
0.01(3,10)
=
6.6
it indicates the highly significant of the regression equation.On the basis of theoretical analysis, it validates the model reliability by experiment.
Experimental design:it selects a 4km’s carve and slope sections of the double dragon cave scenic area in jinhua, as shown in Figure1,the maximum longitudinal slope of the line is not more than 6%,The maximum length of slope is not more than 300m, The maximum radius of horizontal curve is 550m.
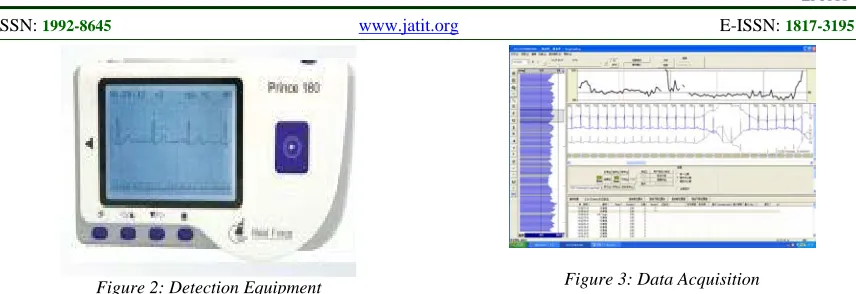
Experimental method:(1)put the ECG tester of PRINCE-180B (as shown in Figure2) on the driver’s body to record the heart rate value;(2) shoot the steep curved condition of the driveway, and denote the passenger car and truck’ s running speed
[image:3.612.83.530.74.152.2]and the corresponding time;(3) Classify the heart rate data (as shown in Figure3) that Each time corresponding, running speed and other data (as gradient), by the measured value and the equation (2),(3), it can predictive the growth rate of the heart rate ,as shown in Table v.
[image:3.612.65.551.243.322.2]© 2005 - 2012 JATIT & LLS. All rights reserved.
ISSN: 1992-8645 www.jatit.org E-ISSN: 1817-3195
Figure 2: Detection Equipment Figure 3: Data Acquisition
TABLEⅤ:The Measured Gradient And Speed ,The Measured Value And Predictive Value Of The Growth Rate Of Heart Rate
No. 1 2 3 4 5 6 7 8 9 10 11 12 13
i/% 4.1 3.2 5.3 5.8 3.1 4.0 3.5 4.2 4.0 4.5 3.9 2.9 3.8
R/m 300 420 280 240 470 350 550 500 520 310 380 500 320
V passenger car/km·h-1 38.2 33.4 39.1 42.2 29.1 33.8 28.7 32.6 31.5 37.6 32.3 29.2 34.9
N measured value/% 32.4 29.9 38.3 39.1 27.8 32.2 28.4 31.5 28.2 36.5 31.1 24.4 32.9 N predictive value/% 34.8 28.9 39.0 42.4 26.3 31.9 27.0 31.1 29.9 35.6 30.7 25.6 32.1
V truck /km·h-1 27.2 23.4 28.1 27.2 24.1 28.8 27.7 28.6 25.5 29.6 26.3 22.2 24.9
N measured value/% 32.5 30.2 32.7 30.3 28.2 31.2 30.3 31.4 28.1 29.4 27.5 26.3 28.5
N predictive value/% 29.1 26.4 29.8 29.4 26.8 29.9 29.0 29.7 27.8 30.5 28.4 25.5 27.6
The validated results that have colligate the growth rate of heart rate model for the passenger car and truck drivers , can consider that the growth rate of heart rate predictive regression model based on the measured value is high
precision(
N
passenger car error=5.1%;N
truck error=7.3%),it is able to reflect the actual condition.2.3 Establish The Comprehensive Evaluation Model About The Driving Safety Behavior
From the above analysis, it will know that the road alignment safety model is to the incident
equivalent loss rate P as the index, and correlate with the plane curve radius and the gradient, as
P
=
f R i
( , )
; in a similar way, the driver’s psychological response safety model is to the growth rate of heart rate N as the index, and correlate with the plane curve radius , the gradient and the running speed, asN
=
g R I V
( , , )
. Based on the relativity of the equations, it can examine thatP
=
h R I V N
( , , ,
)
. It combines with the existing investigation of the of the R ,I
,V
(Accident vehicle average speed on the section) to form the statistical data, as shown in Table Ⅵ:TABLEⅥ:The Truck And Passenger Car Average Speed V And The Growth Rate Of Heart Rate N
No. 1 2 3 4 5 6 7 8 9 10 11 12 13
V truck /km·h-1 27.2 23.4 28.1 27.2 24.1 28.8 27.7 28.6 25.5 29.6 26.3 22.2 24.9
N truck /% 29.1 26.4 29.8 29.4 26.8 29.9 29.0 29.7 27.8 30.5 28.4 25.5 27.6
V passenger car/km·h-1 38.2 33.4 39.1 42.2 29.1 33.8 28.7 32.6 31.5 37.6 32.3 29.2 34.9
N passenger car/% 34.8 28.9 39.0 42.4 26.3 31.9 27.0 31.1 29.9 35.6 30.7 25.6 32.1
It can establish the model as follows which is according to apply the multivariate nonlinear data regression technology.
passenger car:L n P( ) = −0 .1 6L n R( )+ 0 .3 1L n i( )+1 .0 1L n V( )+ 0 .5 7L n N( ) (7)
[image:4.612.94.522.71.218.2] [image:4.612.73.545.253.372.2] [image:4.612.69.546.579.652.2]© 2005 - 2012 JATIT & LLS. All rights reserved.
ISSN: 1992-8645 www.jatit.org E-ISSN: 1817-3195
By putting up the significance of the F test for the above model, it gains that: in the passenger car
model, the measured statisticsF = 5 6 8 . 9 > F0 . 0 1( 3 , 9 ) = 7 ; in the
truck model, the measured statistics F = 2 1 0 0 . 3 > F0 . 0 1( 3 , 9 )= 7 , it
indicates the highly significant of the regression equation.
2.4Application And Evaluation Of The Selected Road
On the measured road which is selected, it evaluates the comprehensive evaluation model by combine the driving safety behavior, the results can be shown in Table Ⅶ:
TABLEⅦ:Evaluation Of Estimate Of The Incident Equivalent Loss Rate P In Measured Road
No. 1 2 3 4 5 6 7 8 9 10 11 12 13
P passenger car 106.3 67.2 198.1 210.6 66.1 107.2 78.6 90.9 73.7 122.4 89.1 55.5 88.2
P truck 186.3 128.3 222.7 266.1 102.9 151.8 104.3 138.2 127.8 190.3 138.8 98.6 157
Uniting the evaluation standard in Table Ⅶ, it can gain that each bends have the potential safety hazard and need to take some corresponding safety control measures.
3 SCHEMATIC DESIGN OF THE
TRAFFIC ACCIDENT CONTROL MEASURE IN DOUBLE-LANE STEEP CURVED SECTIONS
When it is a "line - plane curve" linear combination in a mountainous area, The car speeds quickly in the straight sections. near bend corners, the mountain, vegetation and climate environment and light effects lead to the bad visibility for the driver. The driver can not clearly see the road ahead and complete the deceleration demand in bend, so now it is the more suitable control measure to setting up the hollow LED variable speed-limit sign.
3.1 Design Principle Of The Speed-Limit Sign
(1) Establish the position of the sign
As shown in Figure 4, suppose the car is going at the constant rate of v1, when the car has get to point A, the driver finds that there is the speed-limit sign at point C about L meters ahead, and by recognizing and comprehending, the driver completes the reaction process and takes action at point B(
L
1<
L
), and reduces the speed to v2(the maximum safe turning speed)at point D, and accesses the transition curve of DE constantly. Because of the terrain or environmental factors, when the driver takes action, the car has moved to point B'(L
2>
L
). In other words, the car can't reduce the speed to v2 at point D, and that will cause [image:5.612.79.533.210.252.2]accidents. So when set up the speed-limit sign, we need maximally account the short-cut process of S', which is at the sect of DC.
Figure 4: Cognitive Signs And Moderating Process Sketch Map
By analyzing, it gains that: '
S ≥ S , there into, S
is the brake distance, which includes two parts of the running distance in the response time and the brake distance from slowdown to the end of the brake [15] so that if we set the speed-limit sign at about S meters ahead the point D, which is the starting point of the transition curve, the driver can read the information and take the action easily.
2 2
' 1 1 2
m i n
3 . 6 2 5 4 ( )
v v v
S S t
ϕ −
= = +
+ Ψ (9)
S
is the brake distance;v
1is the initial brake© 2005 - 2012 JATIT & LLS. All rights reserved.
ISSN: 1992-8645 www.jatit.org E-ISSN: 1817-3195
the coefficient of rolling resistance; i is the Longitudinal Slope of the road.
(2) Confirm the value on the sign
According to the Table 4,if the passenger can not feel the curve, and it is smooth and comfortable extremely in driving process, it should choose the comfort threshold N=20% as a precondition of the driver safely driving through the bend. Combining the equation (5),(6)and the actual value of the plane curve radius and gradient in the different sections , it can calculate the safety speed threshold
v
2 when entering the corresponding transition curve:Passengerca
1.26 ( (20) 0.07 ( ) 0.37 ( ) )
0.54 2
Ln Ln R Ln i
v
=
e
+ − − (10)truck:
(20) 0.01 ( ) 0.03 ( ) 1.53 0.56 2
Ln Ln R Ln i
v
e
+ − −
=
(11)(3) Plan implementation of the selected road
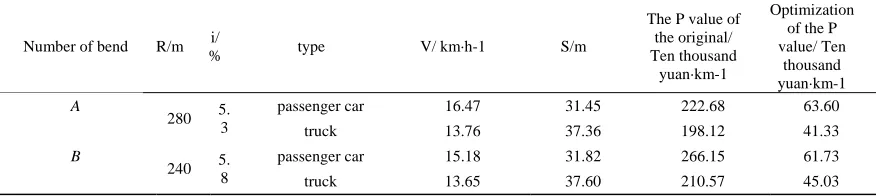
According to the evaluation standard of P, it selects
P
>
80
in experimental section, the bends of number 3,4 are with the bigger safety potential safety hazard, to be numbered A,B. It can be the theoretical arithmetic according the brakedistance and the running speed and the equation (6),(7),(8), now the average speed before braking is v1=40km/h, passenger car
φ
is selected 0.6, truck φ is selected 0.4,t is selected 2s, f is selected 0.02, N is selected 20%, and the result is in TableⅧ. Based on the truck brake distance, it is set the sign at a distance of 38m before the bends of A,B, When the induction is passenger car, it is to be shown the speed limits are 16km/h and 15km/h,When the induction is truck, it is to be shown the speed limit is 13km/h.to be compared the original incident equivalent loss rate P with the P that has be optimized, the theory result that set the speed-limit sign is obvious. According to the《Approach to roadtraffic accidents》[16], the urban residents' death
compensation costs are 0.6million、funeral costs are
15 thousand、direct economic losses are 10 thousand, and after optimizing, it can reduce 1.5million equivalent damage accident per kilometer, that is to say it will be reduced one or two significant traffic accident in every three years.
TABLEⅧ:Parameter Calculation Of The Speed-Limit Sign In Selected Road
Number of bend R/m i/
% type V/ km·h-1 S/m
The P value of the original/ Ten thousand
yuan·km-1
Optimization of the P value/ Ten
thousand yuan·km-1 A
280 5. 3
passenger car 16.47 31.45 222.68 63.60
truck 13.76 37.36 198.12 41.33
B
240 5. 8
passenger car 15.18 31.82 266.15 61.73
truck 13.65 37.60 210.57 45.03
3.2. Production Principle Of The Speed-Limit Sign
In order to avoid the mountain environment and weather condition influence to led the sign over or disrepair, the signs are designed as a three prism to disperse the identical direction wind, At the same time to consider the wind direction changes, the signs of the side need to hollow(the top of the three prism is closed, and the three sides have be with a plurality of small holes), In order to reduce the impact of the wind. Based on the GB23826-2009[17],the frame is a equilateral tri-prism as146*146*146m, thereinto, the LED display specifications is 92*100cm,and to be located in one side of the three prism, it can accommodate two numeric character as 24*24cm, and the numeric character is orange yellow, The outer ring are the red lights(
R
=
70
cm
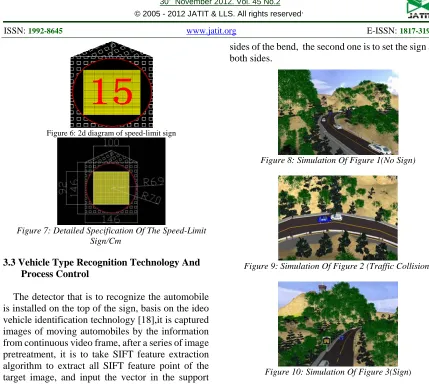
), the [image:6.612.87.525.411.509.2]bottom of the screen is Asia black. Using the graphics software of AutoCAD 2008,and protract the speed-limit sign by UG, as shown in Figure 5,6,7.
© 2005 - 2012 JATIT & LLS. All rights reserved.
ISSN: 1992-8645 www.jatit.org E-ISSN: 1817-3195
Figure 6: 2d diagram of speed-limit sign
Figure 7: Detailed Specification Of The Speed-Limit Sign/Cm
3.3 Vehicle Type Recognition Technology And Process Control
The detector that is to recognize the automobile is installed on the top of the sign, basis on the ideo vehicle identification technology [18],it is captured images of moving automobiles by the information from continuous video frame, after a series of image pretreatment, it is to take SIFT feature extraction algorithm to extract all SIFT feature point of the target image, and input the vector in the support vector machine that is gained the image, and be based on support vector machine model to be training and recognition. In some tips distance, if it is only one car through, the speed-limit sign will be indicated the speed-limit value of the car; when there are types of cars through the distance, by the car-following theory, the speed-limit sign will be indicated the minimum running speed of the types, so that it can ensure the driving safety from the distance that indicated to the point that entered the bend.
4 SYSTEMATIC SIMULATION OF
VEHICLE RUNNING ENVIRONMENT ON DOUBLE-LANE STEEP CURVED SECTIONS
4.1 Simulation Implementation Plan
Using the simulation software of Vissim5.30 to simulate the experiment, we select one bend section of the double-lane scenic spot as the simulation setting, and combining the actual conditions, to account to set the speed-limit sign at both sides if the bend and mark the speed-limit value on the sign. this problem will be discussed on two cases, The first case is not setting the speed-limit sign at both
sides of the bend, the second one is to set the sign at both sides.
Figure 8: Simulation Of Figure 1(No Sign)
[image:7.612.87.516.53.438.2]Figure 9: Simulation Of Figure 2 (Traffic Collision)
Figure 10: Simulation Of Figure 3(Sign)
4.2 Evaluate the Simulation Results
When it is no speed-limit sign,(as in Figure 8), because the speed is too quick and the visual field is blocked in running process, it is easier to deviate from the original lane off the pavement and come into collision with the car in another lane(as in Figure 9); in the time that the speed-limit Sign is setting (as in Figure 10), the car is driving at safety speed under the action of the speed-limit sign, and can ensure the visual field is not blocked, so it has never deviate from the original Lane, thereby it can enhance the security when the car drives at steep curved sections.
5 INNOVATIVE CHARACTERISTICS AND
APPLICATION PROSPECT
5.1 Innovative Characteristics
In this paper, the comprehensive effect evaluation model of the driving safety behavior in double-lane steep curved sections is established, and the evaluation indicator and standard are quantitative. it establishes the perfect setting system of the speed-limit sign(display mode、laying
© 2005 - 2012 JATIT & LLS. All rights reserved.
ISSN: 1992-8645 www.jatit.org E-ISSN: 1817-3195
control effect is remarkable. The operation simulation system is Integrated to create, and the research production and the implementation of operation effect of control measures are achievement.
5.2application Prospect
On the basis of the theoretical analysis, a typical application is in progress, which is combined with the actual situation of the section in Jinhua: the setting of the speed-limit sign at the bend of the double dragon cave scenic area in Jinhua. It provides the design index and the evaluation method of the road alignment safety and the driver’s driving comfort for the traffic management and the decision makers. And it establishes the perfect setting system of the speed-limit sign. so it can compute and set the sign by alignment and road grade, it will make a contribution to decrease the traffic accident of the double-lane steep curved sections.
ACKNOWLEDGEMENTS
This work is supported by Scientific Research Project of Transportation Hall of Zhejiang Province (2012H03). The first author would like to thanks other partners’ recommendation, for the valuable discussions in improving the quality and presentation of the paper.
REFERENCES:
[1] Joshua D. Clappa, “The Driving Behavior Survey: Scale construction and validation”, Journal of Anxiety Disorders, 2011.
[2] Lixin wu. “Relation between the driving behavior and the road alignment in traffic accident”, Journal of Jilin Architecture and Civil Engineering Institute, 2005.
[3] George Yannis, “Accident risk of foreign drivers in various road environments”, Journal of Safety Research, 2007.
[4] P. Wittenberg, “Determining, quantitative road safety targets by applying statistical prediction techniques and a multi-stage adjustment procedure”, Accident Analysis and Prevention, 2012.
[5] Jiangang Qiao, “Study on key parameters of two-lane highway in mountainous area based on driver's factor”, Beijing University of Technology, 2006.3.
[6] Yongjun Shen, “A generalized multiple layer data, envelopment analysis model for hierarchical structure assessment: A case study
in road safety performance evaluation”, Expert Systems with Applications, 2011.
[7] Leish J.E and Leish J.P., “New concepts in design speed application”, transportation research record 631, TRB, Washington, D.C. 1997.
[8] Chris Lee, “Evaluation of variable speed limits to improve traffic safety”, Transportation Research Part C, 2006.
[9] Pal Ulleberg, “Personality subtypes of young drivers. relationship to risk-taking preferences, accident involvement, and response to a traffic safety campaign”, Transportation research part F, 2002.
[10] David G. KleinbaumTH, HTLawrence L. KupperTH, Keith E. Muller (Author), Azhar Nizam, “Applied Regression Analysis and Multivariable Methods”, USA Thomson, 2000. [11] Shifeng Niu, “Traffic security features research
on the curve road in highway”, Master degree thesis of Jilin University, 2008.
[12]Specification on highway route design(JTGD20-2006), Beijing: China Communications Press, 2006.
[13] Xiaodong Pan. “The application of safety evaluation on the human body information technology in road geometry structure”, Master degree thesis of Tongji University, 2002. [14] Highway Research Institute of the Ministry of
Communications, “Study on Mountainous two-lane highway route design parameters”, Beijing: 2007.
[15] Shaowei Yang. “Road survey and design”. Beijing: People's Communications Press, 2008. [16] Approach of road traffic accidents, Chapter VI
Damages. State Council Decree 1992.
[17] Highway LED variable speed limit signs(GB 23826-2009), Beijing: People's Communications Press, 2009.