Proceedings of the 56th Annual Meeting of the Association for Computational Linguistics (Long Papers), pages 664–674 664
Unsupervised Abstractive Meeting Summarization with Multi-Sentence
Compression and Budgeted Submodular Maximization
Guokan Shang1,2, Wensi Ding1∗, Zekun Zhang1∗, Antoine J.-P. Tixier1, Polykarpos Meladianos1,3, Michalis Vazirgiannis1,3, Jean-Pierre Lorr´e2
1Ecole Polytechnique,´ 2Linagora,3AUEB
Abstract
We introduce a novel graph-based frame-work for abstractive meeting speech sum-marization that is fully unsupervised and does not rely on any annotations. Our work combines the strengths of multiple recent approaches while addressing their weaknesses. Moreover, we leverage recent advances in word embeddings and graph degeneracy applied to NLP to take exterior semantic knowledge into account, and to design custom diversity and informative-ness measures. Experiments on the AMI and ICSI corpus show that our system im-proves on the state-of-the-art. Code and data are publicly available1, and our sys-tem can be interactively tested2.
1 Introduction
People spend a lot of their time in meetings. The ubiquity of web-based meeting tools and the rapid improvement and adoption of Automatic Speech Recognition (ASR) is creating pressing needs for effective meeting speech summarization mecha-nisms.
Spontaneous multi-party meeting speech tran-scriptions widely differ from traditional docu-ments. Instead of grammatical, well-segmented
sentences, the input is made of often ill-formed and ungrammatical text fragments called utter-ances. On top of that, ASR transcription and seg-mentation errors inject additional noise into the in-put.
In this paper, we combine the strengths of 6 approaches that had previously been applied
∗
Work done as part of 3rdyear project, with equal
con-tribution. 1
https://bitbucket.org/dascim/acl2018_abssumm 2
http://datascience.open- paas.org/abs_summ_app
to 3 different tasks (keyword extraction, multi-sentence compression, and summarization) into a unified, fully unsupervised end-to-end meeting speech summarization framework that can gener-ate readable summaries despite the noise inherent to ASR transcriptions. We also introduce some novel components. Our method reaches state-of-the-art performance and can be applied to lan-guages other than English in an almost out-of-the-box fashion.
2 Framework Overview
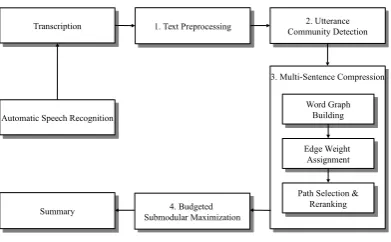
As illustrated in Figure1, our system is made of 4 modules, briefly described in what follows.
1. Text Preprocessing
1. Text Preprocessing 2. Utterance Community Detection
2. Utterance Community Detection
3. Multi-Sentence Compression
3. Multi-Sentence Compression
Word Graph Building
Word Graph Building
Transcription
Transcription
Path Selection & Reranking
Path Selection & Reranking
Edge Weight Assignment
Edge Weight Assignment
4. Budgeted Submodular Maximization
4. Budgeted Submodular Maximization
Summary
Summary
Automatic Speech Recognition
[image:1.595.319.515.427.548.2]Automatic Speech Recognition
Figure 1: Overarching system pipeline.
Note that our approach is fully unsupervised and does not rely on any annotations. Our in-put simply consists in a list of utterances without any metadata. All we need in addition to that is a part-of-speech tagger, a language model, a set of pre-trained word vectors, a list of stopwords and fillerwords, and optionally, access to a lexical database such as WordNet. Our system can work out-of-the-box in most languages for which such resources are available.
3 Related Work and Contributions
As detailed below, our framework combines the strengths of 6 recent works. It also includes novel components.
3.1 Multi-Sentence Compression Graph (MSCG) (Filippova,2010)
Description: a fully unsupervised, simple ap-proach for generating a short, self-sufficient tence from a cluster of related, overlapping sen-tences. As shown in Figure5, a word graph is con-structed with special edge weights, theK-shortest weighted paths are then found and re-ranked with a scoring function, and the best path is used as the compression. The assumption is that redun-dancy alone is enough to ensure informativeness and grammaticality.
Limitations: despite making great strides and showing promising results, Filippova (2010) re-ported that 48% and 36% of the generated sen-tences were missing important information and were not perfectly grammatical.
Contributions: to respectively improve informa-tiveness and grammaticality, we combine ideas found in Boudin and Morin (2013) and Mehdad et al. (2013), as described next.
3.2 More informative MSCG (Boudin and
Morin,2013)
Description: same task and approach as in Filip-pova (2010), except that a word co-occurrence net-work is built from the cluster of sentences, and that the PageRank scores of the nodes are computed in the manner of Mihalcea and Tarau (2004). The scores are then injected into the path re-ranking function to favor informative paths.
Limitations: PageRank is not state-of-the-art in capturing the importance of words in a document. Grammaticality is not considered.
Contributions: we take grammaticality into
ac-count as explained in subsection 3.4. We also follow recent evidence (Tixier et al., 2016a) that spreading influence, as captured by graph degeneracy-based measures, is better correlated with “keywordedness” than PageRank scores, as explained in the next subsection.
3.3 Graph-based word importance scoring (Tixier et al.,2016a)
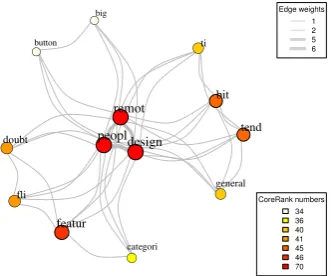
Word co-occurrence network. As shown in Fig-ure2, we consider a word co-occurrence network as an undirected, weighted graph constructed by sliding a fixed-size window over text, and where edge weights represent co-occurrence counts ( Tix-ier et al.,2016b;Mihalcea and Tarau,2004).
●
●
●
●
●
● ●
categori
tend
doubt
bit
big
peopl remot
design
general
fli
featur
button ti
CoreRank numbers 34 36 40 41 45 46 70 Edge weights
[image:2.595.334.501.283.421.2]1 2 5 6
Figure 2: Word co-occurrence graph example, for the input
text shown in Figure5.
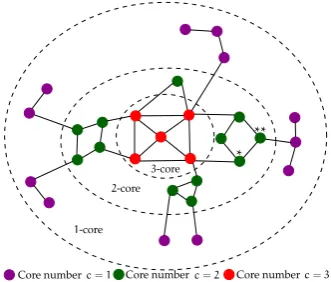
Important words are influential nodes. In social networks, it was shown thatinfluential spreaders, that is, those individuals that can reach the largest part of the network in a given number of steps, are better identified via their core numbers rather than via their PageRank scores or degrees (Kitsak et al.,2010). See Figure3for the intuition. Sim-ilarly, in NLP, Tixier et al. (2016a) have shown that keywords are better identified via their core numbers rather than via their TextRank scores, that is, keywords areinfluencerswithin their word co-occurrence network.
Graph degeneracy (Seidman, 1983). Let
G(V, E) be an undirected, weighted graph with
excludes noise. This property is highly valuable when dealing with graphs constructed from noisy text, like utterances. The core number of a node is the highest order of a core that contains this node.
Figure 3: k-core decomposition. The blue and the
yel-low nodes have same degree and similar PageRank numbers. However, the blue node is a much more influential spreader as it is strategically placed in the core of the network, as cap-tured by its higher core number.
The CoreRank number of a node (Tixier et al., 2016a;Bae and Kim,2014) is defined as the sum of the core numbers of its neighbors. As shown in Figure 4, CoreRank more finely captures the structural position of each node in the graph than raw core numbers. Also, stabilizing scores across node neighborhoods enhances the inherent noise robustness property of graph degeneracy, which is desirable when working with noisy speech-to-text output.
3-core
2-core
1-core
Core numberc=1 Core numberc=2 Core numberc=3 *
**
Figure 4: Value added by CoreRank: while nodes?and??
have the same core number (=2), node?has a greater
Cor-eRank score (3+2+2=7 vs 2+2+1=5), which better reflects its more central position in the graph.
Time complexity. Building a graph-of-words is O(nW), and computing the weighted k-core decomposition of a graph requires O(mlog(n)) (Batagelj and Zaverˇsnik,2002). For small pieces of text, this two step process is so affordable that it can be used in real-time (Meladianos et al.,2017). Finally, computing CoreRank scores can be done with only a small overhead ofO(n), provided that
the graph is stored as a hash of adjacency lists. Getting the CoreRank numbers from scratch for a community of utterances is therefore very fast, especially since typically in this context, n ∼ 10 andm∼100.
3.4 Fluency-aware, more abstractive MSCG (Mehdad et al.,2013)
Description: a supervised end-to-end framework for abstractive meeting summarization. Commu-nity Detection is performed by (1) building an ut-terance graph with a logistic regression classifier, and (2) applying the CONGA algorithm. Then, before performing sentence compression with the MSCG, the authors also (3) build an entailment graph with a SVM classifier in order to eliminate redundant and less informative utterances. In ad-dition, the authors propose the use of WordNet (Miller, 1995) during the MSCG building phase to capture lexical knowledge between words and thus generate more abstractive compressions, and of a language model when re-ranking the shortest paths, to favor fluent compressions.
Limitations: this effort was a significant advance, as it was the first application of the MSCG to the meeting summarization task, to the best of our knowledge. However, steps (1) and (3) above are complex, based on handcrafted features, and respectively require annotated training data in the form of links between human-written abstractive sentences and original utterances and multiple external datasets (e.g., from the Recognizing Textual Entailment Challenge). Such annotations are costly to obtain and very seldom available in practice.
Contributions: while we retain the use of WordNet and of a language model, we show that, without deteriorating the quality of the results, steps (1) and (2) above (Community Detection) can be performed in a much more simple, completely un-supervised way, and that step (3) can be removed. That is, the MSCG is powerful enough to remove redundancy and ensure informativeness, should proper edge weights and path re-ranking function be used.
In addition to the aforementioned contributions, we also introduce the following novel components into our abstractive summarization pipeline:
[image:3.595.98.264.454.595.2]distance in the word embedding space,
•we add a diversity term to the path re-ranking function, that measures how many unique clusters in the embedding space are visited by each path,
•rather than using all the abstractive sentences as the final summary like in Mehdad et al. (2013), we maximize a custom submodular function to se-lect a subset of abstractive sentences that is near-optimal given a budget constraint (summary size). A brief background of submodularity in the con-text of summarization is provided next.
3.5 Submodularity for summarization (Lin and Bilmes,2010;Lin,2012)
Selecting an optimal subset of abstractive sen-tences from a larger set can be framed as a bud-geted submodular maximization task:
argmax
S⊆S
f(S)|X s∈S
cs≤ B (1)
whereSis a summary,csis the cost (word count)
of sentence s, B is the desired summary size in words (budget), andf is a summary quality scor-ing set function, which assigns a sscor-ingle numeric score to a summaryS.
This combinatorial optimization task is NP-hard. However, near-optimal performance can be guaranteed with a modified greedy algorithm (Lin and Bilmes,2010) that iteratively selects the sen-tencesthat maximizes the ratio of quality function gain to scaled costf(S∪s)−f(S)/cr
s (where S is the
current summary andr ≥0is a scaling factor). In order for the performance guarantees to hold however, f has to be submodular and monotone non-decreasing. Our proposed f is described in subsection4.4.
4 Our Framework
We detail next each of the four modules in our ar-chitecture (shown in Figure1).
4.1 Text preprocessing
We adopt preprocessing steps tailored to the char-acteristics of ASR transcriptions. Consecutive re-peated unigrams and bigrams are reduced to single terms. Specific ASR tags, such as{vocalsound}, {pause}, and{gap}are filtered out. In addition, filler words, such asuh-huh,okay,well, andby the wayare also discarded. Consecutive stopwords at the beginning and end of utterances are stripped.
In the end, utterances that contain less than 3 non-stopwords are pruned out. The surviving utter-ances are used for the next steps.
4.2 Utterance community detection
The goal here is to cluster utterances into commu-nities that should be summarized by a common ab-stractive sentence.
We initially experimented with techniques cap-italizing on word vectors, such ask-means and hi-erarchical clustering based on the Euclidean dis-tance or the Word Mover’s Disdis-tance (Kusner et al., 2015). We also tried graph-based approaches, such as community detection in a complete graph where nodes are utterances and edges are weighted based on the aforementioned distances.
Best results were obtained, however, with a sim-ple approach in which utterances are projected into the vector space and assigned standard TF-IDF weights. Then, the dimensionality of the utterance-term matrix is reduced with Latent Se-mantic Analysis (LSA), and finally, the k-means algorithm is applied. Note that LSA is only used here, during the utterance community detection phase, to remove noise and stabilize clustering. We do not use a topic graph in our approach.
We think using word embeddings was not ef-fective, because in meeting speech, as opposed to traditional documents, participants tend to use the same term to refer to the same thing throughout the entire conversation, as noted by Riedhammer et al. (2010), and as verified in practice. This is probably why, for clustering utterances, capturing synonymy is counterproductive, as it artificially reduces the distance between every pair of utter-ances and blurs the picture.
4.3 Multi-Sentence Compression
The following steps are performed separately for each community.
Word importance scoring
From a processed version of the community (stem-ming and stopword removal), we construct an undirected, weighted word co-occurrence network as described in subsection 3.3. We use a sliding window of size W = 6 not overspanning utter-ances. Note that stemming is performed only here, and for the sole purpose of building the word co-occurrence network.
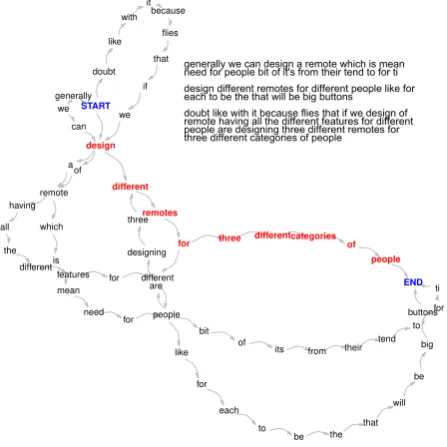
Figure 5: Compressed sentence (in bold red) generated by our multi-sentence com-pression graph (MSCG) for a 3-utterance community from meeting IS1009b of the
AMI corpus. Using Filippova (2010)’s
weighting and re-ranking scheme here
would have selected another path: design
different remotes for different people bit of it’s from their tend to for ti. Note that the compressed sentence does not appear in the initial set of utterances, and is compact and grammatical, despite the redundancy, tran-scription and segmentation errors of the
in-put. Theabstractiveandrobustnature of
the MSCG makes it particularly well-suited to the meeting domain.
buttons for
is a
different
big from
like
for three we
be
people
doubt
to ti if
their are
it
different which
for
of
we
people having
that
design
each remote
will
for different
that because
of designing
all
the
remotes
bit mean
can generally
to
tend
three
for
its
categories
different
START
the
be need
with
of
features
like flies
END
generally we can design a remote which is mean need for people bit of it's from their tend to for ti design different remotes for different people like for each to be the that will be big buttons doubt like with it because flies that if we design of remote having all the different features for different people are designing three different remotes for three different categories of people
We finally reweigh the CoreRank scores, in-dicative of word importance within a given com-munity, with a quantity akin to an Inverse Docu-ment Frequency, where communities serve as doc-uments and the full meeting as the collection. We thus obtain something equivalent to the TW-IDF weighting scheme of Rousseau and Vazirgiannis (2013), where the CoreRank scores are the term weights TW:
T W-IDF(t, d, D) =T W(t, d)×IDF(t, D) (2) where t is a term belonging to community d, andDis the set of all utterance communities. We compute the IDF asIDF(t, D) = 1 + log|D|/Dt,
where|D|is the number of communities and Dt
the number of communities containingt.
The intuition behind this reweighing scheme is that a term should be considered important within a given meeting if it has a high CoreRank score within its communityandif the number of com-munities in which the term appears is relatively small.
Word graph building
The backbone of the graph is laid out as a directed sequence of nodes corresponding to the words in the first utterance, with special START and
END nodes at the beginning and at the end (see Figure5). Edge direction follows the natural flow of text. Words from the remaining utterances are then iteratively added to the graph (between the
START and END nodes) based on the following
rules:
1) if the word is a non-stopword, the word is mapped onto an existing node if it has the same lowercased form and the same part-of-speech tag3. In case of multiple matches, we check the imme-diate context (the preceding and following words in the utterance and the neighboring nodes in the graph), and we pick the node with the largest con-text overlap or which has the greatest number of words already mapped to it (when no overlap). When there is no match, we use WordNet as de-scribed in Appendix A.
2) if the word is a stopword and there is a match, it is mapped only if there is an overlap of at least one non-stopword in the immediate context. Otherwise, a new node is created.
Finally, note that any two words appearing within the same utterance cannot be mapped to the same node. This ensures that every utterance is a loop-less path in the graph. Of course, there are many more paths in the graphs than original utterances.
Edge Weight Assignment
Once the word graph is constructed, we assign weights to its edges as:
w000(pi, pj) =
w0(pi, pj)
w00(p
i, pj)
(3)
wherepi andpj are two neighbors in the MSCG.
As detailed next, those weights combinelocal co-occurrence statistics(numerator) withglobal exte-rior knowledge(denominator). Note that the lower
3
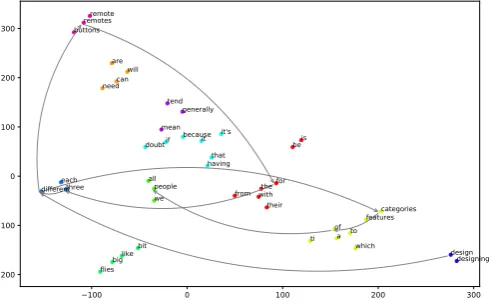
Figure 6: t-SNE visualization (Maaten and
Hin-ton, 2008) of the Google News vectors of the
words in the utterance community shown in
Fig-ure5. Arrows join the words in the best
com-pression path shown in Figure5. Movements in
the embedding space, as measured by the num-ber of unique clusters covered by the path (here,
6/11), provide a sense of the diversity of the
compressed sentence, as formalized in Equation
10.
100 0 100 200 300
200 100 0 100 200 300
different people for
design of to
three
be that
remotesremote
like
we the
flies
because
features is
it are
need
if
from it's generally tend buttons
their doubt
which ti all
big bit designing
with
categories
a will
can
each
having mean
the weight of an edge, the better.
Local co-occurrence statistics. We use Filippova (2010)’s formula:
w0(pi, pj) =
f(pi) +f(pj) P
P∈G0,p
i,pj∈Pdiff(P, pi, pj)
−1
(4) where f(pi) is the number of words mapped to
nodepi in the MSCGG0, anddiff(P, pi, pj)−1 is
the inverse of the distance betweenpi andpj in a
pathP (in number of hops). This weighting func-tion favors edges between infrequent words that frequently appear close to each other in the text (the lower, the better).
Global exterior knowledge.
We introduce a second term based on theWord At-traction Force scoreof Wang et al. (2014):
w00(pi, pj) =
f(pi)×f(pj)
d2
pi,pj
(5)
wheredpi,pj is the Euclidean distance between the
words mapped topi andpj in a word embedding
space4. This component favor paths going through salient words that have high semantic similarity
(the higher, the better). The goal is to ensure read-ability of the compression, by avoiding to generate a sentence jumping from one word to a completely unrelated one.
Path re-ranking
As in Boudin and Morin (2013), we use a short-est weighted path algorithm to find the K paths between theSTARTandEND symbols having the lowest cumulative edge weight:
W(P) =
|P|−1
X
i=1
w000(pi, pi+1) (6)
4
GoogleNews vectorshttps://code.google.com/archive/p/word2vec
Where |P| is the number of nodes in the path. Paths having less thanzwords or that do not con-tain a verb are filtered out (zis a tuning parame-ter). However, unlike in Boudin and Morin (2013), we rerank the K best paths with the following novel weighting scheme (the lower, the better), and the path with the lowest score is used as the compression:
score(P) = W(P)
|P| ×F(P)×C(P)×D(P) (7)
The denominator takes into account the length of the path, and its fluency (F), coverage (C), and diversity (D). F, C, andDare detailed in what follows.
Fluency. We estimate the grammaticality of a path with ann-gram language model. In our ex-periments, we used a trigram model5:
F(P) =
P|P|
i=1logP r(pi|pii−−1n+1)
#n-gram (8)
where |P| denote path length, and pi and
#n-gramare respectively the words and number ofn-grams in the path.
Coverage. We reward the paths that visit impor-tant nouns, verbs and adjectives:
C(P) =
P
pi∈PTW-IDF(pi)
#pi
(9)
where#piis the number of nouns, verbs and
ad-jectives in the path. The TW-IDF scores are com-puted as explained in subsection4.3.
Diversity. We cluster all words from the MSCG in the word embedding space by applying the k -means algorithm. We then measure the diversity of the vocabulary contained in a path as the number
5
of unique clusters visited by the path, normalized by the length of the path:
D(P) =
Pk
j=11∃pi∈P|pi∈clusterj
|P| (10)
The graphical intuition for this measure is pro-vided in Figure6. Note that we do not normalize
D by the total number of clusters (only by path length) becausekis fixed for all candidate paths.
4.4 Budgeted submodular maximization
We apply the previous steps separately for all ut-terance communities, which results in a set S of abstractive sentences (one for each community). This set of sentences can already be considered to be a summary of the meeting. However, it might exceed the maximum size allowed, and still con-tain some redundancy or off-topic sections unre-lated to the general theme of the meeting (e.g., chit-chat).
Therefore, we design the followingsubmodular
andmonotone non-decreasingobjective function:
f(S) = X
si∈S
nsiwsi+λ k X
j=1
1∃si∈S|si∈groupj
(11) whereλ≥0is the trade-off parameter,nsi is the
number of occurrences of wordsiinS, andwsiis
the CoreRank score ofsi.
Then, as explained in subsection 3.5, we ob-tain a near-optimal subset of abstractive sentences by maximizing f with a greedy algorithm. Cor-eRank scores and clusters are found as previ-ously described, except that this time they are ob-tained from the full processed meeting transcrip-tion rather than from a single utterance commu-nity.
5 Experimental setup
5.1 Datasets
We conducted experiments on the widely-used AMI (McCowan et al., 2005) and ICSI (Janin et al.,2003) benchmark datasets. We used the tra-ditional test sets of 20 and 6 meetings respectively for the AMI and ICSI corpora (Riedhammer et al., 2008). Each meeting in the AMI test set is asso-ciated with a human abstractive summary of 290 words on average, whereas each meeting in the ICSI test set is associated with 3 human abstrac-tive summaries of respecabstrac-tive average sizes 220,
220 and 670 words. For parameter tuning, we con-structed development sets of 47 and 25 meetings, respectively for AMI and ICSI, by randomly sam-pling from the training sets. The word error rate of the ASR transcriptions is respectively of 36% and 37% for AMI and ICSI.
5.2 Baselines
We compared our system against 7 baselines, which are listed below and more thoroughly de-tailed in Appendix B. Note that preprocessing was exactly the same for our system and all baselines.
• Random andLongest Greedy are basic base-lines recommended by (Riedhammer et al.,2008),
•TextRank(Mihalcea and Tarau,2004),
•ClusterRank(Garg et al.,2009),
• CoreRank & PageRank submodular(Tixier et al.,2017),
•Oracleis the same as the random baseline, but uses the human extractive summaries as input.
In addition to the baselines above, we included in our comparison 3 variants of our system using different MSCGs: Our System (Baseline) uses the original MSCG of Filippova (2010),Our Sys-tem (KeyRank) uses that of Boudin and Morin (2013), and Our System (FluCovRank) that of Mehdad et al. (2013). Details about each approach were given in Section3.
5.3 Parameter tuning
For Our Systemand each of its variants, we con-ducted a grid search on the development sets of each corpus, for fixed summary sizes of 350 and 450 words (AMI and ICSI). We searched the fol-lowing parameters:
• n: number of utterance communities (see Sec-tion 4.2). We tested values ofnranging from 20 to 60, with steps of 5. This parameter controls how much abstractive should the summary be. If all ut-terances are assigned to their own singleton com-munity, the MSCG is of no utility, and our frame-work is extractive. It becomes more and more ab-stractive as the number of communities decreases.
•z: minimum path length (see Section4.3). We searched values in the range[6,16]with steps of 2. If a path is shorter than a certain minimum number of words, it often corresponds to an invalid sen-tence, and should thereby be filtered out.
The scaling factor makes sure the quality function gain and utterance cost are comparable.
The best parameter values for each corpus are summarized in Table1. λis mostly non-zero, in-dicating that it is necessary to include a regular-ization term in the submodular function. In some cases though,r is equal to zero, which means that utterance costs are not involved in the greedy de-cision heuristic. These observations contradict the conclusion of Lin (2012) that r = 0 cannot give best results.
System AMI ICSI
Our System 50, 8, (0.7, 0.5) 40, 14, (0.0, 0.0) Our System (Baseline) 50, 12, (0.3, 0.5) 45, 14, (0.1, 0.0) Our System (KeyRank) 50, 10, (0.2, 0.9) 45, 12, (0.3, 0.4) Our System (FluCovRank) 35, 6, (0.4, 1.0) 50, 10, (0.2, 0.3)
Table 1: Optimal parameter valuesn, z,(λ, r).
Apart from the tuning parameters, we set the number of LSA dimensions to 30 and 60 (resp. on AMI and ISCI). The small number of LSA di-mensions retained can be explained by the fact that the AMI and ICSI transcriptions feature 532 and 1126 unique words on average, which is much smaller than traditional documents. This is due to relatively small meeting duration, and to the fact that participants tend to stick to the same terms throughout the entire conversation. For the k -means algorithm,kwas set equal to the minimum path lengthzwhen doing MSCG path re-ranking (see Equation10), and to 60 when generating the final summary (see Equation11).
Following Boudin and Morin (2013), the num-ber of shortest weighted pathsK was set to 200, which is greater than the K = 100used by Fil-ippova (2010). IncreasingK from 100 improves performance with diminishing returns, but sig-nificantly increases complexity. We empirically found 200 to be a good trade-off.
6 Results and Interpretation
Metrics. We evaluated performance with the widely-used 1, 2 and ROUGE-SU4 metrics (Lin, 2004). These metrics are re-spectively based on unigram, bigram, and unigram plus skip-bigram overlap with maximum skip dis-tance of 4, and have been shown to be highly correlated with human evaluations (Lin, 2004). ROUGE-2 scores can be seen as a measure of sum-mary readability (Lin and Hovy, 2003; Ganesan et al.,2010). ROUGE-SU4 does not require
con-secutive matches but is still sensitive to word or-der.
Macro-averaged results for summaries gener-ated from automatic transcriptions can be seen in Figure 7 and Table2. Table2 provides detailed comparisons over the fixed budgets that we used for parameter tuning, while Figure 7 shows the performance of the models for budgets ranging from 150 to 500 words. The same information for summaries generated from manual transcriptions is available in Appendix C. Finally, summary ex-amples are available in Appendix D.
ROUGE-1. Our systems outperform all baselines on AMI (including Oracle) and all baselines on ICSI (exceptOracle). Specifically,Our Systemis best on ICSI, whileOur System (KeyRank)is su-perior on AMI. We can also observe on Figure7 that our systems are consistently better throughout the different summary sizes, even though their pa-rameters were tuned for specific sizes only. This shows that the best parameter values are quite ro-bust across the entire budget range.
ROUGE-2. Again, our systems (exceptOur Sys-tem (Baseline)) outperform all baselines, except
Oracle. In addition,Our System andOur System (FluCovRank) consistently improve on Our Sys-tem (Baseline), which proves that the novel com-ponents we introduce improve summary fluency.
ROUGE-SU4. ROUGE-SU4 was used to mea-sure the amount of in-order word pairs overlap-ping. Our systems are competitive with all base-lines, includingOracle. Like with ROUGE-1,Our System is better than Our System (KeyRank) on ICSI, whereas the opposite is true on AMI.
General remarks.
• The summaries of all systems except Oracle
were generated from noisy ASR transcriptions, but were compared against human abstractive sum-maries. ROUGE being based on word overlap, it makes it very difficult to reach very high scores, because many words in the ground truth sum-maries do not appear in the transcriptions at all.
•The scores of all systems are lower on ICSI than on AMI. This can be explained by the fact that on ICSI, the system summaries have to jointly match 3 human abstractive summaries of different con-tent and size, which is much more difficult than matching a single summary.
Or-150 200 250 300 350 400 450 500 summary size (words)
0.26
0.28
0.30
0.32
0.34
0.36
0.38
R
OUGE-1
F1-score
AMI
OUR SYSTEM OUR SYSTEM (BASELINE) OUR SYSTEM (KEYRANK) OUR SYSTEM (FLUCOVRANK) ORACLE
CORERANK SUBMODULAR PAGERANK SUBMODULAR TEXTRANK CLUSTERRANK LONGEST GREEDY RANDOM
150 200 250 300 350 400 450 500
summary size (words)
0.22
0.24
0.26
0.28
0.30
0.32
ICSI
OUR SYSTEM OUR SYSTEM (BASELINE) OUR SYSTEM (KEYRANK) OUR SYSTEM (FLUCOVRANK) ORACLE
[image:9.595.80.522.62.235.2]CORERANK SUBMODULAR PAGERANK SUBMODULAR TEXTRANK CLUSTERRANK LONGEST GREEDY RANDOM
Figure 7: ROUGE-1 F-1 scores for various budgets (ASR transcriptions).
AMI ROUGE-1 AMI ROUGE-2 AMI ROUGE-SU4 ICSI ROUGE-1 ICSI ROUGE-2 ICSI ROUGE-SU4 R P F-1 R P F-1 R P F-1 R P F-1 R P F-1 R P F-1 Our System 41.83 34.44 37.25 8.22 6.95 7.43 15.83 13.70 14.51 36.99 28.1231.60 5.41 4.39 4.79 13.10 10.1711.35
Our System (Baseline) 41.56 34.37 37.11 7.88 6.66 7.11 15.36 13.20 14.02 36.39 27.20 30.80 5.19 4.12 4.55 12.59 9.70 10.86 Our System (KeyRank) 42.43 35.0137.86 8.72 7.29 7.84 16.19 13.76 14.71 35.95 27.00 30.52 4.64 3.64 4.04 12.43 9.23 10.50 Our System (FluCovRank) 41.84 34.61 37.37 8.29 6.92 7.45 16.28 13.48 14.58 36.27 27.56 31.00 5.56 4.35 4.83 13.47 9.85 11.29 Oracle 40.49 34.6536.73 8.07 7.35 7.55 15.00 14.03 14.26 37.91 28.3932.12 5.73 4.82 5.18 13.35 10.7311.80
CoreRank Submodular 41.14 32.93 36.13 8.06 6.88 7.33 14.84 13.91 14.18 35.22 26.34 29.82 4.36 3.76 4.00 12.11 9.58 10.61 PageRank Submodular 40.84 33.08 36.10 8.27 6.88 7.42 15.37 13.71 14.32 36.05 26.69 30.40 4.82 4.16 4.42 12.19 10.39 11.14 TextRank 39.55 32.60 35.25 7.67 6.43 6.90 14.87 12.87 13.62 34.89 26.33 29.70 4.60 3.74 4.09 12.42 9.43 10.64 ClusterRank 39.36 32.53 35.14 7.14 6.05 6.46 14.34 12.80 13.35 32.63 24.44 27.64 4.03 3.44 3.68 11.04 8.88 9.77 Longest Greedy 37.31 30.93 33.35 5.77 4.71 5.11 13.79 11.11 12.15 35.57 26.74 30.23 4.84 3.88 4.27 13.09 9.46 10.90
Random 39.42 32.48 35.13 6.88 5.89 6.26 14.07 12.70 13.17 34.78 25.75 29.28 4.19 3.51 3.78 11.61 9.37 10.29
Table 2: Macro-averaged results for 350 and 450 word summaries (ASR transcriptions).
acledoes not reach very high ROUGE scores be-cause the overlap between the human extractive and abstractive summaries is low (19% and 29%, respectively on AMI and ICSI test sets).
7 Conclusion and Next Steps
Our framework combines the strengths of 6 ap-proaches that had previously been applied to 3 dif-ferent tasks (keyword extraction, multi-sentence compression, and summarization) into a uni-fied, fully unsupervised end-to-end summarization framework, and introduces some novel compo-nents. Rigorous evaluation on the AMI and ICSI corpora shows that we reach state-of-the-art per-formance, and generate reasonably grammatical abstractive summaries despite taking noisy utter-ances as input and not relying on any annotations or training data. Finally, thanks to its fully unsu-pervised nature, our method is applicable to other languages than English in an almost out-of-the-box manner.
Our framework was developed for the meeting domain. Indeed, our generative component, the
multi-sentence compression graph (MSCG), needs redundancy to perform well. Such redundancy is typically present in meeting speech but not in traditional documents. In addition, the MSCG is by design robust to noise, and our custom path re-ranking strategy, based on graph degeneracy, makes it even more robust to noise. As a result, our framework is advantaged on ASR input. Fi-nally, we use a language model to favor fluent paths, which is crucial when working with (meet-ing) speech but not that important when dealing with well-formed input.
Future efforts should be dedicated to improv-ing the community detection phase and generatimprov-ing more abstractive sentences, probably by harness-ing Deep Learnharness-ing. However, the lack of large training sets for the meeting domain is an obsta-cle to the use of neural approaches.
Acknowledgments
References
Joonhyun Bae and Sangwook Kim. 2014. Identify-ing and rankIdentify-ing influential spreaders in complex net-works by neighborhood coreness. Physica A: Statis-tical Mechanics and its Applications395:549–559.
Vladimir Batagelj and Matjaˇz Zaverˇsnik. 2002. Gener-alized cores.arXiv preprint cs/0202039.
Florian Boudin and Emmanuel Morin. 2013. Keyphrase extraction for n-best reranking in multi-sentence compression. InProceedings of the 2013 Conference of the North American Chapter of the Association for Computational Linguis-tics: Human Language Technologies. Association for Computational Linguistics, pages 298–305. http://aclweb.org/anthology/N13-1030.
Katja Filippova. 2010. Multi-sentence compres-sion: Finding shortest paths in word graphs. In Proceedings of the 23rd International Conference on Computational Linguistics (Coling 2010). Col-ing 2010 OrganizCol-ing Committee, pages 322–330. http://aclweb.org/anthology/C10-1037.
Kavita Ganesan, ChengXiang Zhai, and Jiawei Han. 2010.Opinosis: A graph based approach to abstrac-tive summarization of highly redundant opinions. In Proceedings of the 23rd International Conference on Computational Linguistics (Coling 2010). Col-ing 2010 OrganizCol-ing Committee, pages 340–348. http://aclweb.org/anthology/C10-1039.
Nikhil Garg, Benoit Favre, Korbinian Reidhammer, and Dilek Hakkani-T¨ur. 2009. Clusterrank: a graph based method for meeting summarization. In Tenth Annual Conference of the International Speech Communication Association.
A. Janin, D. Baron, J. Edwards, D. Ellis, D. Gelbart, N. Morgan, B. Peskin, T. Pfau, E. Shriberg, A. Stolcke, and C. Wooters. 2003. The icsi meeting corpus. In Acoustics, Speech, and Signal Processing, 2003. Proceedings. (ICASSP ’03). 2003 IEEE International Con-ference on. volume 1, pages I–364–I–367 vol.1. https://doi.org/10.1109/ICASSP.2003.1198793.
Maksim Kitsak, Lazaros K Gallos, Shlomo Havlin, Fredrik Liljeros, Lev Muchnik, H Eu-gene Stanley, and Hern´an A Makse. 2010. Identification of influential spreaders in com-plex networks. Nature Physics 6(11):888–893. https://doi.org/10.1038/nphys1746.
Matt J. Kusner, Yu Sun, Nicholas I. Kolkin, and Kil-ian Q. Weinberger. 2015. From word embeddings to document distances. InProceedings of the 32Nd International Conference on International Confer-ence on Machine Learning - Volume 37. JMLR.org, ICML’15, pages 957–966.
Chin-Yew Lin. 2004. Rouge: A package for automatic evaluation of summaries. In Text Summarization Branches Out. http://aclweb.org/anthology/W04-1013.
Chin-Yew Lin and Eduard Hovy. 2003. Auto-matic evaluation of summaries using n-gram co-occurrence statistics. In Proceedings of the 2003 Human Language Technology Con-ference of the North American Chapter of the Association for Computational Linguistics. http://aclweb.org/anthology/N03-1020.
Hui Lin. 2012. Submodularity in natural language pro-cessing: algorithms and applications. University of Washington.
Hui Lin and Jeff Bilmes. 2010. Multi-document sum-marization via budgeted maximization of submod-ular functions. InHuman Language Technologies: The 2010 Annual Conference of the North American Chapter of the Association for Computational Lin-guistics. Association for Computational Linguistics, pages 912–920. http://aclweb.org/anthology/N10-1134.
Laurens van der Maaten and Geoffrey Hinton. 2008. Visualizing data using t-sne. Journal of machine learning research9(Nov):2579–2605.
Iain McCowan, Jean Carletta, W Kraaij, S Ashby, S Bourban, M Flynn, M Guillemot, T Hain, J Kadlec, V Karaiskos, et al. 2005. The ami meet-ing corpus. InProceedings of the 5th International Conference on Methods and Techniques in Behav-ioral Research. volume 88.
Yashar Mehdad, Giuseppe Carenini, Frank Tompa, and Raymond T. NG. 2013. Abstractive meet-ing summarization with entailment and fusion. In Proceedings of the 14th European Work-shop on Natural Language Generation. Associa-tion for ComputaAssocia-tional Linguistics, pages 136–146. http://aclweb.org/anthology/W13-2117.
Polykarpos Meladianos, Antoine Tixier, Ioannis Niko-lentzos, and Michalis Vazirgiannis. 2017. Real-time keyword extraction from conversations. In Proceedings of the 15th Conference of the Eu-ropean Chapter of the Association for Computa-tional Linguistics: Volume 2, Short Papers. Associa-tion for ComputaAssocia-tional Linguistics, pages 462–467. http://aclweb.org/anthology/E17-2074.
Rada Mihalcea and Paul Tarau. 2004. Tex-trank: Bringing order into text. In Pro-ceedings of the 2004 Conference on Empiri-cal Methods in Natural Language Processing. http://aclweb.org/anthology/W04-3252.
George A. Miller. 1995. Wordnet: A lexical database for english.Commun. ACM38(11):39–41. https://doi.org/10.1145/219717.219748.
Korbinian Riedhammer, Benoit Favre, and Dilek Hakkani-T¨ur. 2010. Long story short - global unsupervised models for keyphrase based meeting summarization. Speech Commun.52(10):801–815. https://doi.org/10.1016/j.specom.2010.06.002.
Korbinian Riedhammer, Dan Gillick, Benoit Favre, and Dilek Hakkani-T¨ur. 2008. Packing the meeting sum-marization knapsack. InNinth Annual Conference of the International Speech Communication Associ-ation.
Franc¸ois Rousseau and Michalis Vazirgiannis. 2013. Graph-of-word and tw-idf: New approach to ad hoc ir. InProceedings of the 22Nd ACM International Conference on Information & Knowledge Manage-ment. ACM, New York, NY, USA, CIKM ’13, pages 59–68. https://doi.org/10.1145/2505515.2505671.
Stephen B Seidman. 1983. Network structure and minimum degree. Social networks 5(3):269–287. https://doi.org/10.1016/0378-8733(83)90028-X.
Antoine Tixier, Fragkiskos Malliaros, and Michalis Vazirgiannis. 2016a. A graph degeneracy-based approach to keyword extraction. In Proceed-ings of the 2016 Conference on Empirical Meth-ods in Natural Language Processing. Association for Computational Linguistics, pages 1860–1870. https://doi.org/10.18653/v1/D16-1191.
Antoine Tixier, Polykarpos Meladianos, and Michalis Vazirgiannis. 2017. Combining graph degener-acy and submodularity for unsupervised extrac-tive summarization. In Proceedings of the Work-shop on New Frontiers in Summarization. Associ-ation for ComputAssoci-ational Linguistics, pages 48–58. http://aclweb.org/anthology/W17-4507.
Antoine Tixier, Konstantinos Skianis, and Michalis Vazirgiannis. 2016b. Gowvis: A web ap-plication for graph-of-words-based text visual-ization and summarvisual-ization. In Proceedings of ACL-2016 System Demonstrations. Association for Computational Linguistics, pages 151–156. https://doi.org/10.18653/v1/P16-4026.