Available online on 15.03.2019 at http://jddtonline.info
Journal of Drug Delivery and Therapeutics
Open Access to Pharmaceutical and Medical Research
© 2011-18, publisher and licensee JDDT, This is an Open Access article which permits unrestricted non-commercial use, provided the original work is properly cited
Open Access
Research Article
Linagliptin loaded Solid-SMEEDS for enhanced solubility and dissolution:
Formulation development and optimization by D-optimal design
Dr. Madhubhai M Patel 1*, Rahulkumar J. Patel 2
1 Director and Professor, Shree Swaminarayan Sanskar Pharmacy College, Zundal, Near S.P. Ring Road, Gandhinagar-382421, Gujarat, India. 2 Shree Swaminarayan Sanskar Pharmacy College, Zundal, Near S.P. Ring Road, Gandhinagar-382421, Gujarat, India.
ABSTRACT
The aim of the present investigation was to formulate and evaluate solid self-micro emulsifying drug-delivery systems (S-SMEDDS) to improve solubility and dissolution profile of Linagliptin. Solubility of Linagliptin in different oils, surfactants and co-surfactants was assessed and optimizations of pseudo-ternary plots were also carried out for preparation of liquid SMEDDS. D-optimal design mixture was used in the optimization of Linagliptin loaded liquid SMEEDS. The optimized SMEEDS were characterized for globule size, zeta potential, dilution stability, transmittance, pH and in-vitro release profile. The morphology of the Linagliptin SMEEDS was observed by Transmission Electron Microscopy (TEM). Among the different silicates, Nusillin US2 was used as the solid carrier/absorbent to formulate S-SMEEDS of Linagliptin. Improved in-vitro dissolution profile of optimized formulation was observed, resulting in multifold improvement in the absorption profile of Linagliptin as compared with pure drug. In a nutshell, this optimized S-SMEDD formulation holds great promise for enhancement of its physiochemical and biological attributes.
Keywords: Linagliptin, Solid Self-micro Emulsifying Drug Delivery Systems, D-optimal design, Zeta-potential, Transmission Electron Microscopy
Article Info:Received 14 Jan 2019; Review Completed 24 Feb 2019; Accepted 25 Feb 2019; Available online 15 March 2019
Cite this article as:
Patel MM, Patel RJ, Linagliptin loaded Solid-SMEEDS for enhanced solubility and dissolution: Formulation development and optimization by D-optimal design, Journal of Drug Delivery and Therapeutics. 2019; 9(2):47-56
http://dx.doi.org/10.22270/jddt.v9i2.2465 *Address for Correspondence:
Dr. Madhubhai M Patel, Director and Professor, Shree Swaminarayan Sanskar Pharmacy College, Zundal, Near S.P. Ring Road, Gandhinagar-382421, Gujarat, India.
1. INTRODUCTION
Linagliptin, dipeptidyl peptidase-4 (DPP-4) inhibitor, widely used in the treatment of diabetes mellitus type 2. Though, low aqueous solubility and poor permeation profile of
Linagliptin results in the low bioavailability (~30%) [1, 2]. To
date, several formulation approaches such as Solid
Dispersions [3], polymeric nanofibers for transmucosal
delivery [4], and non-ionic surfactant vesicles [5] have been
investigated to overcome the low aqueous solubility and poor permeation profile and thereby improving the bioavailability of Linagliptin. In recent decades, Self-manoemulsifying drug-delivery systems (SMEDDS) have emerged as an effective drug delivery system due to their proven ability to enhance aqueous solubility, permeation
and bioavailability of lipophilic drugs [6]. SMEDDS can be
defined as the isotropic mixture of the drug, oil, surfactant, and co-surfactant that form a spontaneous oil-in-water (O/W) microemulsion when introduced into an aqueous
medium under gentle agitation [7]. Having potential
advantages such as thermodynamic stable, globule size around 100 nm, ability to present the drug in solubilized form into the gastrointestinal tract (GIT) offers grater
interfacial area for absorption of drug and also provides chemical and enzymatic stability, increased lymphatic transport along with inhibition of P-glycoprotein mediated drug efflux [8, 9].
Excipients used in SMEDDS and their concentrations have profound effect on the globule size of the microemulsion
which may ultimately affect its in-vitro and in-vivo
performance [10]. Though, such delivery systems often
developed and optimized by a trial-and-error tactic by varying one factor at a time and keeping all other factors constant. This univariate approach is time-consuming and requires a larger number of experiments to describe the effect of excipients (oil, surfactant and co-surfactant) on the physical properties of the SMEDDS and frequently fails to project the true optimal composition because interactions
between factors were not considered [11]. To understand the
multi-factorial relationship between formulation factors and product desirability generally requires the multivariate
approach, such as Design of Experiment (DOE) [12].
robust product with several advantages such as time, money and efforts, etc. [6].
In addition, it is worthy to develop solid SMEDDS dosage form due to its better stability, simple and cost-effective development, transportability and enhanced therapeutic
success due to improved patient compliance [13]. Therefore,
the present investigation was aimed to develop solid SMEDDS of Linagliptin and optimized by using D-optimal design mixture. The formation of a microemulsion may offer a large interfacial surface for better drug solubilization which may leads to an improved solubility and dissolution profile of Linagliptin.
2. MATERIALS AND METHODOLOGY
Linagliptin was obtained as the gift sample form Alembic Pharmaceuticals Ltd., Vadodara, Gujarat, India. Oleic acid, Corn oil, sunflower oil and castor oil were acquired from Triveni Interchem Pvt Ltd., India. Olive oil, cottonseed oil, linseed oil, and Propylene Glycol (PG) were purchased from S.D. Fine Chemicals, India. Acconon CC 6, Acconon C 80, Capmul MCM and Caprol MPGO were bought from Abitec Corporation, USA. Isopropyl Myristate was purchased from Haxon Laboratory Pvt. Ltd., India. Labrasol, Transcutol HP, Lauroglycol FCC and Lauroglycol 90 were obtained as gift sample from Gattefosse, India. Span 20, Tween 20, Tween 80, Poly Ethylene Glycol (PEG - 200, 400 and 600), Acetonitrile and Methanol (Analytical and HPLC Grades) were obtained from Spectrochem, India. Cremophor RH 40 was procured from BASF, India. All other chemicals used were of analytical grade (AR).
2.1 Screening of formulation excipients based on
saturation solubility study
Solubility of Linagliptin was analyzed in various excipients i.e. oils, surfactants and co-surfactants to evaluate the maximum drug loading efficacy. An excess amount of Linagliptin in each different excipient was added into the centrifuge tubes and subjected to mechanical shaking for 24
h at 50 strokes/min. Each tube was then centrifuged at 5000 rpm for 10 min to separate the excess insoluble drug (at
bottom) and the supernatant was isolated and filtered [14].
The concentration of Linagliptin in the filtrate was determined by UV spectrophotometry at λmax of 228 nm with suitable dilutions.
2.2 Constructions of Pseudo Ternary Phase Diagram
Water titration method was used to construct the ternary phase diagram between oils, water and Smix (mixture of surfactant and cosurfactant). The weight ratio of Smix was varied as 1:1, 2:1 and 3:1 and the oil was added to this Smix in 10:0, 9:1, 8:2, 7:3, 6:4, 5:5, 4:6, 3:7, 2:8, 1:9 ratio with continuous stirring. To this mixture, water was added as drop wise until the turbidity/haziness was observed. Among these, clear/dispersion with slight bluish tint were considered as the microemulsion region and the pseudo ternary phase diagram was plotted by using Chemix Software to select optimum Smix ratio.
2.3 Formulation Development and Optimization of
Linagliptin SMEDDS by using D-optimal Design D-optimal mixture design was used as a statistical tool to understand the relationship between formulation variables and response parameters. Respective levels of the independent variables were selected on the basis of preliminary optimization of the SMEDDS components. Table 1 enlists the independent variables and response parameters with their respective constraints. For the fabrication of Linagliptin loaded SMEDDS, 10 mg accurately weighed Linagliptin was dissolved in predetermined concentrations of Oil and Smix as suggested by the design. All the excipients were homogeneously mixed by vortexing to get uniform, transparent and clear SMEDDS. The physiochemical characterization of the optimized SMEDDS of Linagliptin were carried for critical quality attributes (CQAs).
Table-1: List of Independent variables and response parameters
Independent Variables Low Value High Value
Oil (%) (X1) 5 15
Surfactant (%) (X2) 55 65
Co-surfactant (%) (X3) 25 30
Responses Parameters Globule size (nm) (Y1) Transmittance (%) (Y2)
Globule size (Y1) and Zeta Potential
Globule size, PDI and Zeta potential of Linagliptin loaded SMEDDS were measured by ZetaSizer Nano ZS (Malvern Instruments, United Kingdom). In brief, 0.5 g of SMEDDS were emulsified in the 250 ml phosphate buffer (PBS) pH 6.8 and allowed to stabilize. Resulting microemulsions were filled in the clear disposable cuvettes and the globule size, PDI and zeta potential were measured and recorded (n=3).
2.3.1 % Transmittance (Y2)
% Transmittance of Linagliptin loaded SMEDDS was analyzed at λmax 650 nm by UV-visible spectrophotometry (UV1800, Shimadzu, Japan). In brief, 0.5 g of SMEDDS were emulsified in the 250 ml phosphate buffer (PBS) pH 6.8 and allowed to stabilize. Phosphate buffer pH 6.8 used as blank to determine the % transmittance.
2.3.2 Overlay plot and check point batch analysis
Design Expert 7.0.0 (Stat-Ease) software was used to understand the effect of independent variables on response parameters. 3D response surface plots and desirability plot were generated through software to understand the effect of each component i.e. oil, surfactant and co-surfactant on the response parameters i.e. globule size and % transmittance.
2.4 Screening of solid adsorbent and preparation of
Solid-SMEDDS
Micro Crystalline Cellulose (MCC 102), Aeroperl® 300,
Aerosil® 200, and Neusilin® US2 were selected and screened
based on the minimum quantity required to exhibit free flowing characteristics of the blend. Flow characteristics of the optimized S-SMEDDS of Linagliptin were measured i.e.
Angle of Repose, Hausner’s ratio and Carr’s index [15].
2.5 Physicochemical characterization of Linagliptin
loaded SMEDDS/Solid-SMEDDS
2.5.1Self-emulsification time
The time of self-emulsification of optimized Linagliptin loaded SMEDDS was evaluated using USP type II dissolution apparatus. 0.5 g of SMEDDS was emulsified 250 ml of phosphate buffer (pH 6.8) in 500ml vessels of dissolution apparatus and the temperature was maintained at 37 ± 1°C with paddle rotating at 50 rpm. Time required to obtain clear and transparent phase was considered as the self-emulsification time.
2.5.2 Thermodynamic Stability
The optimized SMEDDS of Linagliptin were subjected to thermodynamic stability testing i.e. heating cooling cycle, centrifugation test and freeze thaw cycle. SMEDDS was tested at 3 heating (40˚C) cooling (4˚C) cycles with 48 h storage at each temperature. The formulation was then assessed for centrifugation test at 4000 rpm for 30 min. Moreover, freeze thaw stress testing of the formulation was also carried out by freezing the SMEDDS at -20˚C and -70 ˚C and thawing at 25 ˚C with 48 h of storage at each temperature conditions. All the formulations were evaluated for phase separation, turbidity or any kind of instability.
2.5.3 Cloud point measurement
For the determination of cloud point of formulation, 0.5 g of SMEDDS was dispersed in 250ml of phosphate buffer pH 6.8 and allowed to stabilize. The dispersion was then subjected to heating under water bath with gradually increase in temperature. The temperature at which the turbidity was observed was considered as cloud point.
2.5.4 Transmission Electron Microscopy (TEM)
0.5 g of Solid SMEEDS of Linagliptin was emulsified in the 250 ml phosphate buffer pH 6.8 and allowed for stabilization for an hour. The resultant dispersion was then filtered
through nylon membrane filter (0.45 μ, Whatman®) in order
to separate adsorbent particles and subjected for TEM (JEM-1200, Joel, Japan) analysis. In brief, 5 μl of sample was placed on the copper grid (3mm, 300 mesh), excess of sample was removed through blotting paper. The grid was then air dried and observed with 100kv acceleration voltage under TEM.
2.5.5Assay
Drug content of Linagliptin was estimated in the developed formulation of SMEDDS. 0.5g accurately weighed SMEDDS was transferred to 50ml methanol to dissolve Linagliptin and
filtered through nylon membrane filter (0.22 μ, Whatman®).
The concentration of Linagliptin in the filtrate was determined by UV spectrophotometry at λmax of 228 nm with suitable dilutions. Estimation was performed in triplicate and results are expressed as mean ± SD.
2.5.6 In-vitro drug release study
In vitro drug release study of Linagliptin loaded
Solid-SMEDDS was performed by using dialysis bag technique [16,
17]. 0.5 g of Solid-SMEDDS were incorporated in the
pre-activated dialysis membrane (12kD molecular weight, Hi Media Laboratories Pvt. Ltd.) and both the ends were sealed with clamp and submerged in 250 ml phosphate buffer (pH 6.8) at 50 rpm having temperature of 37 ± 0.5 °C. At predetermined time intervals i.e. 0.5, 1, 2, 3, 4, 6, 8, 10 and 12 h, 5 ml sample was withdrawn and replenished with same
volume of fresh medium. The in-vitro release profile of
Linagliptin from the solid-SMEDDS was compared with the suspension of Linagliptin. The concentration of Linagliptin was determined by UV spectrophotometry at λmax of 228 nm with suitable dilutions. Estimation was performed in triplicate and results are expressed as mean ± SD. The drug release mechanism was studied by plotting various release kinetic models.
2.5.7 Stability study
Stability study of optimized solid-SMEDDS of Linagliptin was conducted for three months as per the ICH guidelines as described in the stability testing of new drug substances and
drug products [18]. This study was carried out at room
temperature and accelerated conditions i.e. at 45 ± 2°C (75 ± 5% RH) for 3 months and analyzed for drug content, globule size and physical appearance at time intervals of 0,15,30,60 and 90 days.
3. RESULTS AND DISCUSSION
3.1.1 Screening of formulation excipients based on
saturation solubility study
Oil is an important excipient in the formulation of SMEDDS, which increases the solubility and fraction of the lipophilic drugs transported via intestinal lymphatic system, therefore by increasing its absorption through gastro-intestinal tract
[19]. In addition, high solubility of a lipophilic drug in oil
phase is noteworthy assessment because it requires lesser amount of oil to form the microemulsion preconcentrates
[20]. Linagliptin exhibited highest solubility 65±4.1 mg/ml in
Capmul MCM among the various oils screened.
Similarly, surfactant also plays critical role by forming thin film at the interface and helps in decreasing the globule size and stabilization of emulsion and uses their absorption enhancing activity by partitioning into the cell membrane and disrupt the structural organization of lipid bilayers
results in increase in permeation of drugs [19]. Linagliptin
exhibited highest solubility in Labrasol 58±3.2 mg among the different surfactant screened.
Moreover, co-surfactant also helps by penetrating into the interface and form void spaces for the penetration of water and thereby increasing the interfacial fluidity which enables
the spontaneous formation of emulsion [21]. Linagliptin
Figure 1: Saturation solubility profile of Linagliptin
3.1.2Pseudo ternary phase diagram
Ternary phase diagram constructed of the blank SMEDDS to find the microemulsion region. weight ratio of Smix (Labrasol:Transcutol HP) was varied as 2:1, 3:1 and 3:2 and plotted (Figure 2) by using Chemix software as the batches of
1:1 and 1:2 Smix ratio were precipitated on dilution with water. Moreover, oil to Smix ratio (2:1) of 1:9 and 2:8 proportions in water titrations were showed clear and transparent solution up to infinite dilutions with water. Thus, Smix ratio of 2:1 was selected for further optimization.
Figure 2: Ternary phase diagram constructed of the blank SMEDDS
3.1.3Optimization of Linagliptin SMEDDS by using D-optimal Mixture Design
The Linagliptin loded SMEDDS was further optimized by D-optimal mixture design using Stat-Ease Deign Expert Software (7.0.0). This design was selected to study the quadratic effects, interactions and optimization of SMEDDS in order to achieve the optimum desirability. Based on the results of the preformulation studies, the low-high limits of each variables i.e. Oil, surfactant and co-surfactant (Table 1) were set in design of experiment and the response parameters were recorded (Table 2). Globule size and % transmittance were found in the range of 52.1±2.1 to
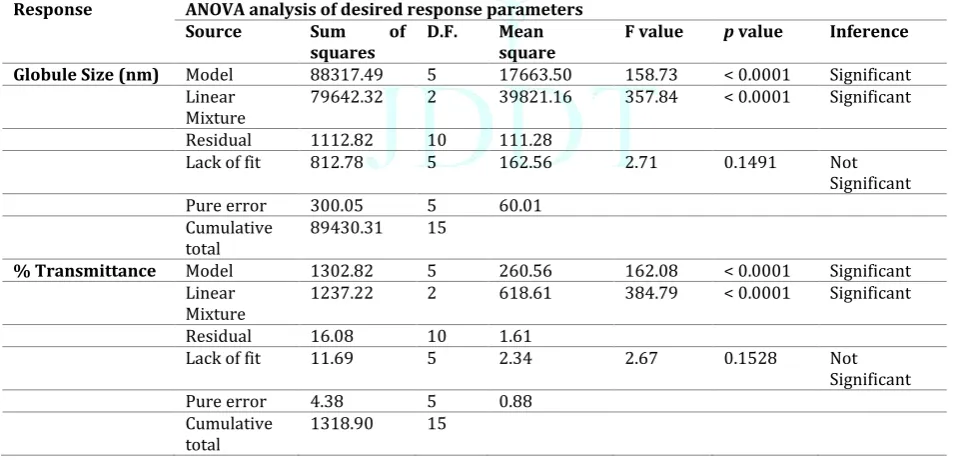
310.1±10.2 nm and 69.5±0.7 to 99.6±0.3 respectively. In order to investigate the significance level and to validate the design model, analysis of variance (ANOVA) was performed. It may justify the effects of each independent components on the response parameters i.e. globule size and % transmittance. The results are showed in Table 3. From the results, F value of both of the response parameters suggests the significance of the selected mathematical model. In
addition, p-value at 99% (p<0.001) confidence intervals
suggests that the model was highly significance among the observed and standard means and was best fitted for the present study.
Table 2: Experimental batches of Linagliptin loaded SMEDDS and their outcomes as per D-optimal mixture design
Values are represented as mean ± SD (n=3).
Table 3: Analysis of variance (ANOVA) for statistical analysis of desired response parameters
Response ANOVA analysis of desired response parameters
Source Sum of
squares D.F. Mean square F value p value Inference
Globule Size (nm) Model 88317.49 5 17663.50 158.73 < 0.0001 Significant
Linear
Mixture 79642.32 2 39821.16 357.84 < 0.0001 Significant
Residual 1112.82 10 111.28
Lack of fit 812.78 5 162.56 2.71 0.1491 Not
Significant
Pure error 300.05 5 60.01
Cumulative
total 89430.31 15
% Transmittance Model 1302.82 5 260.56 162.08 < 0.0001 Significant
Linear
Mixture 1237.22 2 618.61 384.79 < 0.0001 Significant
Residual 16.08 10 1.61
Lack of fit 11.69 5 2.34 2.67 0.1528 Not
Significant
Pure error 4.38 5 0.88
Cumulative
total 1318.90 15
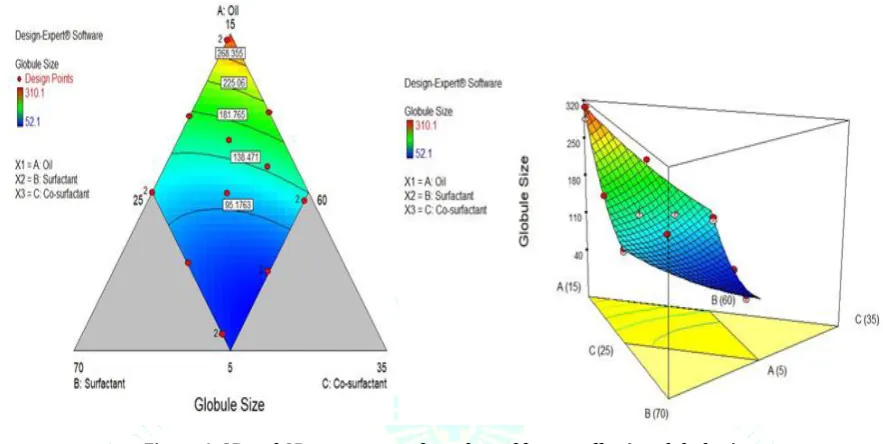
3.1.3.1 Effect of independent variables on globule
size(Y1)
Globule size analysis generally regarded as critical factor in the formation of microemulsion preconcentrates as the nano-sized globules have been known to have pronounced
rate and extent of absorption through the GIT [22]. As it can
see from Figure-4, as concentration of oil (Capmul MCM)
increases, the globule size increases linearly and vice versa i.e. globule size decreases with an increase in concentration of surfactant and co-surfactant. It is clearly observed from the slope and from curve of the surface plot, that surfactant alone is not enough to decrease the globule size in nano-sized range, concentration of co-surfactant is also responsible for the decrease in the globule size. The
Runs Oil (%) Surfactant (%) Co-surfactant (%) Globule Size (nm) % Transmittance
1 12.516 60.00 27.484 221.5±9.8 82.5±0.5
2 9.728 60.272 30.00 123.2±6.1 92.4±0.4
3 10.803 60.913 28.284 134.2±4.1 87.5±0.6
4 7.491 62.555 29.955 68.5±2.1 97.7±0.5
5 11.648 61.712 26.640 138.7±3.4 82.8±0.7
6 9.988 65.00 25.012 112.3±3.7 91.4±0.6
7 5.499 65.00 29.501 52.1±2.1 99.5±0.4
8 9.988 65.00 25.012 116.7±2.8 90.8±0.8
9 14.793 60.207 25.00 310.1±10.2 69.5±0.7
10 9.958 62.622 27.420 120.1±3.3 91.7±0.5
11 7.764 64.963 27.273 81.7±2.9 97.4±0.6
12 5.499 65.00 29.501 58.7±2.1 99.6±0.3
13 7.491 62.555 29.955 65.4±3.2 98.5±0.4
14 12.396 62.604 25.00 178.5±8.7 80.2±0.8
15 9.728 60.272 30.00 129.8±6.5 91.4±0.7
increased concentration of surfactant at oil interfaces often results in the disruption of transient interfacial tension and reduction in globule size, indicates that the globule size is inversely proportional to the surfactant concentration in the
formulation [23]. As shown in equation 1, X1, X2 and X3
(interaction terms) depicting that synergism and weight
ratio of selected components significantly decreased the globule size. Moreover, from the polynomial results, the magnitude of combined interaction (X1X2, X2X3 and X1X3) was considerably higher as compared to their individual variables.
Globule Size (nm) = + 323.68 * A - 1454.17 * B - 545.51 * C + 2719.39 * A * B + 1048.00 * A * C + 4153.44 * B * C - 5727.55 * A
* B * C - 2219.90 * A * B * (A-B) - 865.29 * A * C * (A-C) + 1518.71 * B * C * (B-C) …………..……….………..…………..…Eq. (1) Where, A=X1= Oil, B=X2=Surfactant, C=X3=Co-surfactant.
Figure 4: 2D and 3D response surface plots of facters affecting globule size
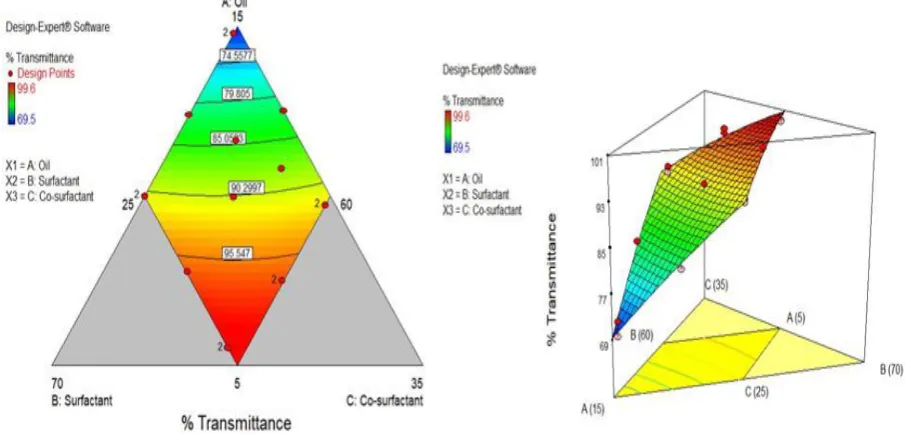
3.1.3.2 Effect of independent variables on %
transmittance (Y2)
% Transmittance is also an critical and fundamental attribute in the formulation of SMEDDS as it represents the optical birefringence and homogenecity of the formulation.
As shown in the equation no. 2, oil component (A) has a negative coefficient value indicates the decrease in optical clarity while components B (surfactant) and C (co-surfactant) having positive effect on the dependent parameters and suggests the increased optical clarity of the formulation.
% Transmittance = -17.41384
* A + 2.71673 * B + 7.00247 * C + 0.13604 * A* B + 0.21935 * A * C - 0.14149 * B * C ………..…Eq. (2)
Where, A=X1= Oil, B=X2=Surfactant, C=X3=Co-surfactant.
Moreover, as it can see form Figure-5 (2D and 3D response surface plots), as the concentration of oil increases the % transmittance decreases in linear manner. While synergistic effect was observed in the case of increase in the concentration of surfactant and co-surfactant. The maximum
transparency was found to be 99.6±0.3 among all the design batches. This study was further supported by the previous research work done on the selection of % transmittance as
Figure 5: 2D and 3D response surface plots of facters affecting % transmittance
3.1.3.3 Overlay plot and check point batch analysis
Overlay plot was created by superimposing contour plots of response parameters (Y1 and Y2) by the design expert software. This plot demonstrates the area of desired response values in the factor space also called desirability plots (Figure-6). This plot also demonstrates the low and
high desirability areas of the responses obtained by using different combinations of the independent variables. Moreover, the predicted and experimental values of the check point batch suggested by the software are shown in table 4. This impiles that this D-optimal mixture design was suitable to design robust formulation with high reproducibility.
Figure 6: Overlay and desirbility plots
Table 4: Values of independent variables of optimized SMEDDS formulation of Linagliptin Linagliptin loaded SMEDDS
Independent Variables
Oil (A) 5.49
Surfactant (B) 65.00
Co-surfactant (C) 29.50
Response parameters
Globule size (Y1) (nm) Predicted 55.098
Experimental 52.8±1.8
% Transmittance (Y2) (%) Predicted 99.8
Experimental 99.7±0.3
3.1.4 Selection of solid adsorbent
The minimum quantties of selected solid adsorbents i.e.
Aerosil® 200, Aerosil® 300, and Neusilin® US2 required to get
free flowing powder blend for Linagliptin SMEDDS were 600, 550 and 400 mg respectively to adsorb 1 ml of liquid SMEDDS, while in the case of Micro Crystalline Cellulose
(MCC 102), no adsorption of the SMEDDS was found.
Neusilin® US2 was selected as solid adsorbent amongst the
screened silicates derivatives due to its highly porous nature coupled with good flow characteristics. Moreover, table 5 shows the micromeritic properties of the solid-SMEDDS of linagliptin. It depicts that the solid-SMEDDS of Linagliptin exhibited excellent flow characteristics.
Table 5: Micromeritic properties of solid-SMEDDS of Linagliptin
Powder flow characteristics Results Inference
Bulk density (gm/ml) 0.427 ± 0.005 -
Tapped density (gm/ml) 0.449 ± 0.06 -
Angle of repose 29.87 ± 1.21 Very Good
Hausner’s ratio 1.12 ± 0.004 Excellent
Carr’s index 9.91 ± 0.007 Excellent
Values are represented as mean ± SD (n=3).
3.1.5 Characterization of the optimized SMEDDS of
Linagliptin
3.1.5.1 Self-emulsification time and zeta potential
Self-emulsification ability of SMEDDS is directly correlated to the spontaneous formation of microemulsion when comes in contact with an aqueous environment. Very low self-emulsification time of SMEDDS formulations favours spontaneous emulsification upon the dilution with aqueous media. Self-emulsification time of optimized SMEDDS of Linagliptin was found to be 10 ± 2 s in phosphate buffer (pH 6.8) suggests the faster rate of self-emulsification of the preconcentrates. It is an index for determination of
emulsification proficiency to get homogeneous
microemulsion and would be beneficial for the quick and
better therapeutic effect [24]. In addition, the zeta-potential
of the optimized SMEDDS of Linagliptin was found to be – 22.7 ± 1.2 mv depicts that the formulation was stable with no aggregation of globules in the continuous phase. This might be due to higher concentration of the non-ionic surfactant that may cause better self-emulsification of medium chain triglycerides in the formulation fabricating a negatively charged interface around the oil droplets, thereby enhancing
the stability of formulation [25].
3.1.5.2 Thermodynamic stability
The results of the thermodynamic stability testing of the optimized Linagliptin SMEDDS were shown in table 6.
Table 6: Thermodynamic stability testing of the optimized Linagliptin SMEDDS
Sr. No. Test Observations
1 Heating cooling cycle Remain Clear without any sign of turbidity
2 Centrifugation test No phase separation was found
3 Freeze thaw testing Formulation did not show any precipitation, color change or turbidity
As can see from the table 6, the formulation was thermodynamically stable. In brief, heating cooling cycles of the SMEDDS exerts stress on the two different phases of the microemulsion. Heating may cause coalescence of the oil globules by deactivating the surfactant and also cause density differrnce between the conituous and dispersed phases which may often leads to cracking of microemulsion. Moreover, centrifugation provides force that may acts on the dispersed phase based on the density difference between two phases and leads to coalescence of the oil globules when repellent forces were govern by the centrifugal force. Also, the freeze thaw stress testing imparts possible stress since both of the phases behaves contrarily during the freez thaw process with respect to their freezing point.
3.1.5.3 Cloud point measurement
Cloud point measurement is further important to determine the storage stability of the SMEDDS formulation. The cloud point is the temperature above which dehydration of SMEDDS components occurs and the clear dispersion may become a cloudy one which further affect on the absorption
of drug through the GIT [26]. Thus, the cloud point of SMEDDS
formulation should be above the body tmeperature i.e. > 37°C ). In this investigation, the cloud point value as mean ± SD (n=3) of the optimized Solid-SMEDDS formulation was found to be 69.0 ± 0.49 °C, indicates the stability of the formulation at physiologic temperature.
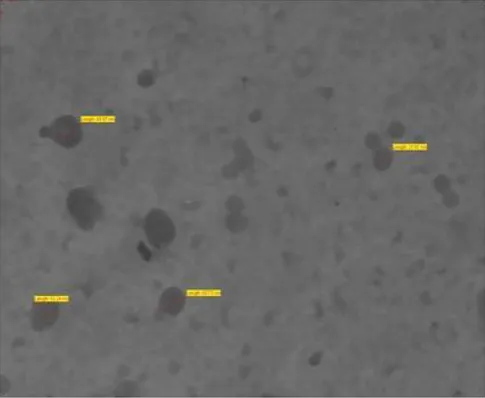
3.1.5.4 Transmission Electron Microscopy
TEM images of diluted SMEDDS is shown in Figure-7. The globule size was found to be around 50 nm, having size distribution similar to the results obtained by DLS technique.
3.1.5.5 Assay
The drug content i.e. concentration of Linagliptin in the optimized solid-SMEDDS was found to be 99.1 ± 0.3 % (9.91 ± 0.4 mg) (n=3).
3.1.5.6 In-vitrro drug release study
The release profile of drug suspension and Linagliptin loded solid-SMEDDS is shown in Figure-8. Significantly higher drug release (95.6 ± 2.1) of Linagliptin from the Soild-SMEDDS than form the drug suspension (28.2 ± 2.3) after 12 h may be
because of the smaller globule size and increase concentration of drug in dissolved form. Moreover, higher surface curvature due to the reduction in globule size may also leads to immediate/faster solublization of drug at oil/water interface. In addition, this rapid release of the drug favors higher systemic drug availability due to better absorption and bioavailability. As can see from the table 7, Linagliptin loaded solid-SMEDDS was follows Korsmeyer
Peppas model (R2 0.9854, diffudion controlled) whereas the
value of n (diffusion exponent) was found to [27] be 0.49
(0.45<n=0.89) i.e. non-fickian transport .
Table 7: Release kinetics of Linagliptin Solid-SMEEDS
Formulations Linear Regression Coefficient (R2)
Zero Order
Model Order ModelFirst Higuchi Model Crowell ModelHixson Korsmeyer Peppas Model
Drug Suspension 0.9927 0.9989 0.9441 0.9445 0.9833
Solid-SMEDDS 0.9837 0.8477 0.8663 0.9359 0.9854
Values are represented as mean (n=3).
Figure 8: In-vitro release profile of drug suspension and optimized Linagliptin Soild-SMEDDS
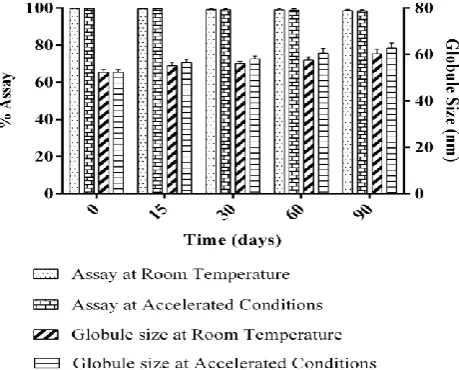
3.1.5.7 Stability study
The results of 3 month stability study of Linagliptin Solid-SMEDDS are represented in Figure-9. The study was performed in triplicates and results are expressed as mean ± SD. The data suggests that the solid-SMEDDS was thermodynamically stable i.e. not significant difference in the globule size and assay of the formulation at least for 3 months. Moreover, the physical appearance of the Solid-SMEDDS was remained unchanged during the 3 month stability study.
Figure 9: Stability data of Linagliptin Solid-SMEDDS at Room temperature and Accelerated conditions
4. CONCLUSION
In the present investigation, S-SMEDDS technology was chosen here as simple, scalable and cost-effective way to improve solubility and dissolution profile of Linagliptin. Quality by Design approach was utilized for the development and optimization of Linagliptin SMEDDS where oil, surfactant and co-surfactant were identified as independent parameters and globule size and % transmittance were selected as response variables. In addition, as a part of the control strategy, D-Optimal Mixture design was applied to meticulously understand the intricate interfacial phenomena among these factors to form SMEDDS. Moreover, experimental design was further validated by using check point batch analysis and the optimal concentrations of the variables were obtained from the design expert software
within the developed design space. In-vitro characterization
demonstrated the thermodynamic stability of developed SMEDDS along with the significantly enhanced drug release profile of the Linagliptin from the formulation. Further, developed solid-SMEDDS also exhibits free flowing properties and desired self-emulsification potential along with the good stability profile over the 3 months. In a nutshell, present investigation judiciously extrapolated the variegated characteristics of SMEDDS for improving the solubility and dissolution profile of poorly soluble anti-diabetic drug Linagliptin.
CONFLICT OF INTEREST
Authors declare no conflict of interest. REFERENCES
1. Scott L.J., Linagliptin. Drugs, 2011. 71(5):611-624.
2. Graefe-Mody U., Retlich S, Friedrich C, Clinical pharmacokinetics and pharmacodynamics of linagliptin. Clinical
pharmacokinetics, 2012. 51(7):411-427.
3. Reddy B.P., et al., Linagliptin solid dispersion. 2016, Google Patents.
4. Modgill, V., et al., Transmucosal delivery of linagliptin for the treatment of type-2 diabetes mellitus by ultra-thin nanofibers. Current drug delivery, 2015. 12(3):323-332.
5. Nishu S.B.N., et al., In vitro and Ex vivo Studies of Linagliptin Loaded Non-Ionic Surfactant Vesicles Using Statistical Optimization. 2018.
6. Singh B., et al., Optimized nanoemulsifying systems with enhanced bioavailability of carvedilol. Colloids and Surfaces B: Biointerfaces, 2013. 101:465-474.
7. Bali V., M. Ali and Ali J, Nanocarrier for the enhanced bioavailability of a cardiovascular agent: in vitro,
8. Seo Y.G., et al., Development of docetaxel-loaded solid self-nanoemulsifying drug delivery system (SNEDDS) for enhanced chemotherapeutic effect. International journal of
pharmaceutics, 2013. 452(1-2):412-420.
9. Date A.A., et al., Self-nanoemulsifying drug delivery systems: formulation insights, applications and advances. Nanomedicine, 2010. 5(10):1595-1616.
10. Hu X., et al., Sirolimus solid self-microemulsifying pellets: formulation development, characterization and bioavailability evaluation. International journal of pharmaceutics, 2012. 438(1-2):123-133.
11. Pund S., Y. Shete and Jagadale S, Multivariate analysis of physicochemical characteristics of lipid based nanoemulsifying cilostazol—Quality by design. Colloids and Surfaces B: Biointerfaces, 2014. 115:29-36.
12. Wu H., M. White and Khan MA, Quality-by-Design (QbD): An integrated process analytical technology (PAT) approach for a dynamic pharmaceutical co-precipitation process
characterization and process design space development. International journal of pharmaceutics, 2011. 405(1-2):63-78. 13. Balakrishnan P., et al., Enhanced oral bioavailability of
dexibuprofen by a novel solid self-emulsifying drug delivery system (SEDDS). European Journal of Pharmaceutics and Biopharmaceutics, 2009. 72(3):539-545.
14. Vohra A.M., et al., Development of dual drug loaded solid self microemulsifying drug delivery system: Exploring interfacial interactions using QbD coupled risk based approach. Journal of Molecular Liquids, 2017. 242:1156-1168.
15. Fagir W., et al., Self-microemulsifying systems of Finasteride with enhanced oral bioavailability: multivariate statistical evaluation, characterization, spray-drying and in vivo studies in human volunteers. Nanomedicine, 2015. 10(22):3373-3389. 16. Patel J., et al., Targeted delivery of monoclonal antibody
conjugated docetaxel loaded PLGA nanoparticles into EGFR overexpressed lung tumour cells. Journal of microencapsulation, 2018. 35(2):204-217.
17. Javia A. and H. Thakkar, Intranasal delivery of tapentadol hydrochloride–loaded chitosan nanoparticles: Formulation,
characterisation and its in vivo evaluation. Journal of microencapsulation, 2017. 34(7):644-658.
18. Guideline I.H.T., Stability testing of new drug substances and products. Q1A (R2), current step, 2003. 4:1-24.
19. Gursoy R.N. and S. Benita, Self-emulsifying drug delivery systems (SEDDS) for improved oral delivery of lipophilic drugs.
Biomedicine & Pharmacotherapy, 2004. 58(3): 173-182. 20. Beg S., et al., Solid self-nanoemulsifying systems of olmesartan
medoxomil: Formulation development, micromeritic characterization, in vitro and in vivo evaluation. Powder Technology, 2016. 294:93-104.
21. Nazzal S. and M.A. Khan, Response surface methodology for the optimization of ubiquinone self-nanoemulsified drug delivery system. AAPS PharmSciTech, 2002. 3(1):23-31.
22. Pouton C.W., Formulation of poorly water-soluble drugs for oral administration: physicochemical and physiological issues and the lipid formulation classification system. European journal of pharmaceutical sciences, 2006. 29(3-4):278-287.
23. Zhao G., et al., Enhanced intestinal absorption of etoposide by self-microemulsifying drug delivery systems: Roles of P-glycoprotein and cytochrome P450 3A inhibition. European Journal of Pharmaceutical Sciences, 2013. 50(3-4):429-439. 24. Chaurasiya A., et al., Dual approach utilizing self
microemulsifying technique and novel P-gp inhibitor for effective delivery of taxanes. Journal of microencapsulation, 2012. 29(6):583-595.
25. Sood J., B. Sapra and Tiwary AK, Microemulsion transdermal formulation for simultaneous delivery of valsartan and nifedipine: formulation by design. AAPS PharmSciTech, 2017. 18(6):1901-1916.
26. Gupta S., Chavhan S, and Sawant KK, Self-nanoemulsifying drug delivery system for adefovir dipivoxil: design, characterization, in vitro and ex vivo evaluation. Colloids and Surfaces A:
Physicochemical and Engineering Aspects, 2011. 392 (1):145-155.