METHOD DEVELOPMENT AND VALIDATION SIMULTANEOUS
ESTIMATION OF STABILITY SYSTEM OF LORNOXICAM AND
THIOCOLCHICOSIDE BY RP-HPLC
Uppari Amarnath*
Department of Pharmaceutical Sciences, Acharya Nagarjuna University, Nagarjuna Nagar,
Guntur, Andhra Pradesh- 522 510.
M.A.M. College of Pharmacy, Kesanupalli,Narsaraopet,Guntur,A.P
ABSTRACT
A new stability-indicating reversed-phase high-performance liqud
chromatographic (RP-HPLC) method for the analysis of lornoxicam
and thiocolchicoside was developed and validated. The column used
was Inertsil –ODS C18 (250 × 4.6 mm,5µ) with flow rate of1.0ml/min using PDA detection at 239nm. The chromatograms were developed
using aluminum plates pre-coated with silica gel as a stationary phase
and Acetonitrile: water ( 55:45v/v ) as a mobile phase. The described
method was linear over a concentration range of 20ppm to 80ppm for
the assay of lornoxicam and thiocolchicoside respectively. The
retention times of lornoxicam and thiocolchicoside were found to be
2.869min and 3.942min respectively. Results of analysis were
validated statistically and by recovery studies. The limit of
quantification (LOQ) for lornoxicam and thiocolchicoside were found
to be 1.69mg/ml and 1.74mg/ml respectively. Then the limit of detection (LOD) for
lornoxicam and thiocolchicoside were found to be 0.56 mg/ml and 0.57 mg/ml respectively.
The drug was exposed to acidic and alkaline hydrolysis, oxidation, photo degradation, and
dry heat conditioners. The peaks of degradation products were well-resolved from the peak of
the standard drug with significantly different values. Statistical analysis proved that the
established RP-HPTLC method is reproducible, selective, and accurate for the determination
of lornoxicam and thiocolchicoside in its formulations. The method can effectively separate
the drug from its degradation products, and it can be considered as stability-indicating assay.
Volume 4, Issue 8, 2530-2548. Research Article ISSN 2277– 7105
Article Received on 19 June 2015,
Revised on 10 July 2015, Accepted on 02 Aug 2015
*Correspondence for Author Uppari Amarnath Department of
Pharmaceutical Sciences,
Acharya Nagarjuna
University, Nagarjuna
Nagar, Guntur, Andhra
KEYWORDS: Lornoxicam, Thiocolchicoside, Acetonitrile.
MATERIALS AND METHOD Chemicals and solvents
lornoxicam and thiocolchicoside as gift samples from hetero Laboratories Limited,
Hyderabad, India. The commercial Pharmaceutical topical formulation of D aktacort
containing 15w/w hydrocortisone, miconazole-2%W/W (manufactured by Johnson &
johnson) were procured from local pharmacy. Potassium dihydrogen phosphate – AR grade
(SD.Fine chem. Ltd, mumdai), Acetonitrile-HPLC grade (Merck India), Methanol – HPLC
grade (Merck India).
INSTRUMENTATION
The chromatographic separations were performed using HPLC-Waters alliance
(Model-2690/5) consisting of an in-built auto sampler, a column oven and Waters 996 PDA detector.
The data was acquired through Empower-2-software. The column used was Inertsil ODS
(250×4.6 mm, 5μ). Meltronics sonicator was used for enhancing dissolution of the
compounds. Elico pH meter was used for adjusting the pH of buffer solution. All weighing
was done on Sartorious balance (model AE-160).
Chromatographic conditions
The mobile phase consists of Arthophosporic acid: metanol in the ratio of 55:45 v/v. The
mobile phase was pumped from solvent reservoir in the ratio of 55:45 v/v to the column in
the flow rate of 1.0 ml/min whereas run time set was 10 min. The separation was performed
on Inertsil ODS-3V 250mm x 4.6mm, 5μm column and the column was maintained the
temperature ambient and the volume of each injection was 20µl. Prior to injection, the
column was equilibrated for at least 30 min with mobile phase flowing through the system.
The eluents were monitored at 256 nm.
OPTIMISED METHOD Mobile Phase
Orthophosphoric acid and methanol in the ratio of (45:55)
separately and sonicate for 20min. From the above solutions take 10.0 ml from each solution
into a 50.0 mL volumetric flask and then makeup with mobile phase and sonicate for 10min.
Preparation of working standard solution
The stock solutions equivalent to 20ppm to 80ppm with respect to both drugs were prepared
in combination of Lornoxicam and Thiocolchicoside above, sonicated and filtered through
0.45µ membrane.
Optimized chromatographic conditions
Parameters Method
Stationary phase (column) Inertsil -BDS C18(250 x 4.6 mm, 5 µ)
Mobile Phase Acetonitrile: water (55:45)
Flow rate (ml/min) 1.0 ml/min
Run time (minutes) 10 min
Column temperature (°C) Ambient
Volume of injection loop (l) 20
Detection wavelength (nm) 256nm
Drug RT (min) 2.869min for Lornoxicam and 3.942for Thiocolchicoside
L
o
rn
o
x
ic
a
m
2
.8
6
9
Th
io
c
o
lc
h
ic
o
s
id
e
3
.9
4
2
AU
0.00 0.02 0.04 0.06 0.08 0.10 0.12 0.14
Minutes
1.00 2.00 3.00 4.00 5.00 6.00 7.00 8.00 9.00 10.00
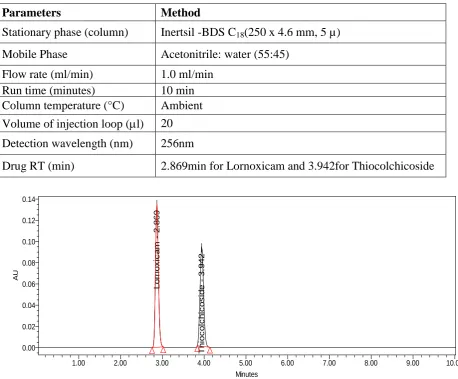
Fig 4: Chromatogram of standard
Inference
Got chromatogram at RT’s of 2.869min to Lornoxicam and 3.942min to Thiocolchicoside for
[image:3.595.76.535.241.620.2]6.3 VALIDATION DATA
6.3.1 SYSTEM SUITABILITY
A Standard solution was prepared by using Lornoxicam and Thiocolchicoside Potassium
working standards as per test method and was injected Five times into the HPLC system.
The system suitability parameters were evaluated from standard chromatograms by
calculating the % RSD from five replicate injections for Lornoxicam and Thiocolchicoside,
retention times and peak areas.
ACCEPTANCE CRITERIA
1. The % RSD for the retention times of principal peak from 5 replicate injections of each
Standard solution should be not more than 2.0 %
2. The % RSD for the peak area responses of principal peak from 5 replicate injections of
each standard Solution should be not more than 2.0%.
3. The number of theoretical plates (N) for the Lornoxicam and Thiocolchicoside peaks is
NLT 3000.
4. The Tailing factor (T) for the Lornoxicam and Thiocolchicoside
peaks is NMT 2.0
TABLE- 1(a): Data of System Suitability for Lornoxicam andThicolchicoside
Lornoxicam Thiocolchicoside
Injection RT Peak
area
USP plate count
USP
tailing RT
Peak area
USP platecount
USP trailling
1 2.869 2748977 9478.317159 1.021108 3.942 729374 10953.609752 1.604407
2 2.868 2748357 9452.196217 1.080574 3.942 729587 10951.014286 1.604878
3 2.872 2748360 9569.928335 1.090824 3.944 729020 10003.278630 1.590957
4 2.868 2748206 9619.633847 1.089932 3.940 729174 10986.906427 1.584354
5 2.872 2748407 9749.907462 1.108610 3.943 729744 10946.878423 1.566451
MEAN 2.865841 2748461 9573.997 1.07821 3.9424
112 729379.8 10768.34 1.590209
SD 0.00148 297.998 ………. ………. 0.0046
58 294.7104 ……….. ………
%RSD 0.050 0.0108 ……….. ………. 0.131 0.040 ……….. ………
OBSERVATION
The %RSD for retention times and peak areas were found to be within the limit. Refer table:
L o rn o x ic a m 2 .8 6 9 Th io c o lc h ic o s id e 3 .9 4 2 AU 0.00 0.02 0.04 0.06 0.08 0.10 0.12 0.14 Minutes
1.00 2.00 3.00 4.00 5.00 6.00 7.00 8.00 9.00 10.00
Fig: 6-10 Chromatograms of system suitability (standards 1-5) Inference: System suitability Chromatogram for standard – 1
L o rn o x ic a m 2 .8 6 9 Th io c o lc h ic o s id e 3 .9 4 2 AU 0.00 0.02 0.04 0.06 0.08 0.10 0.12 0.14 Minutes
1.00 2.00 3.00 4.00 5.00 6.00 7.00 8.00 9.00 10.00
Inference: System suitability Chromatogram for standard – 2
L o rn o x ic a m 2 .8 7 2 Th io c o lc h ic o s id e 3 .9 4 4 AU 0.00 0.02 0.04 0.06 0.08 0.10 0.12 Minutes
1.00 2.00 3.00 4.00 5.00 6.00 7.00 8.00 9.00 10.00
L o rn o x ic a m 2 .8 6 8 Th io c o lc h ic o s id e 3 .9 4 0 AU 0.00 0.02 0.04 0.06 0.08 0.10 0.12 0.14 Minutes
1.00 2.00 3.00 4.00 5.00 6.00 7.00 8.00 9.00 10.00
Inference: System suitability Chromatogram for standard - 4
L o rn o x ic a m 2 .8 7 2 Th io c o lc h ic o s id e 3 .9 4 3 AU 0.00 0.02 0.04 0.06 0.08 0.10 0.12 0.14 Minutes
1.00 2.00 3.00 4.00 5.00 6.00 7.00 8.00 9.00 10.00
Inference: System suitability Chromatogram for standard – 5
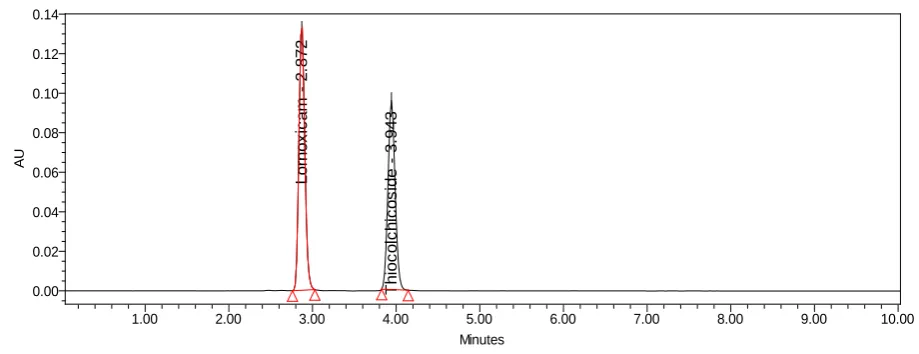
6.3.2: SPECIFICITY
Lornoxicam and Thiocolchicoside
Solutions of standard and sample were prepared as per the test method are injected into
chromatographic system.
ACCEPTENCE CRITERIA
L o rn o x ic a m 2 .8 7 2 Th io c o lc h ic o s id e 3 .9 4 3 AU 0.00 0.02 0.04 0.06 0.08 0.10 0.12 0.14 Minutes
[image:7.595.82.542.70.247.2]1.00 2.00 3.00 4.00 5.00 6.00 7.00 8.00 9.00 10.00
Fig 6: Chromatogram of standard
Inference: Got a peak for standard at an Rt of 2.875min for Lornoxicam and 3.943min for Thiocolchicoside
OBSERVATION
The chromatograms of Standard and Sample were same identical with same retention time.
As shown in fig: 6.
6.3.3 LINEARITY
A Series of solutions are prepared using Lornoxicam and Thiocolchicoside working
standards at concentration levels from 25ppm to 150 ppm of target concentration .Measure
the peak area response of solution at Level 1 and Level 6 six times and Level 2 to Level 5
two times.
ACCEPTANCE CRITERIA
Correlation Coefficient should be not less than 0.9990.
% of y- Intercept should be ±2.0.
% of RSD for level 1 and Level 6 should be not more than 2.0%.
(i) Data of Linearity Lornoxicam and Thiocolchicoside Concentration
(ppm)
Average Area
Statistical Analysis of Lornoxicam
Average Area
Statistical analysis of Thiocolchicoside
0 0 Slope 5140 0 Slope 18600
20 102965 y-Intercept 114.7 372546 y-intersept 276.2
30 154371 Correlation
Coefficient 1 558296
Correlation
Coefficient 1
50 257167 930308
60 308577 1116282
70 359903 1302046
80 411306 1488277
TABLE6.3.3 OBSERVATION
The linear fit of the system was illustrated graphically. The results are presented in table6.
Fig: 41(a) Linearity Plot (Concentration Vs Response) of Lornoxicam
Fig: 41(b) Linearity Plot (Concentration Vs Response) of Thiocolchicoside
Method precision: Prepared six sample preparations individually using single as per test
method and injected each solution.
ACCEPTANCE CRITERIA
The % relative standard deviation of individual Lornoxicam and Thiocolchicoside, from the
six units should be not more than 2.0%.
The individual assays of Lornoxicam and Thiocolchicoside should be not less than 98% and
not more than 102.0%.
(a) System precision
TABLE-2(i): Data of Repeatability (System precision) for Lornoxicam and thiocolchicosid
Concentration 40ppm
injection Peak area of
Lornoxicam %Assay
Peak area of
Thiocolchicoside %Assay
1 205625 99.95 734360 98.66
2 206225 100.24 739098 99.30
3 205840 100.06 755696 101.53
4 204283 99.30 748289 100.53
5 205735 100.00 744147 99.98
Mean 205541.6 99.91 744318 100.00
Statistical Analysis
SD 739.0046 0.35819 8241.164 1.107678
%RSD 0.35 0.35 1.1 1.10
OBSERVATION
Test results are showing that the test method is precise. Refer tables 2 and 3 for system
precision and for method precision.
(b)Method precision
TABLE-3(i): Data of Repeatability (Method precision) for Lornoxicam andthiocolchicoside
Concentration 40ppm
injection Peak area of
Lornoxicam %Assay
Peak area of
Thiocolchicoside %Assay
1 202110 98.6 733495 98.55
2 203700 99.02 735992 98.88
3 201851 98.12 739828 99.40
4 202255 98.31 739098 99.30
5 203283 98.81 748289 100.53
6 202349 98.36 731322 98.28
MEAN 202687.6 98.48 738004 99.278
Statistical Analysis
SD 771.5483 0.352647 5988.879 0.827236
OBSERVATION
Test results are showing that the test method is precise. Refer tables 2 and 3 for system
precision and for method precision.
.5 Intermediate precision
A study was conducted by two analysts as per test method.
ACCEPTENCE CRITERIA
The individual assays of Lornoxicam and Thiocolchicoside should be not less than 98% and
not more than 102% and %RSD of assays should be NMT2.0% by both analysts.
Table4: (i) Data of Intermediate precision (Analyst 2) for Lornoxicam and Thiocolchicoside
Concentration 40ppm
injection Peak area of
Lornoxicam %Assay
Peak area of
Thiocolchicoside %Assay
1 205267 99.78 736792 99.99
2 205625 99.95 734360 99.66
3 205840 100.00 755696 101.53
4 202735 98.55 744147 99.98
5 208991 101.50 744127 99.97
6 208543 101.37 752525 101.10
MEAN 206333.5 100.19 744607.8 100.37
Statistical Analysis
SD 2572.599 1.100898 8392.59 0.753536
%RSD 1.24 1.09 1.1 0.75
TABLE6.3.5 OBSERVATION
Individual %assays and %RSD of Assay are within limit and passes the intermediate
precision, Refer table: 4
6 ACCURACY (RECOVERY)
A study of Accuracy was conducted. Drug Assay was performed in triplicate as per test
method with equivalent amount of Lornoxicam and Thiocolchicoside into each volumetric
flask for each spike level to get the concentration of Lornoxicam and Thiocolchicoside
equivalent to 50%, 100%, and 150% of the labeled amount as per the test method. The
ACCEPTANCE CRITERIA
The mean % recovery of the Lornoxicam and Thiocolchicoside at each spike level should be
not less than 98.0% and not more than 102.0% for both the drugs separately.
OBSERVATION
Amount found
%Recovery = --- × 100
Amount added
The recovery results indicating that the test method has anacceptable level of accuracy. Refer
table: 5
Data of Accuracy for Lornoxicam and Thiocolchicoside
Lornoxicam Thiocolchicoside
Concentration % of spiked
level
Amount added (ppm)
Amount found (ppm)
% Recovery
Statistical Analysis of %
Recovery
Amount found (ppm)
% Recovery
Statistical Analysis of %
Recovery
50%
Injection1 20 20.15 100.75 MEAN 99.69333 20.40 100.22 MEAN 100.06
50%
Injection2 20 19.86 99.31 19.97 98.85
50%
Injection3 20 19.80 99.02 %RSD 0.92 20.02 100.11 %RSD 0.18
100%
Injection1 40 39.88 99.70 MEAN 99.83333 40.01 100.02 MAEN 100.04
100%
Injection2 40 40.12 100.30 40.05 100.14
100%
Injection3 40 39.80 99.50 %RSD 0.41 39.98 99.96 %RSD 0.091
150%
Injection1 60 100.21 100.21 MEAN 99.97333 60.08 100.14 MEAN 100.02
150%
Injection2 60 99.61 99.61 59.97 99.96
150%
Injection3 60 100.10 100.10 %RSD 0.31 59.98 99.98 %RSD 0.09
TABLE6.3.6 7 Ruggedness
a) System to System variability ACCEPTANCE CRITERIA
The % relative standard deviation of Lornoxicam and Thiocolchicoside from the six sample
The % assay of Lornoxicam and Thiocolchicoside should be between 98.0%-102.0%.
b) column to column variability
Column to column variability study was conducted by using different columns. Six samples
were prepared and each was analysed as per test method
ACCEPTANCE CRITERIA
The %RSD of Lornoxicam and Thiocolchicoside tablets should be NMT2.0%. The %assay
of Lornoxicam and Thiocolchicoside should be between 98.0% and 102.0% for individual
drugs.
Data of system to system variability (Lornoxicam and Thiocolchicoside System-2
Lornoxicam Thiocolchicoside
S.NO Peak area Assay % of
Lornoxicam Peak area
Assay % of Thiocolchicoside
1 203625 99.98 734360 98.65
2 202225 99.30 734098 98.63
3 202840 98.60 735696 98.86
4 204283 99.30 733289 98.52
5 202735 98.55 734147 98.63
6 203110 98.73 733495 98.55
7 203136.3 99.07667 734180.8 98.64
8 0.35 0.56 0.11 0.12
TABLE6.3.7 OBSERVATION
The % RSD was found within the limit
The results obtained by comparing with both two types were within limit. Refer tables: 3 &9
8 Robustness
a) Effect of variation of flow rate
A study was conducted to determine the effect of variation in flow rate. Standard solution
prepared as per the test method was injected into the HPLC system using flow rates,
1.0ml/min and1.2ml/min. The system suitability parameters were evaluated and found to be
within the limits for 1.0ml/min and 1.2ml/min flow.
Lornoxicam and Thiocolchicoside and was resolved from all other peaks and the retention
ACCEPTANCE CRITERIA
The Tailing Factor of Lornoxicam and Thiocolchicoside standards should be NMT 2.0 for
Variation in Flow.
b) Effect of variation of temperature
A study was conducted to determine the effect of variation in temperature. Standard solution
prepared as per the test method was injected into the HPLC system at 20ºC temperature. The
system suitability parameters were evaluated and found to be within the limits for a
temperature change of 20ºc.
Similarly sample solution was chromatographed at 25ºC temperature. Lornoxicam and
Thiocolchicoside were resolved from all other peaks and the retention times were comparable
with those
ACCEPTANCE CRITERIA
The Tailing Factor of Lornoxicam and Thiocolchicoside standard and sample solutions
should be NMT 2.0 for Variation in temperature.
TABLE: 10(i) Data for Effect of variation in flow rate (Lornoxicam)
Flow 0.8 ml
Std Area
Tailing factor
Flow 1.0 ml
Std Area
Tailing factor
Flow 1.2 ml
Std Area
Tailing factor
273707 1.362089 206349 1.280574 166195 1.285372
273211 1.352617 205267 1.279932 165885 1.299385
273948 1.376926 205625 1.261721 166303 1.308063
273465 1.345752 205840 1.276089 167243 1.274662
273862 1.374925 205735 1.250640 165762 1.267630
Avg 273638.6 1.362462 Avg 205763.2 1.269791 Avg 166277.6 1.287022
SD 301.369 0.013609 SD 392.1635 0.01314 SD 582.9758 0.016786
%RSD 0.11 0.99 %RSD 0.19 1.03 %RSD 0.35 1.3
TABLE6.3.8 OBSERVATION
The tailing factor for Lornoxicam and Thiocolchicoside was found to be within the limits. As
shown in table 10.
(ii) Data for Effect of variation in flow rate (Thiocolchicoside)
Flow 0.8 ml
Std Area
Tailing factor
Flow 1.0 ml
Std Area
Tailing factor
Flow 1.2 ml
Std Area
Tailing factor
1120286 1.322089 734322 1.604878 602077 1.285372
1119282 1.331920 735792 1.584354 601854 1.319385
1120456 1.315454 735696 1.568590 603421 1.304561
1120765 1.326551 733147 1.559986 602465 1.294621
Avg 1120425 1.31849 Avg 734663.4 1.572323 Avg 602444 1.299199
SD 754.0018 0.013728 SD 1100.917 0.023367 SD 599.8833 0.013223
%RSD 0.06 1.04 %RSD 0.14 1.48 %RSD 0.09 1.01
TABLE6.3.8 OBSERVATION
The tailing factor for Lornoxicam and Thiocolchicoside
x is found to be within the limits. As shown in table 11.
8LIMIT OF DETECTION AND LIMIT OF QUANTITATION (LOD and LOQ) Lornoxicam: From the linearity plot the LOD and LOQ are calculated:
LOD = 3.3 σ S
3.3×867.0705
= --- = 0.56 5140
LOQ = 10 σ S
10×867.0705
= --- = 1.69 5140
Thiocolchicoside
LOD = 3.3 σ S
3.3×3244.904
= --- = 0.57 18600
LOQ = 10 σ S
10×3244.904
FORCED DEGRADATION STUDIES
Forced degradation studies were performed to demonstrate the optimized method is stability
indicating. To prove the method which can be able to measure accurately active
pharmaceutical ingredient in presence of degradants which are expected to be formed during
different types of degradations applied to the drug sample.
For forced degradation analysis, aliquots of stock were separately treated with 1ml of 2N HCl
(Acid stability), 1ml of 2N NaOH (Alkaline stability), 1ml of 20% H2O2 (Oxidative
degradation), exposure of sample drug solution at 105ºC for 6 hrs (dry heat degradation),
photo stability degradation (exposure of drug at 200 watt hours/m2) and neutral degradation
(refluxing with water at 60ºC for 6 hours. Stability of these samples was compared with fresh
sample on the day of analysis. The HPLC chromatograms of degraded products show no
interference at the respective analyte peaks and the individual analytes peak purity values
found to be within the acceptable limits, hence the method was specific and stability
indicating. The chromatograms were shown in figures 22 to 27 and the results were shown in
Table-8 (8A, 8B, 8C). The detailed degradation for each condition is as follows:
Oxidation
To sample stock solution of Lornoxicam, Thiocolchicoside, 1 ml of 20% hydrogen peroxide
(H2O2) was added. The solution was kept for 30 min at 600C and cooled to room
temperature and finally made up to volume with diluent. For HPLC study, the resultant
solution was diluted to obtain 60μg/ml, 120μg/ml and 10μg/ml of all components and 10 μl
of sample solution was injected into the system and the chromatograms were recorded to
assess the stability of sample.
Acid Degradation Studies
To sample stock solution of Lornoxicam, Thiocolchicoside, 1mL of 2N Hydrochloric acid
was added and refluxed for 30mins at 600C and cooled to room temperature and neutralized
with 1 mL of 2N sodium hydroxide solution and finally made up to volume with diluent. For
HPLC study, the resultant solution was diluted to obtain 60μg/ml, 120μg/ml and 10μg/ml of all components and 10 μl of sample solution was injected into the system and the
Alkali Degradation Studies
To sample stock solution of Lornoxicam, Thiocolchicoside, 1mL of 2N sodium hydroxide
solution was added and refluxed for 30mins at 600C and cooled to room temperature and
neutralized with 1 mL of 2N Hydrochloric acid solution and finally made up to volume with
diluent. For HPLC study, the resultant solution was diluted to obtain 60μg/ml, 120μg/ml and
10μg/ml of all components and 10 μl of sample solution was injected into the system and the
chromatograms were recorded to assess the stability of sample.
Dry Heat Degradation Studies
The sample stock solution was placed in oven at 1050C for 6 hours to study dry heat
degradation and after dry heat cooled to room temperature. For HPLC study, the resultant
solution was diluted to obtain 60μg/ml, 120μg/ml and 10μg/ml of all components and 10 μl
of sample solution was injected into the system and the chromatograms were recorded to
assess the stability of sample.
Photo Stability studies
The photochemical stability of the drug was also studied by exposing the sample stock
solution to UV Light by keeping the beaker in UV Chamber for 7days or 200 Watt hours/m2
in photo stability chamber. For HPLC study, the resultant solution was diluted to obtain
60μg/ml, 120μg/ml and 10μg/ml of all components and 10 μl of sample solution was injected
into the system and the chromatograms were recorded to assess the stability of sample.
Neutral Degradation Studies
Stress testing under neutral conditions was studied by refluxing the sample stock solution in
water for 6hrs at a temperature of 60ºC. For HPLC study, the resultant solution was diluted to
obtain 60μg/ml, 120μg/ml and 10μg/ml of all components and 10 μl of sample solution was
injected into the system and the chromatograms were recorded to assess the stability of
sample.
Frorce degradation studies result for lornoxicam
Sr. No Injection %Assay %Degradation Purity Angle Purity Threshold Purity Flag
1 Controlled
sample 100.1 -- 0.301 1.348 No
4 Peroxide
Degradation 94.4 5.7 1.604 2.194 No
5 Thermal
Degradation 98.6 1.5 0.259 0.290 No
6 UV
Degradation 99.5 0.6 0.308 0.329 No
7 Water
Degradation 98.8 1.3 0.229 0.280 No
Table-8C: Forced Degradation study results for Thiocolchicoside
S. No Injection %Assay %Degradation Purity
Angle
Purity Threshold
Purity Flag
1 Controlled
Sample 99.9 --- 0.121 0.395 No
2 Acid
Degradation 95.5 4.4 0.379 0.416 No
3 Base
Degradation 96.4 3.5 0.759 1.187 No
4 Peroxide
Degradation 91.6 8.3 1.607 2.177 No
5 Thermal
Degradation 97.9 2.0 0.381 0.425 No
6 UV
Degradation 98.7 1.2 0.411 0.481 No
7 Water
Degradation 98.5 1.4 0.275 0.421 No
SUMMARY AND CONCLUSION
The analytical method was developed by studying different parameters. First of all, maximum
absorbance was found to be at 363nm for Lornoxicam and 256nm for Lornoxicam.Common
wavelength will be 256nm and the peaks purity was excellent. Injection volume was selected
to be 20µl which gave a good peak area. The column used for study was Inertrsil C18, BDS
chosen good peak shape. Ambient temperature was found to be suitable for the nature of drug
solution. The flow rate was fixed at 1.0ml/min because of good peak area, satisfactory
retention time and good resolution. Different ratios of mobile phase were studied, mobile
phase with ratio of 45:55 Acetonitrile: water was fixed due to good symmetrical peaks and
for good resolution. So this mobile phase was used for the proposed study.
The present recovery was found to be 98.0-101.50 was linear and precise over the same
range. Both system and method precision was found to be accurate and well within range.
Detection limit was found to be 0.56 for Lornoxicam and 0.57 for Losertan Thiocolchicoside
method was found linearity over the range of 20-80ppm of the target concentration for both
the drugs. The analytical passed both robustness and ruggedness tests. On both cases, relative
standard deviation was well satisfactory.
REFERENCE
1. Dnyansing K. Rajput,1 Atul A. Shirkhedkar,2 Jyoti K. Rajput,2 Harun M. Patel,2 And
Sanjay J. Surana3Stability Studies Of Thiocolchicoside In Bulk And Capsules Using
RP-HPTLC/Densitometryjournal Of Analytical Methods In Chemistryvolume 2013 (2013),
Article ID 142628, 7 Pages.
2. M. T. Harde*, S. B. Jadhav, D. L. Dharam, P. D. Chaudhari Development And Validation
Of UV-Visible Spectrophotometric Methods For Simultaneous Estimation Of
Thiocolchicoside And Dexketoprofen In Bulk And Tablet Dosage Form IJPSDR
April-June., 2012; 4(2): 160-163.
3. Thankappan, Surya; Parmar, Ashok; Sailor, Bhavika; Vekariya, Kinjal; Khasia, Vasant
Development And Validation Of Spectroscopic Method For Simultaneous Estimation Of
Etodolac And Thiocolchicoside In Tablet Formulation. Journal Of Pharmacy Research.,
2012; 5(6): 3004-3007. 4p. 2 Diagrams, 5 Charts, 3 Graphs.
4. Fang Zhao, Wenhui Zhaoinvestigation On The Micelle-Sensitized Ce (IV) -
Lornoxicam-Rh B Chemiluminescence System And Its Application.
5. Anuradha S Jagtap, Savita S Yadav And Janhavi SIMULTANEOUSDETERMINATION
OF PARACETAMOL AND LORNOXICAM BY RP-HPLC IN BULK AND TABLET
FORMULATION Pharmacie Globale© (IJCP), Vol. 02, Issue 09
6. M. T. Harde*, D. L. Dharam, S. B. Jadhav, A. R. Balapdevelopment And Validation Of
RP-HPLC Method Forsimultaneous Estimation Of Thiocolchicoside Anddexketoprofen
In Bulk And Tablet Dosage Forminternational Journal Of Pharmtech Research Vol.4,
No.4, Pp 1797-1802,
7. Solanki, B. M.; Jiladia, M. A.; Vidya Sagar, G. DEVELOPMENT AND VALIDATION
OF HPLC METHOD FOR THE ESTIMATION OF LORNOXICAM IN BULK AND
TABLET DOSAGE FORM Pharma Science Monitor . Nov2012 Supply2, Vol. 3
Issue 4, P2454-2462. 9p.
8. Harde, Minal; Dharam, Deepali; Jadhav, Shailaja; Chaudhari, Praveen; Balap, Aishwarya
9. V.V. Chopade*1 And P.D. Chaudhari 2 DEVELOPMENT AND VALIDATION OF
STABILITY INDICATING RP-HPLC ASSAY METHOD FOR DETERMINATION OF
LORNOXICAM IN SELF EMULSIFYING DRUG DELIVERY SYSTEM (SEDDS)
FORMULATION IJPSR., 2014; 5(5).
10.Palak R. Pate L Spectrophotometric Determination Of Eperisonehydrochloride And
Lornoxicam In Synthetic Mixtureinternational Journal Of Pharmtech Researchcoden
(USA): IJPRIF ISSN : 0974-4304Vol.5, No.2,
11.M.S.Kondawar, R.R.Shah J.J.Waghmare, N.D.Shah M.K.Malusareuv Spectrophotometric
Estimation Ofparacetamol And Lornoxicam In Bulk Drugand Tablet Dosage Form Using
Multi-Wavelength Methodinternational Journal Of Pharmtech Researchcoden (USA):
IJPRIF ISSN : 0974-4304Vol.3, No.3, Pp1603-1608, July-Sept 2011
12.12. Madhusmita Sahoo, Pratima Syal, Asawaree A. Hable, Rahul P. Raut, Vishnu P.
Choudhari, Bhanudas S. Kuchekar Development And Validation Of A HPTLC Method
For Simultaneous Estimation Of Lornoxicam And Thiocolchicoside In Combined Dosage
Form Volume 2, Issue 3, July–September 2011,
13.FIROZ KHAN*, ANIL BHANDARI, BALRAM SONI, SANJAY SHARMA
DEVELOPMENT AND VALIDATION OF LORNOXICAM BY SECOND ORDER
DERIVATIVE SPECTROSCOPY Faculty Of Pharmaceutical Sciences, Jodhpur National