ISSN: 2320-4850 [32] CODEN (USA): AJPRHS
Open
Access Available online at http://ajprd.com/index.php Research Article
DEVELOPMENT AND CHARACTERIZATION OF
FENOFIBRATE TABLET BY COMPARING TWO
DIFFERENT SOLUBILITY AND DISSOLUTION
ENHANCEMENT METHODS
Kaur Beerpal*, Dua J.S, Prasad D.
NShivalik College of Pharmacy, Nangal, Punjab, India.
ABSTRACT
Fenofibrate is a drug included in BCS class II category, generally used to reduce cholesterol level in patient having a risk of cardiovascular disease. The main aim of this research was to ameliorate solubility and dissolution profile of Fenofibrate with comparison between two different methods i.e. Solid dispersion and liquisolid technique. In liquisolid system, a dry freely flowing and compressible powder mixture was obtained which absorb drug solution or suspension in non-volatile solvent. While in case of solid dispersion drug was dispersed with suitable hydrophillic carrier with or without volatile solvent to get powder material. Two formulations of Fenofibrate solid dispersion were prepared by solvent evaporation method using β-CD as a hydrophillic carrier with ratios 1:1 and 1:3. In case of liquisolid technique, two liquisolid compacts were prepared with ‘R’ value 20:1 and 40:1 using Avicel PH 102 as a carrier and Aerosil 200 as a coating material. All the formulations were characterized by FTIR, DSC and solubility studies. Precompression studies of all the batches were done by determining angle of repose (25.100- 35.020), bulk density (0.51- 0.56 g/ml), tapped density (0.60-0.66 g/ml), carr’s index (15.61-19.03%) and hausner’s ratio (1.13-1.25). Post compression evaluation was done by checking hardness (4-5 kg/cm2
), thickness (3.56-4.01mm), friability (0.54-0.75%), disintegration time (3.50-5.56min), drug content (80.34-95.05%) and in-vitro drug release (81.55-92.93%). Out of all the four batches SD2 batch that was prepared by solid dispersion showed an excellent result by releasing drug at 96.91 %.
Key words- Fenofibrate, Solid dispersion, Liquisolid compact, Avicel PH 102, Aerosil 200.
Article Info:Received: 01 Sept, 2018; Review Completed: 13 Oct, 2018; Accepted: 15 Oct, 2018; Available online: 20 Oct,2018
Cite this article as:
Kaur Beerpal*, Dua J.S, Prasad D.N, Development And Characterization of Fenofibrate Tablet by Comparing Two Different Solubility and Dissolution Enhancement Methods, Asian Journal of Pharmaceutical research and Development.2018;6 (5): 32-40
DOI:
http://dx.doi.org/10.22270/ajprd.v6i5.423*Address for Correspondence
BeerpalKaur, ShivalikCollege of Pharmacy, Nangal, Punjab, India
INTRODUCTION
enofibrate is an anti-hyperlipidemic drug that belongs to fibrate class. It helps to reduce elevated plasma concentration of triglycerides and LDL. Generally, it is more effective drug as compare to other fibrates. Fenofibrate is included in BCS Class II drugs (poor solubility and high permeability) resulting it shows low bioavailability.(1) Aqueous solubility of any therapeutically active moiety is an important factor to achieve good bioavailability. Nearly 40% of the APIs are poor water-soluble and shows lesser dissolution rate. Over the few decades, the major challenge for poorly water-soluble drug is to improve its solubility profile. Solubility and dissolution both are rate-limiting step for these categories of drug. Once the solubility problem get
solved dissolution rate of drug automatically get improves.(2, 3) Now a day, numerous techniques have
been utilized to improve dissolution rate in turn bioavailability of BCS class II drugs includes micronization, nanosuspension, microemulsion, complexation, hydrotrophy, co-solvency etc.(4) The main objective of present research work was to compare two formulation techniques. Solid dispersion and liquisolid technology were choosing to compare because both of these methods are simple and easy for preparation and having ease of optimization. Fenofibrate tablet was formulated and evaluated using these methods.
Solid dispersion is refers to technique of dispersion of one or more active ingredient in an inert carrier with suitable volatile solvent to get solid powder which helps to enhance dissolution rate of poorly soluble drugs.5 Solid dispersion classified into two types, first is based on, carrier used in solid dispersion, which have three
Asian Journal of Pharmaceutical Research
and Development
(An International Peer-Reviewed Journal of Pharmaceutical Research and Development)
© 2013-18, publisher and licensee AJPRD, This is an Open Access article which permits unrestricted non-commercial use, provided the original work is properly cited
F
ISSN: 2320-4850 [33] CODEN (USA): AJPRHS types of generations. Second is based on, molecular
arrangement, four different types of solid dispersion are eutectics, amorphous precipitation in crystalline matrix, solid solutions and glass solution or suspensions. As discuss earlier BCS class II drugs are used as an ideal drug candidate for solid dispersion. Various carriers has been used for solid dispersion preparation by considering various factors like carrier should be pharmacologically inert, non-toxic to drug, should be thermostable, chemically compatible with drug and should be freely water soluble with intrinsic rapid dissolution properties. Mainly four methods are used most commonly for preparations of solid dispersion are, fusion method, melt extrusion method, solvent evaporation and melting solvent method.(6-8) In the present research work we used solvent evaporation method for preparation of solid dispersion.
Liquisolid technique, is also known as powder solution technology, liquisolid compact and liquisolid system.9 Liquisolid technology is a powdered form of liquid medication formulated from liquid drug solution or suspension of water insoluble drug in suitable quantity of nonvolatile solvent system. Further calculated ratios of carrier and coating material was added to get a dry, free flowing and non-adherent powder used as a compact. Disintegrants was added for immediate release.(10,11) Additionally, the term liquid medication used for Liquisolid system, liquisolid medication does not only refer for drug solution. Based on of type of liquid medication liquisolid system classified into three classes are powder drug solution (e.g. prednisolon solution in polyethylene glycol), powder drug suspension (e.g. gemfibrozil suspension in polysorbate) and powder liquid drugs (e.g. liquid vitamin, clofibrate, valproic acid etc). Based on formulation used liquisolid technology classified into two categories are liquisolid compact and liquisolid micro system. Liquisolid systems give its mechanism of action, by increase aqueous solubility and surface area of drug that available for release and improve wetting property of drug candidate.(12-14)
MATERIAL AND METHOD USED
Fenofibrate was as a gift sample from IOL chemical Baddi (India), β-CD, PEG 400 and methanol (HiMedia Lab. Pvt. Ltd, Mumbai), Avicel PH 102 and sodium starch glycolate (Loba Chemie Pvt. Ltd, Mumbai), Aerosil 200 (Merk Specialities Pvt. Ltd). All other chemicals and reagents used were of laboratory grades. Digital balance (Danwer scales), UV Spectrophotometer (Shimadzu 1800, Kyoto, Japan), tray dryer and flask shaker (Swastica electric & scientific work, Ambala), FT-IR (Perkin Elmer 1600,USA), DSC (DSC821 Mettler Toledo DSC), Disintegration and dissolution apparatus (Kshitij innovation), Tablet punching machine (Cadmach Ahmadabad).
METHOD
Saturation solubility studies
Saturation solubility is the extent of solubility of the drug beyond which addition of any solute in an excess amount at constant amount. The solubility study of Fenofibrate carried out in different solvents and buffers. The excess amount of drug (50mg) added to screw capped conical flasks containing 25ml of solvents. The conical flasks kept in water bath shaker at 250C and
shaken for 24hrs until the equilibrium was attain.15 Solvent use for saturation solubility studies were distilled water, chloroform, methanol, 0.1 N HCl (1.2), Phosphate buffer saline (6.8, 7.4) and PEG 400. The solutions were filter through 0.2μm membrane filter and absorbance was measure at 286nm using UV spectrophotometer (Shimadzu 1800, Kyoto, Japan). Results of solubility of Fenofibrate in different solvents is given in table no-3
PREPARATION OF FENOFIBRATE SOLID DISPERSION TABLET
Fenofibrate solid dispersion was prepared by solvent evaporation method using β-CD as a carrier in proportions 1:1 and 1:3. The drug and carrier was dissolved with chloroform in china dish. The mixture was heated on water bath with continous stirring until the solvent was evaporated completely. Solid dispersion was scrapped out with spatula. Solid dispersions were pulverized in mortar pestle after drying and passed through sieve before pack in an airtight container16. After that, for the preparation of tablet the amount of prepared solid dispersions equivalent to 40mg of fenofibrate was weigh and mixed with directly compressible diluents (Mannitol), binder (MCC), superdisintegrant (Sodium starch glycolate), lubricant (Magnesium stearate), glidant (Talc) were passed through sieve. All the material were mixed and blended properly. Tablet compression was performed on single tablet punching machine. Formula for preparation of Fenofibrate solid dispersion tablet given below.
Table: 1 List of ingredients for preparation of Fenofibrate solid dispersion tablet
INGRIDIENTS SD1(1:1)
(mg)
SD2 (1:3)
(mg)
Fenofibrate 40 40
β-CD 40 120
MCC 60 60
Mannitol 170 90
Sodium starch
glycolate
20 20
Magnesium stearate 10 10
Talc 10 10
PROCEDURE FOR PREPARATION OF FENOFIBRATE LIQUISOLID TABLET
Mathematical model for design of liquisolid compact
Liquisolid compacts were formulated based on, mathematical model. Avicel PH 102 was selected as a carrier, Aerosil 200 as a coating material and PEG 400 as non-volatile solvent. To attain solubility of Fenofibrate, drug: PEG 400 (1:1) was taken. The carrier and coating ratio was calculated using equation
R= Q/q……….………1.1
Where R is excipients ratio,
q is weight of carrier material,
ISSN: 2320-4850 [34] CODEN (USA): AJPRHS Liquid load factor (Lf) is defined as the ratio of liquid
medication to the weight of carrier powder (q) which is required for acceptable flow and compressible liquisolid system.
Lf = W/Q………1.2 Flowable liquid retention potential (Φ value) of powder excipient generally used to calculate the requirement quantity of ingredients. This can be express in a relationship.
Lf = Φca + Φco (1/R)………….……….1.3
Φca and Φco are the Φ value of carrier and coating material. With the help of above, equations of mathematical model of liquisolid compact was formulated (13-14).
Preparation of Fenofibrate Liquisolid tablet
Calculated quantities of Fenofibrate and PEG 400 was accurately weighed and dispersed in glass beaker and heated on hot plate above 500C with continous stirring until clear solution was obtained, this clear solution known to be liquid medication. Then calculated quantity of R value i.e. 20:1 and 40:1 was added to liquid medicament under continous mixing in mortar. The powder admixture was spreaded on the surface of mortar. After few minutes, powder was scrapped off with spatula. Now, sodium starch glycolate was added to it for immediate release of drug (1, 17). For the compression of tablet, prepared liquisolid compact was mixed with directly compressible mannitol, magnesium stearate and talc in mortar and pestle. The mixtures were mixed well, blend and passed through sieve. Compression was performed on single tablet punching machine. The formula for preparation of liquisolid compact given below in table-2
Table-2 List of ingredients used in Fenofibrate liquisolid compact
INGREDIENTS LSC1
(mg)
LSC2 (mg)
R value 20:1 40:1
Drug 40 40
PEG 40 40 40
Lf 0.181 0.166
Avicel PH 200 220 240
Aerosil 102 11 6
Sodium starch glycolate 17 14
EVALUATION OF SOLID DISPERSION AND LIQUISOLID COMPACT
FTIR Analysis (17)
Fourier transform infrared spectra (FTIR) of totally moisture free powdered samples were crushed and mixed well with sample: KBr (1:100). The samples (Pure drug, SD1, SD2, LSC1 and LSC2) were scanned within range of 4000-400cm-1 using Perkin Elmer 1600, USA. FTIR spectra of Fenofibrate solid dispersions and liquisolid compacts given in figure 5-9.
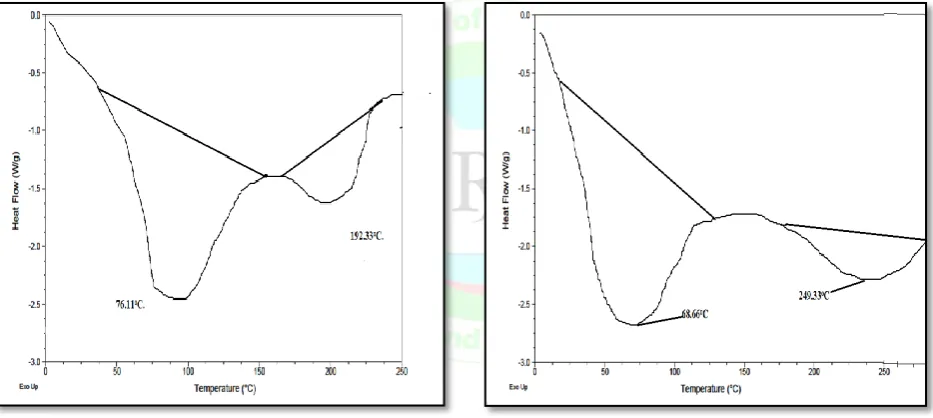
DSC (1, 18)
Differential scanning calorimetry thermal analysis was performed on DSC821 (Mettler Toledo DSC) to check thermotropic properties of all the batches and pure Fenofibrate drug as well. One by one all the samples (2-5mg) were weighed and were placed in aluminum coated pans. An empty aluminium pan was used as blank. DSC of all the samples were scanned from 200C-3000C. DSC of Fenofibrate and all the four samples given in figure 10-15.
Percentage Yield (18)
Percentage yield of prepared solid dispersions and liquisolid compacts were calculated by using following formula i.e.
% yield = 𝐩𝐫𝐚𝐜𝐭𝐢𝐜𝐚𝐥 𝐦𝐚𝐬𝐬 𝐭𝐡𝐞𝐨𝐫𝐞𝐭𝐢𝐜𝐚𝐥 𝐦𝐚𝐬𝐬 X 100
PRECOMPRESSION EVALUATION
Angle of repose
Angle of repose is maximum angle possible between the surface of pile of powder with horizontal axis. The blend was poured in the funnel that was allow to fall freely until all the blend was passed through and cone shaped heap was formed. The diameter of the blend and height were measured accurately. It is the most common and easy parameter to measure flow property of powder was calculated by following formula.
Tanθ = h/r or tan-1= h/r
Where, h is the height of heap
r is radious of heap
Bulk Density
Accurately weighed (2gm) pre-compressed powder was transfered into 50ml measuring cylinder of bulk density apparatus for the measurement of bulk volume (Vb) of powder. Bulk density was expressed in g/ml. Formula to measure bulk density is given below.
Bulk density (Vb) = Wt of powder/ Volume of bulk powder
Tapped Density
After measurement of bulk density the measuring cylinder was tapped for fixed time period, from this the remaining shifted volume was measured in measuring cylinder that was tapped volume of powder. Formula to measure true or tapped volume is given as
Tapped density = mass of powder / tapped volume (Vt)
Carr’s index and Hausner’s ratio
To measure the powder flow by Carr’s index and hausner’s ratio the following formulas were used. Carr’s index = Tapped density- bulk density/ tapped density X 100
Hausner’s ratio = Tapped density/ bulk density
All the pre-compression results shown in table-5
POST COMPRESSION EVALUATION (16, 18)
ISSN: 2320-4850 [35] CODEN (USA): AJPRHS General appearance of tablets was checked by consider
tablet surface and colour uniformity.
Weight variation
Twenty tablets from each formulation were randomly selected and weighed. Average value was calculated. Results shown in table-6. Weight variation of all the formulations was found out using following formula.
%weight variation = Individual weight – Average weight Average weight X 100
Hardness and Thickness
Hardness of each tablet was measured using Monsanto hardness tester and expressed in Kg/cm2. Thickness of tablet was measured with the help of Vernier caliper and expressed in millimeters. Values of hardness and thickness of all the batches given in table no- 6
Friability
The friability test of all batches was done on Roche friabilator. Twenty tablets were randomly selected from each formulation were weighed and transferred to friabilator. The friabilator was operated for 4 minutes at 25 rpm (i.e.100rpm). Tablets were again weighed. Calculated values given in table no-6. The results of friability was checked by using formula given as
% Friability =𝐥𝐨𝐬𝐬 𝐢𝐧 𝐰𝐞𝐢𝐠𝐡𝐭 𝐨𝐟 𝐭𝐚𝐛𝐥𝐞𝐭 𝐢𝐧𝐢𝐭𝐢𝐚𝐥 𝐰𝐞𝐢𝐠𝐡𝐭 𝐨𝐟 𝐭𝐚𝐛𝐥𝐞𝐭 X 100
Drug content uniformity
Six tablets were randomly selected and crushed well. Powder equivalent to dose of Fenofibrate was dissolved in chloroform. Solution was filtered and diluted. The filter was analysed using UV spectrophotometer (Shimadzu 1800 Kyoto, Japan) at 286nm. The readings of drug content given in table no-6.
Disintegration test
Disintegration test was performed using Kshitij innovation tablet disintegrating apparatus in 6.8 PBS at temperature 37±0.50C. Place one tablet in every tubes
and add supporting disc over each tube and disintegration test assembly was raised up and down between 30cycles maintained at 37±0.50C. The tablets were considered totally disintegrated when there is no residue remains consisting of soft mass in all the tubes. Disintegration time was noticed and given on table no-6
In-vitro drug release studies
An in-vitro dissolution studies were performed with USP dissolution apparatus (Basket type) Kshitij innovation. 900ml Phosphate buffer 6.8 was used as dissolution media with constant 50 rpm speed at 37±0.50C. 5ml of dissolution samples were withdrawn and replaced with fresh sample of PBS 6.8 at every time interval of 10,20,30,40,50, and 60. The filtered sample was analysed using U.V. Spectrophotometer (Shimadzu 1800, Kyoto, Japan) at 286nm. The in-vitro drug release data given in table no 7.
RESULTS
Physical Appearance
In the general physical appearance examination tablets of all the batches was free from cracks, pinholes. The colour and surface was uniform on whole surface.
SOLUBILITY STUDIES
Table: 3 Solubility studies of Fenofibrate in different solvents.
S No Solvents Solubility (mg/ml)
1 Distilled water 0.004±0.02
2 Chloroform 0.045±0.03
3 Methanol 0.022±0.02
4 0.1N HCl (1.2) 0.039±0.04
5 PBS (6.8) 0.046±0.03
6 PBS (7.4) 0.049±0.02
7 PEG 400 0.261±0.04
Figure: 1 and 2 Prepared Fenofibrate solid dispersion (1:1 and 1:3 respectively)
ISSN: 2320-4850 [36] CODEN (USA): AJPRHS
Figure- 3 and 4 Prepared Fenofibrate Liquisolid compacts (20:1 and 40:1respectively)
FTIR Spectra
FTIR of pure Fenofibrate reveals the characteristics peaks of pure Fenofibrate drug which expressed C-H bond sharp peak at 2934cm-1, Strong peak of carbonyl
group at1729cm-1and 1651cm-1, medium peak of C-H stretching, 1087cm-1, Sharp peak of aromatic ring of 859cm-1, Sharp and strong peak of C-Cl at 764cm-1. FTIR spectra Fenofibrate given in figure -5 and FTIR of all the batches given in figure- 6 to9 .
Figure: 5 FTIR of Pure Fenofibrate.
ISSN: 2320-4850 [37] CODEN (USA): AJPRHS Figure: 7 FTIR of Solid dispersion SD2 batch (Fenofibrate : β-CD, 1:3).
Figure: 8 FTIR of liquisolid compact batch LSC1 (Carrier: coating, 20:1).
Figure: 9 FTIR of liquisolid compact batch LSC2 (carrier: coating, 40:1).
FTIR spectra of SD1, SD2, LSC1 and LSC2 show all characteristics peaks of Fenofibrate with their respective ingredients used that means that solid dispersion and
ISSN: 2320-4850 [38] CODEN (USA): AJPRHS Differential Scanning Colorimetry (DSC) Studies
DSC studies of pure Fenofibrate drug and all the batches were done successfully on (DSC821 Mettler Toledo). DSC of pure Fenofibrate shown its melting peak at 800C
shown in figure no-10. DSC of all the batches (SD1, SD2, LSC1 and LSC2) shows their characteristics broad peak that shifts toward left side, melting points of Fenofibrate with their respective excipients given in figure no- 10-14.
Figure: 10 DSC of Pure Fenofibrate. Figure: 11 DSC of solid dispersion SD1 drug: β-CD (1:1)
Figure- 12 DSC of solid dispersion SD2 drug: β-CD (1:3) Figure: 13 DSC of Liquisolid compact LSC1 (20:1)
Percentage Yield
Percentage yield of all the batches given in table no- 4 . All the batches shows good yield as required.
Table-4 Percentage yield of all the batches.
Batches Percentage yield (%)
SD1 92.47
SD2 95.96
LSC1 93.15
LSC2 90.56
ISSN: 2320-4850 [39] CODEN (USA): AJPRHS Table:5 Results of pre-compression parameters of all batches.
Post compression evaluation
Table: 6 Results of post-compression of all the formulations.
Batches Thickness (mm) Hardness Kg/cm2
Friability(%) Drug content (%)
Disintegration time (minutes)
SD1 3.56 5 0.59 91.88 4.12
SD2 3.99 4 0.54 95.05 3.50
LSC1 3.82 4 0.75 84.86 4.53
LSC2 4.01 5 0.69 80.34 5.56
In-vitro drug release studies
Table:7 In-vitro drug release of all the formulations.
Batches
Time (min)
Cumulative % drug release
SD1 SD2 LSC1 LSC2
0 0 0 0 0
10 32.23 35.52 25.92 22.38
20 45.46 47.55 39.89 36.22
30 57.48 62.13 53.28 43.94
40 69.81 77.62 60.39 56.71
50 75.96 84.69 78.56 69.58
60 89.51 92.93 85.91 81.55
CONCLUSION
From the study, we can conclude that solid dispersion and liquisolid compact of Fenofibrate tablet were formulated and evaluated successfully. FTIR shows all the characteristics peaks of Fenofibrate with their respective ingredients. DSC thermograms of all the batches indicates the compatibility of drug with excipient by showing broad endothermic peak of Fenofibrate with their respective excipients that slightly shifts towards left side. In-vitro drug release data of SD1(89.51%), SD2(92.93%), LSC1(85.91%), LSC2
(81.55%) showed within 60 minutes. From the in-vitro
drug release data we can conclude that SD2 batch prepared by solid dispersion with drug: polymers (1:3) of was the best batch and method for the amelioration of solubility and dissolution profile of Fenofibrate drug.
ACKNOWLEDGMENT
We are thankful to the management team of Shivalik College of Pharmacy, Nangal for providing us infrastructure. We also faculty members for their unbeatable response for guiding in this research work
REFERENCES
1. Karmarkar AB, Gonjari ID, Hosmani AH, Dhabale PN, Bhise SB. Dissolution rate enhancement of Fenofibrate using liquisolid tablet technique. Latin American Journal of Pharmacy. 2009; 28(2): 219-225.
2. Straub JA, Tessier T, Bernsterin H. Effect of powder processing or performance of fenofibrate formulation. European Journal of Pharmaceutics and Biopharmaceutics . 2008; 69: 727-734.
3. Jamakandi VG, Kerur SS, Patil US. Formulation and evaluation of immediate release tablet of Carvedilol using liquisolid compacts techniques for solubility enhancement. Asian Journal of Pharmaceutics . 2016; 10(3): S324-S332.
4. Parve B, Shinde P, Rawat S, Rathod S, Waghmode G. Solubility enhancement techniques: A review. World Journal of Pharmacy and Pharmaceutical Sciences . 2014; 3(7): 400-422.
5. Khushwaha A. Solid dispersion- A promising novel approach for improving the solubility of poorly soluble drugs. International journal of pharmaceutical sciences and research. 2011; 2(8): 2021-2031.
6. Manogna K, Nagveni P, Thyagaraju K. Enhancement of solubility of poorly soluble drugs by solid dispersion : An overview. Indian Journal of Pharmacy and Biological Research. 2017; 5(4): 17-23.
7. Singh J, Walia M, Harikumar S.L. Solubility enhancement by solid dispersion method: A review. Journal of drug delivery and therapeutics. 2013; 3(5): 148-155.
Batches Angle of repose (0) Bulk density (g/ml)
Tapped density (g/ml)
Carr’s index (%) Hausner’s ratio
SD1 28.57 0.53 0.60 19.03 1.15
SD2 25.10 0.51 0.65 16.94 1.13
LSC1 35.02 0.56 0.64 15.61 1.18
ISSN: 2320-4850 [40] CODEN (USA): AJPRHS 8. Mehta S, Joseph N.M, Sahle F.F, Palani S. Improving solubility
of BCS class II drugs using solid dispersion: A review. Journal of drug delivery and therapeutics. 2014; 4(3): 7-13.
9. Kulkarni A.S, Aloorkar N.H, Mane M.S, Gaja J.B. Liquisolid system : A review. International Journal of Pharmaceutical Science and Nanotechnology. 2010; 3(1): 795-802.
10. Abhilasha, Bhagchand. Liquisolid technique: An overview on enhanced solubility and bioavailability. World Journal of Pharmaceutical Research. 2017; 6(8): 636-649.
11. Javadzadeh Y, Navimipour B, Nokhodchi A. Liquisolid technique for dissolution rate enhancement of high dose water insoluble drug (Cabamazepine). International journal of pharmaceutics. 2007; 341: 26-34.
12. Patel U.S, Patel K.C. Liquisolid technique for poorly soluble drugs. Journal of Scientific and Industrial Research. 2013; 2(1): 145-159.
13. Pawar J.D, Jagtap R.S, Doijad R.C, Pol S.V, Desai J.R, Jadhav V.V, Jagtap, S.R. Liquisolid compact: A promising approach for solubility enhancement. Journal of Drug Delivery and Therapeutics. 2017; 7(9): 6-11.
14. Vajir S, Sahu V, Ghuge N, Bakde B.V. Effect of dissolution rate by liquisolid compact approach : An overview. International journal of pharmaceutical and chemical sciences. 2012; 1(3): 1013-1018.
15. Banthagaral B, Nama S, Nuthakki S, Katta V.K, Pasumarthi P. Enhancement of dissolution rate of Fenofibrate by using various solid dispersion techniques. World Journal of Pharmacy and Pharmaceutical Sciences. 2014; 3(3): 914-932.
16. Kothapally S, Bada P.K, G Harish. Formulation and evaluation of Fenofibrate tablet prepared by employing bioavailability enhancement technique. International Journal of Research in Pharmacy and Biotechnology. 2013; 1(5): 602-608.
17. Chella N, Shastri N, Ram Rao T. Use of liquisolid compact technique for improvement of the dissolution rate of Valsaratan. Acta Pharmaceutica Sinica B. 2012; 2(5): 502-508.