Procedia Computer Science 96 ( 2016 ) 90 – 99
1877-0509 © 2016 The Authors. Published by Elsevier B.V. This is an open access article under the CC BY-NC-ND license (http://creativecommons.org/licenses/by-nc-nd/4.0/).
Peer-review under responsibility of KES International doi: 10.1016/j.procs.2016.08.103
ScienceDirect
20th International Conference on Knowledge Based and Intelligent Information and Engineering
Systems
Community detection by consensus genetic-based algorithm for
directed networks
Stefano B. B. R. P. Mathias
a, Val´erio Rosset
a, Mari´a C. V. Nascimento
a,∗aInstituto de Ciˆencia e Tecnologia, Universidade Federal de S˜ao Paulo (UNIFESP)
Av. Cesare M. G. Lattes, 1201, Eugˆenio de Mello, S˜ao Jos´e dos Campos-SP, CEP: 12247-014, Brasil
Abstract
Finding communities in networks is a commonly used form of network analysis. There is a myriad of community detection algorithms in the literature to perform this task. In spite of that, the number of community detection algorithms in directed networks is much lower than in undirected networks. However, evaluation measures to estimate the quality of communities in undirected networks nowadays have its adaptation to directed networks as, for example, the well-known modularity measure. This paper introduces a genetic-based consensus clustering to detect communities in directed networks with the directed modularity as the fitness function. Consensus strategies involve combining computational models to improve the quality of solutions generated by a single model. The reason behind the development of a consensus strategy relies on the fact that recent studies indicate that the modularity may fail in detecting expected clusterings. Computational experiments with artificial LFR networks show that the proposed method was very competitive in comparison to existing strategies in the literature.
c
2016 The Authors. Published by Elsevier B.V. Peer-review under responsibility of KES International.
Keywords: genetic algorithms; consensus clustering; modularity; directed networks.
1. Introduction
Many elements in our daily life such as the internet, the transportation systems, the city mapping, among others, can be represented as relational structures. Graphs or networks are among the many forms to represents such data. Extracting relevant information from networks is of utmost importance and, for this, there are specific tools. The identification of patterns in the data may enable the adequate analysis of these graphs. In this sense, if the graph topology characterizes a clustering tendency, there exists a number of works that attempt to identify groups of highly related vertices (communities). Finding communities (also known as clusters) in networks allows a different type of inference with regard to the information about the elements of the groups instead of the individual elements. Examples of graphs with these characteristics are those represented by a social network data, such as the widely known online social network, thefacebook.
∗Corresponding author.
E-mail address:[email protected].
© 2016 The Authors. Published by Elsevier B.V. This is an open access article under the CC BY-NC-ND license (http://creativecommons.org/licenses/by-nc-nd/4.0/).
Finding groups of vertices in a graph is known in the literature as the graph clustering problem or community detection in networks. This problem has been investigated for decades and currently there are several approaches to solving it. Among them, we can highlight those that optimize assessment measures which classify the quality of the solutions found in1,2,3. Most of the problems of finding the communities that optimize quality measures is
NP-complete4. Consequently, the heuristics are the most explored methods for this problem, due to the sizes of the networks that represent most of the applications. In particular, to address this problem in directed networks remains a challenge due to the few existing algorithms that take the arcs directions into account. It is considerably difficult to define a consistent measure for evaluating the quality of the communities in directed networks. However, some assessment measures, as the modularity in directed networks5and themap equationproposed in2, attempt to evaluate
the quality of communities considering the asymmetric relations in the networks.
This paper presents a novel strategy for detecting communities in directed networks through a consensus genetic-based algorithm. As the modularity poses as a good measure despite the resolution limit drawback, the consensus strategy has this measure as objective function (or fitness function). The resolution limit in the modularity refers to the size of the clusters and the number of arcs in the networks. For networks with small-sized communities, the modularity maximization-based algorithms may not correctly identify the groups6. An advantage of developing a
consensus-based strategy is that it enables the search for partitions with different traits than those found in algorithms that specifically maximize this measure.
Computational experiments carried out using artificial and real networks indicate a very good potential of the proposed strategy. The combination of a consensus strategy considering a fine tuning of the resolution parameter and the evolutionary traits found in genetic algorithms contributed in the robustness of the proposed strategy. The results achieved by the consensus genetic-based algorithms outperformed heuristics widely employed found in the literature.
2. Community detection in directed networks
A simple digraph, oriented graph, can be defined by a tupleD=(V(D),A(D)), in whichV(D) represents its set of vertices andA(D), its set of arcs. In this study, the notations of the sets of vertices and arcs will be simplified toVand A, respectively. The setVhas its elements represented by the numbers belonging to the set of integers{1,2,3, ...,|V|}. The numbers of vertices and arcs in a digraph are represented by, respectively,nandm. Moreover, each element of the set of arcsAis a tuple (i,j), beingithe end corresponding to the source of the arc and j, the terminal vertex of the arc. In this case, we say that the verticesiandjare adjacent and that arc (i,j) is different from arc (j,i). The number of times a vertexiis a source vertex defines the out-degree of a node (di+) whereas the number of times it is a terminal indicates the in-degree of a nodei(di−). A vertexiis said a neighbor of jif they are adjacent.
Digraphs are structures extensively employed to represent relational data as, e.g., the web links of the internet. In this example, each vertex of the corresponding network refers to the site and the links between a pair of sites can be represented by arcs. The representation of a social network, as, e.g.,twittersocial network, can be performed by asso-ciating each user with a vertex of the graph whereas the arcs may indicate the dominance between the pair of vertices: if there exists an arc (i,j), it means that the individualifollows the individual jinside the social network. Another example is the data that represent a transportation network that can also be represented by a directed graph. For this, simply consider each vertex as a city and the arcs as the streets and roads that connect these cities7. Detecting com-munities in this type of networks is one of the most difficult problems in clustering. Since the arcs do not necessarily possess symmetric relations, the communities may have different interpretations, that may not take into account the reciprocity of the arcs. Consequently, many consolidated formulations and algorithms for detecting communities in undirected networks may not be an option for considering the directed networks. In3, the authors thoroughly discuss
the existing methods for finding clusters in directed networks and mention as a gap in the literature methods specially designed for this type of networks.
In3, the authors propose a categorization of these clustering types into distinct groups. These groups are the
naive transformation approach, the transformations maintaining directionality, the extending objective functions and methodologies for directed networks and the other alternative approaches. For being beyond the scope of this paper to go into detail about all these approaches, we draw the attention to the strategies based on the paradigm of extending methodologies for tackling directed networks, within which the proposed strategy fits.
In line with our proposal, a way to define clustering in directed networks is by assessing the network topology, i.e. the amount of arcs inside cluster must be greater than the number of existing links between the clusters. This
type of approach is used in solving the problem of detecting communities in undirected networks and adapted to identify communities in directed networks. In particular, algorithms based on the directed modularity8,5investigate
exactly this type of communities. A formulation for evaluating the modularity of a vertex partitionπis presented in Equation (1). q(π)= 1 m ∀C∈π i,j∈C (aji− di−d+j m ) (1)
whereCis a community from clusteringπ;ajiis the number of arcs in which jis the source andiis the terminal. Being a well-known measure for undirected graphs, the modularity, when extended to the directed case, explores the quantity of links inside clusters, by taking their directions into account. Therefore, for example, if we consider a vertexiwith a high out-degree and a vertex j, adjacent toi, but with low in-degree, it is more likely that the arc connecting them hasias source and jas terminal. As a result, whether the arc has the opposite direction, it is not as expected as the arc (i,j) and, then, that arc is considered a clustering tendency, having a larger contribution in the modularity value.
To the extent of our knowledge, a few studies and algorithms can be found in the literature specially designed for the modularity maximization problem in directed networks, that isNP-complete4. In5, the authors introduce the
measure and suggest that some of the existing methods for the undirected graphs could be easily adapted in order to address the directed modularity. Nevertheless, some drawbacks, as well as those found for the undirected graph modularity were observed in the equivalent measure for the directed networks. In line with this, other studies that either refine or propose new strategies for assessing the quality of partitions in directed networks are encountered in2.
In this paper, we propose a hybrid method based on two strategies commonly used in data clustering: genetic algorithms (GAs) and consensus clustering methods.
3. Related Works
Genetic algorithms (GAs) have been widely employed to solve a number of combinatorial optimization problems. The primary trait of the GA is the presence of an initial population, a pool of solutions represented by the chro-mosomes, that along the iterationsevolveafter the application of some genetic operators. The two primary genetic operators are thecrossoverand themutation. According to the original version of the method, in the crossover, a pair of solutions (parents) produces anoffspring, providing newgenerationsof solutions. This is the reproductive phase of the method. Both the selection of the individuals to be crossed and the way to perform the crossover vary in its form depending on several factors as the features of the target problem. The mutation is an operator that acts in a rarer fashion and in an unpredicted form to modify the genes of the chromosome, promoting the diversification of the population. To measure the evolution of the population, each individual is evaluated by afitness function, that is expected to be improved on average along the generations.
Shang et al.9 propose a community detection method based on modularity and an improved memetic algorithm, named MIGA. Additionally, MIGA uses the number of community structures as prior information, and a simulated annealing method is applied to every chromosome from the offspring. The individual of MIGA is represented by a vector where each position represents a vertex and its label corresponds to the community to which the vertex belongs. The crossover operator is based on the two-way crossing, and the mutation operator sporadically changes the label of a random position of some individual. The experiments with undirected Lancichinetti-Fortunato-Radicchi (LFR) networks10with 1000 vertices indicate a competitive performance of MIGA with regard to well-known strategies.
However, it must be observed that the Normalized Mutual Information (NMI), that evaluates the proximity of the partitions achieved by MIGA and the expected ones, is very low when the mixing parameter of the networks is higher than or equal to 0.4.
Similar to9, Mu et al.11also propose a memetic algorithm for detecting communities in undirected networks.
Un-like in9, the authors mention the resolution limit drawbacks, the reason behind they employ an approach to which
they had to vary the resolution parameter for defining their fitness function. The individuals have the same represen-tation of the chromosome as in9. The crossover operator was different since it consisted in the one-point crossing
Fig. 1. The CGA flowchart.
were the same in the offspring. According to experiments carried out by the authors using LFR networks, with 1000 vertices, the strategy presents a poor performance when comparing with strategies as Label Propagation (LP)12and Infomap2. The NMI significantly drops on networks with mixing parameter larger than or equal 0.5.
Ma et al.13also introduce a modularity-based memetic algorithm with multi-level learning strategies for community detection in undirected unweighted graphs. The individuals have the same decoding as in9,11. The authors employ a two-way crossover operation, where they randomly choose the labels of the parents to copy to their offspring. The framework has a learning strategy that works as the local search of the memetic algorithm. In experiments with LFR networks with 1000 nodes, the memetic algorithm had a good performance in networks with mixture parameters of 0.7, being very competitive with strategies like Infomap.
4. Consensus Genetic-based Algorithm (CGA)
The main paradigm of consensus clustering relies on the premise that combining models may achieve clusterings not biased by particular objective functions that, as already discussed, may be not reliable in specific case studies14,15.
In line with these concepts, for the production of initial solutions for consensus clustering, it is common to use weak algorithms14,15,16,17. However, these weak algorithms are usually stronger than the heuristics that produces the initial
population of a GA. Additionally, the consensus clustering-based algorithms stand out as a robust solution method for the problems to which they were subjected. Motivated by the diversification of GA and the robustness of the consensus clustering, as an attempt for obtaining good quality results for the problem discussed in this paper, we develop a genetic algorithm based on the concept of consensus clustering.
The proposed algorithm, the consensus genetic-based algorithm (CGA), has virtually all the stages of a conven-tional genetic algorithm. The next section goes into detail on each step of the CGA. Figure 1 displays a flowchart with the main steps of CGA.
4.1. Initial Population
The generation of the initial population in a GA is of profound importance since the characteristics of the initial solutions can affect the quality of the final solution as well as the running time of the algorithm. In both GAs and the consensus clustering, the individuals to be combined must be sufficiently diversified14,15. Therefore, the proposed
strategy, here named CGA, employs fast heuristics to produce the initial population14,15,16,17.
CGA uses three different algorithms for producing the initial population. Even though they are different to each other, all of them have a similar feature: are computationally cheap and their robustness ranges from low to fair. All strategies take into account that the chromosome is an-dimensional vector, where each positioniof this vector indicates the community to which the vertexibelongs.
The first strategy for generating initial solutions is called hereRandomPop and works as follows: a vector of integers of sizenis created. After that, for each position of this vector, we sort an integer between 1 andnthat
indicates which cluster the vertex belongs to. The second algorithm employed to generate the initial population is the algorithmLabel Propagation(LP)12, whose complexity isO(m). The choice for this algorithm was motivated by the
good results achieved by the ensemble learning strategy (this terminology is equivalent to the consensus clustering) proposed in16for tackling undirected networks. A pseudocode of the version of the LP used in this paper is presented
in Algorithm 1. Algorithm 1:LP Data:D,n,sizeLimit Result:Π Π←SingleCluster(n); sizeClusters←1; i←1; repeat iVertex←i modn;
Π[iVertex]=MaxNeighborhoodLabel(D,Π,iVertex);
update(sizeClusters);
bool← {1, if∀j sizeClusters[j]≤sizeLimit; 0, otherwise}; i←i+1; untilbool; Algorithm 2:RandomLP Data:iterations,D Result:Π Π =Random(n); fori=1toiterationsdo iVertex=Sort(1,n); Π[iVertex]=MaxNeighborhoodLabelvertex(D, Π,iVertex); end
The LP algorithm, in its modified form presented in Algorithm 1, starts with three parameters:D, the input digraph, from which we need to detect the communities;n, the number of vertices of this digraph; andsizeLimit, the largest number of member a community can have. Initially, each position of the vectorΠreceives the label regarding a different cluster, through the functionSingleCluster(n). In the second step, each vertexiVertexis analyzed and its label is upgraded by the choice of the label present in the majority of its neighborhood. This information is obtained by the functionMaxNeighborhoodLabel(D,Π,iVertex) in which the digraph and the partition to be updated must be informed as the parameters of the procedure. The stop criterion of the LP is the size limit of the clusters, i.e., the moment the first cluster reaches the maximum limit of the cluster size. We set thesizeLimitvariable to ben/8. As mentioned in12, this algorithm has almost linear speedup. The difference between the original version of the LP and
the one presented here is that the latter considers the size of the clusters for deciding whether an additional iteration will be necessary for the algorithm. The former LP keeps running until either no label is modified or a predetermined number of iterations is achieved.
A version slightly different from theRandomPop, resulting from its hybridization with the LP, is the third strategy for generating initial solutions of the CGA. Algorithm 2 shows a pseudocode of this strategy. The algorithm Ran-domLPstarts by initializing the vector of labels,Π. This vector receives random values ranging from 1 tonin every of its positions. After that, for a number of iterations,iterations, this vector is refined through a strategy that searches for the label present in the majority of the neighbors of some vertex,iVertex, randomly selected in the process. The routineMaxNeighborhoodLabelvertexis responsible for performing such update. The computational complexity of this algorithm isO(n) if the parameteriterationsisO(n). As, in our experiments we set this parameter to a random integer value that falls in the interval [1,n], the running time of this algorithm isO(n).
4.2. Genetic Operators
The two genetic operators used in the proposed strategy, CGA, are the crossover and the mutation. The crossover takes a pair of parents and applies an algorithm based on the so-called one-point crossover. Roughly, according to this strategy, the selected parents for crossover produce their offspring through the crossing of the parents from the point selected for such. Accordingly, considering the chromosome as a vector, the one-point crossover consists in choosing a position of the vector that will be the child and the genes of one of the parents are replicated from the first position of the vector to the selected position. The remainder positions of the vector, from the crossing point until the end of the vector, are occupied by the genes from the corresponding positions from the other parent. Furthermore, we established a minimum percentage of the genes that a member of the offspring must receive from each of its parents. A pseudocode of the crossover strategy is presented in Algorithm 3.
The algorithm has as input parameters the parentsΠ1 andΠ2which were selected through a strategy described in Section 4.3 and the factorγ, which indicates the minimum percentage of the genes of each parent replicated in the offspring. Then, the crossing point,point, will be randomly chosen in the interval [n×γ,n−n×γ]. Then, the child,Πchild, is created through the crossing of the parents limited by the crossing point. The value chosen forγafter preliminary experiments was 0.25. It is easy to attest that this procedure isO(n). For enabling a diversification in the
CGA, the mutation acts by considering a very low percentage of occurrence probability,ρ, in order to avoid getting trapped in local optimum solutions. The mutation in the CGA modifies two positions of the solution vector generated in the corresponding iterations by values picked up at random within the interval [1,n]. The chosen value forρwas 0.01, adjusted after preliminary experiments.
Algorithm 3:Crossover
Data:Π1,Π2,γ
Result:Πchild
point=S ort(γ);
Πchild[1:point]= Π1[1:point]; Πchild[point+1:n]= Π2[point+1:n];
Algorithm 4:Tournament
Data:Pop
Result: winner
chromosomeS et←Random(Pop,3); winner←
arg maxΠ∈chromosomeS etf itness(Π);
Algorithm 5:Substitution
Data:Pop,PopGen,iElitism
Result:PopNextGen i← iElitism× |Pop|/100;
PopNextGen← arg max
S1⊆Pop\|S1|=if itness set
(S1)∪
arg max
S2⊆PopGen\|S2|=|Pop|−i
f itness set(S2);
Bearing in mind this step of the CGA, in the next section we discuss the way that individuals of populations are selected to generate descendants through the crossover.
4.3. Selection Algorithm
In choosing the method for selecting the individuals in the population for crossing them over, we opted for an algorithm that kept elitism controlled. This means that individuals with values of fitness not as high as the fittest individuals could also be present in future generations. To do this, we employed the method of selection known as
tournament. The characteristic of this method is to give an equal chance for individuals of the population to be selected for crossover. The pseudocode of the method of selection of individuals based on tournament strategy is presented in Algorithm 4.
Algorithm 4 has a single input parameter,Pop, that corresponds to the set of individuals in the current popu-lation. In a first stage, the algorithm chooses randomly 3 individuals from this set and store them in the variable chromosomeS et. Then, the return of the algorithm is the winner chromosome, i.e., that with the highest fitness. We used the modularity for directed networks, Equation (1), for measuring the fitness of the population. Consequently, CGA uses an elitist selection method that leads to the next generation the best individuals of the current generation. In line with this, in the next section, we discuss the method for the substitution of the population.
4.4. Substitution Process
The substitution of the current population for defining the individuals of the generations in CGA considers a method that keeps a percentage of individuals found during the current generation and maintain the fittest individuals generated in previous rounds of the algorithm. The choice for this method is due to the study found in18that suggested
the same strategy for tackling a supply chain problem. In Algorithm 5, we summarize a pseudocode of the substitution method that CGA employs.
Algorithm 5 has three parameters: Pop, the current population of solutions (parents); PopGen, the offspring produced during the current generation from the populationPop; andiElitism, that indicates the percentage of indi-viduals of the current population to be kept for the next generation. The first step of the algorithm aims at calculating how many individuals of the populationPopshall be kept for the next generation and stores this value in the variable i. The functionT runcis used to round the percentage to the nearest integer number. The second step of the method consists in composing the new generation of candidates for parents by adding those elite solutions from the current population and the best solutions found in the current generation. In line with this purpose, thef itness setcorresponds to the sum of the fitness function, the modularity in Equation (1), of a set of solutions passed as parameters. The computational complexity of this algorithm is dependent of the sorting algorithm to find the best solutions from the aforementioned sets. Nevertheless, as the size of the population was set to 30, this sorting algorithm did not affect the overall complexity of the proposed algorithm. Therefore, asn>>30, the operations required for calculating the modularity of the partitions, that wasO(m), dominated the worst-case complexity of the algorithm.
5. Computational Experiments
In this paper, we carried out two experiments to attest the quality of the proposed strategy in comparison to some existing algorithms found in the literature. The code was developed in C++language, using data structures and
functions present in the igraph package19. Furthermore, the experiments were run in a Intel(R) Core TM i5-3470
processor CPU 3.20 GHz with 4.0 GB RAM.
The first experiment employed artificial datasets generated by the software introduced in20. The second experiment
used real networks found in the literature. For means of comparison, we compared our results with the results of LP12,
a well known algorithms to detect communities in undirected networks. The goal of this comparison is to show that the algorithm specifically developed for directed networks consistently outperforms this strategy that simply does not consider the arcs in the network, transforming them into undirected edges for the use of the algorithm. Additionally, both experiments show the results of the Infomap algorithm that is a very efficient algorithm for large-scale networks2
reportedly being one of the best for graph clustering. It is guided by the already mentioned map equation function. Similar to CGA, this solution method takes the direction in the networks into account to detect their communities.
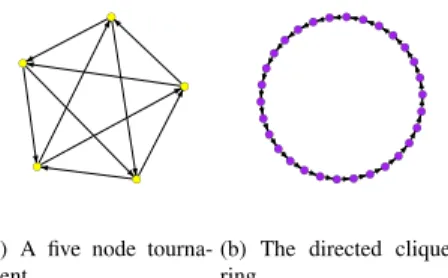
In preliminary experiments, we observed a performance not as satisfactory as we expected in the CGA. After a thorough study investigating the reasons behind this behavior, the reportedly problem of the resolution limit came out6. According to this problem, small-sized clusters in large networks are not detected through community detection algorithms based on the modularity maximization problem. As the results present in the literature are with regard to the resolution limit in undirected networks, here we introduce this drawback for directed networks. For example, Figure 5 displays a ring network of 30 supernodes, in which each tournament1has five vertices as that presented in
Figure 5. l l l l l
(a) A five node tourna-ment. l l l l l l l l l l l l l l lll ll l l l l l l l l l l l
(b) The directed clique ring.
Fig. 2. Example of a directed network on which modularity optimization may fail.
In this case, the (directed) modularity of considering a community as each of the supernodes presented in Figure 5,
π(1), is 0.8757. On the other hand, the (directed) modularity of the partition in which two adjacent supernodes are in
the same cluster, totalizing 15 clusters,π(2), is 0.8878. This second partition obviously is not the expected one, but due
to some resolution limitation in the modularity, if we rely on a modularity maximization-based algorithm, it is better evaluated than the intuitive clustering. For this reason, a reformulation in modularity by considering a parameterλin the expected number of arcs between vertices inside communities will suitably consider the resolution of the clusters.
qλ(π)= m1 ∀C∈π i,j∈C (aji−λ d−id+j m ) (2)
According to Equation (2),qλ(π(1)) > qλ(π(2)), ifλ ≥ 1.3636. For automatically adjusting this parameterλ, we
employed a study found in the literature that introduces a neural network for providing the most suitableλwith regard to the graph topology21. Let CGA
λ be this version of CGA whose fitness function is guided by the version of the
directed modularity measure, andλadjusted according to21.
5.1. Experiment I
Every network generated for this experiment possessed 1000 vertices and the mixing parameter,μ, (the parameter for defining the connectivity inter-communities) falls in the set{0,1; 0,2;. . .; 0,8}. For this experiment, 10 replications
of a same type of network were produced. The assessment of the solutions took the real partitions and the modularity in directed networks into account. Moreover, we analyse the average values achieved for the networks with the same mixing parameter (μ) and of the Normalized Mutual Information (NMI) between the real partitions and the partitions found by the algorithms. The NMI gives the closeness between such clusterings. The higher its value, the closer the partitions are. Additionally, we report in this paper the mean time (MT) of each algorithm used in this experiment.
Table 1. Table of results.
μ CGA CGAλ LP Infomap
NMI MT NMI MT NMI MT NMI MT
0.1 0.993964 3.7500 1.000000 2.9142 0.950163 0.0851 0.982143 0.0000 0.2 0.990911 3.7878 0.999931 2.8444 0.908189 0.0843 0.984572 0.0000 0.3 0.987202 3.6791 1.000000 2.7605 0.841416 0.0833 0.983751 0.0000 0.4 0.982820 3.6445 0.999920 2.6527 0.748496 0.0843 0.986805 0.0000 0.5 0.966592 3.7221 0.995325 2.6065 0.584286 0.0842 0.964491 0.0000 0.6 0.481004 3.8458 0.481751 8.9916 0.336460 0.0839 0.988143 0.0000 0.7 0.261610 4.0874 0.243641 12.3326 0.249762 0.0858 0.0 0.0000 0.8 0.207990 3.9111 0.233690 12.1741 0.212179 0.0851 0.0 0.0000
Table 1 shows the results achieved by the algorithms. It is noteworthy that both solution methods proposed in this paper, CGA and CGAλ, on average, were consistently better than all other algorithms. In particular, CGAλ outperformed the other algorithms in almost all networks tested in this experiment. However, one may observe that the proposed strategies were not able to find better solutions than the Infomap algorithm for the graphs with mixing parameter equals to 0.5. Concerning the modularity values, Table 2 shows the average among the modularity values for the graphs of each mixing parameter.
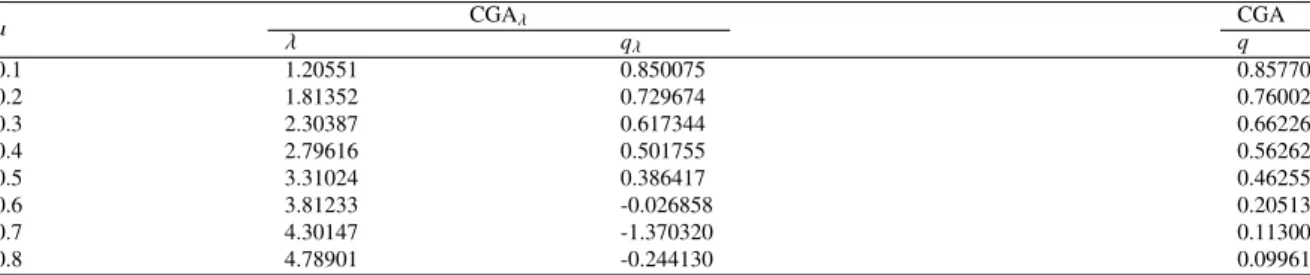
Table 2. Table with the modularity and the adjusted modularity values.
μ CGAλ CGA λ qλ q 0.1 1.20551 0.850075 0.857707 0.2 1.81352 0.729674 0.760028 0.3 2.30387 0.617344 0.662268 0.4 2.79616 0.501755 0.562628 0.5 3.31024 0.386417 0.462550 0.6 3.81233 -0.026858 0.205133 0.7 4.30147 -1.370320 0.113006 0.8 4.78901 -0.244130 0.099613
According to Table 2, there is a clear pattern in the values assigned forλby the algorithm found in21. From the
networks with the lowest mixing parameter to the networks with the highestμ, the values forλare set in increasing order. More interestingly, these values start from approximately 1.2 up to 4.78, differing to each other by a factor between 0.49 to 0.61 for subsequent values forλ.
5.2. Experiment II
This experiment considers 5 real unlabelled networks. All these networks were extracted from the repository avail-able in Vlados’s webpage (http://vlado.fmf.uni-lj.si/pub/networks/data/mix/mixed.htm). To assess the quality of the partitions comparatively, we employ the directed modularity of the communities obtained by the algorithms. Table 3 shows the primary characteristics of the tested networks.
The networkfootballrepresents the relations between the countries that the 1998 FIFA World Cup players have signed a contract and their national association football teams. In this network, each arc represents a soccer player, being the tail the country of his national association team and the head, the nation of the team where the player has signed contract. The networkepapresents a relational representation of a set of web pages found by a search
Table 3. The main characteristics of the networks used in this experiment. Network n m Reference football 35 118 22 epa 4772 8965 23 polblogs 1490 19090 24 galesburg friends 31 78 25 chesapeake 39 177 26
engine linking towww.epa.gov. The networkpolblogsis a representation of connections between blogs of democrats and republicans from the 2004 election. The arcs in this network is the links between the blogs, represented by the vertices of the network. The networkgalesburg friendsrefers to a discussion between physicians regarding a new drug in Galesburg. The networkchesapeakerepresents a predator-prey pairwise relation between species living in the Chesapeake Bay.
Table 4. Directed modularity values and running times of CGA, CGAλLP andInfomapconsidering real unlabeled networks.
Network Mod CGA Time Mod CGAλ Time Mod LP Time Mod Infomap Time
football 0.118041 0.1633 0.120188 0.1638 0.100244 0.0000 0.068658 0.0000
epa 0.489391 24.6562 0.490127 80.1338 0.368710 1.6070 0.476418 0.0000
polblogs 0.392394 0.2685 0.392507 57.0034 0.211945 0.780 0.385240 0.0000
galesburg friends 0.404224 0.1459 0.407922 0.1643 0.348291 0.0000 0.370661 0.0000
chesapeake 0.227777 0.2435 0.225957 0.1794 0.145948 0.0000 0.200071 0.0000
Table 4 reports the directed modularity values and running times of CGA, CGAλ LP andInfomapfor the 5 real networks. The values reported are the average of 5 independent executions since all 4 algorithms are not deterministic. Even though the fitness function of CGAλwas not necessarily the directed modularity, it achieved better results than CGA. Except forchesapeake, CGAλobtained the best values for this metric among the other algorithms. It is worth mentioning that neither LP nor Infomap have as fitness function this quality measure. Nevertheless, modularity is widely employed to assess the quality of partitions and it is expected that they achieve good values for this metric. And, as one may observe, the values were very close, even though CGA and CGAλoutperformed the other algorithms considering the directed modularity.
6. Conclusions
In this paper, we propose a novel consensus genetic-based algorithm for detecting communities in directed net-works. The genetic algorithms are well-known for producing good results for a number of hard problems, in particu-lar, combinatorial optimization problems. All steps of the proposed strategy were defined bearing in mind we aimed at introducing a computationally cheap algorithm, for being suitable for tackling large-scale networks. The fitness func-tion considered in the experiments was the modularity designed for directed networks. Besides the original version, we carry out experiments with the version that considers the adjustment on the resolution parameter, here referred as
λ.
Computational experiments were carried out with LFR networks and real instances. A comparative performance analysis of prominent algorithms as Infomap and Label Propagation indicated that the proposed strategy, considering the modularity and the adjusted modularity, outperformed when considering the expected partitions. Additionally, we highlight the results of the version with the adjusted modularity, named CGAλ, since it achieved the best results between the two versions of the proposed algorithm. The reason behind this behavior is the need of adjusting the so-called modularity measure due to the resolution limit it presents in some type of networks. The experiment with real networks indicated a very good performance of the consensus genetic-based algorithm. However, as they do not present any expected partition, the only metric in the assessment was the modularity. In the sense of ensemble partitions, the proposed algorithm is a very good alternative, since the population of the genetic algorithm produced
a collection of good quality partitions. The possibility of a community detection algorithm to return more than one partition besides enabling a greater flexibility for the method, allows the user to deeply study his/her data set. Moreover, this algorithm can be adapted for different fitness functions, in particular, the one employed by Infomap, the so-called map equation.
Acknowledgments
The authors are grateful toFunda¸c˜ao de Amparo `a Pesquisa do Estado de S˜ao Paulo(FAPESP Proc.: 2015/ 21660-4, 2015/18580-9) andConselho Nacional de Desenvolvimento Cient´ıfico e Tecnol´ogico(CNPq id: 448614/2014-6) for the financial support.
References
1. Newman, M.E.J., Girvan, M.. Finding and evaluating community structure in networks.American Physical Society2004;69(2):1–15. 2. Rosvall, M., Bergstrom, C.T.. Maps of random walks on complex networks reveal community structure. Proceedings of the National
Academy of Sciences2008;105:1118–1123.
3. Malliaros, F.D., Vazirgiannis, M.. Clustering and community detection in directed networks: A survey.Physics Reports2013;533(95-142). 4. Brandes, U., Delling, D., Gaertler, M., Gorke, R., Hoefer, M., Nikoloski, Z., et al. On modularity clustering. Knowledge and Data
Engineering, IEEE Transactions on2008;20(2):172–188.
5. Leicht, E.A., Newman, M.E.J.. Community structure in directed networks.Physical Review Letter2008;100:118703.
6. Fortunato, S., Barth´elemy, M.. Resolution limit in community detection.Proceedings of the National Academy of Sciences2007;104:36–41. 7. Albert, R., Barab´asi, A.. Statistical mechanisms of complex networks.Reviews of Modern Physics2002;74:47–97.
8. Arenas, A., Duch, J., Fern´andez, A., G´omez, S.. Size reduction of complex networks preserving modularity.New Journal of Phisics2007;
9:176.
9. Shang, R., Bai, J., Jiao, L., Jin, C.. Community detection based on modularity and an improved genetic algorithm. Physica A: Sta-tistical Mechanics and its Applications2013;392(5):1215 – 1231. URL:http://www.sciencedirect.com/science/article/pii/ S0378437112009673. doi:http://dx.doi.org/10.1016/j.physa.2012.11.003.
10. Lancichinetti, A., Fortunato, S., F, R.. Benchmark graphs for testing community detection algorithms.Physical Review E2008;78:046110. 11. Mu, C.H., Xie, J., Liu, Y., Chen, F., Liu, Y., Jiao, L.C.. Memetic algorithm with simulated annealing strategy and tightness greedy optimization for community detection in networks. Applied Soft Computing2015;34:485 – 501. URL:http://www.sciencedirect. com/science/article/pii/S1568494615003415. doi:http://dx.doi.org/10.1016/j.asoc.2015.05.034.
12. Raghavan, U.N., Albert, R., Kumara, S.. Near linear time algorithm to detect community structures in large-scale networks. Physical Review E2007;76(3):036106.
13. Ma, L., Gong, M., Liu, J., Cai, Q., Jiao, L.. Multi-level learning based memetic algorithm for community detection. Applied Soft Computing2014;19:121 – 133. URL:http://www.sciencedirect.com/science/article/pii/S1568494614000623. doi:http: //dx.doi.org/10.1016/j.asoc.2014.02.003.
14. Topchy, A., Jain, A.K., Punch, W.. Clustering ensembles: Models of consensus and weak partitions.IEEE Transactions on Pattern Analysis and Machine Intelligence2005;27(12):1866–1881.
15. Topchy, A., Jain, A.K., Punch, W.. A mixture model for clustering ensembles. In:Proceedings of the SIAM International Conference on Data Mining; vol. 25. 2004, p. 1866–1881.
16. Ovelgonne, M., Geyer-Schulz, A.. An ensemble learning strategy for graph clustering.American Mathematical Society2012;588:187–206. 17. Vega-Pons, S., Ruiz-Shucloper, J.. A survey of clustering ensemble algorithms.International Journal of Pattern Recognition and Artificial
Intelligence2011;25:337–372.
18. Torabi, S.A., Ghomi, S.M.T.F., Karimi, B.. A hybrid genetic algorithm for the finite horizon economic lot and delivery scheduling in supply chains.European Journal of Operational Research2006;173(1):173–189.
19. Csardi, G., Nepusz, T.. The igraph software package for complex network research. InterJournal2006;Complex Systems:1695. URL:
http://igraph.sf.net.
20. Lancichinetti, A., Fortunato, S.. Benchmarks for testing community detection algorithms on directed and weighted graphs with overlapping communities.Physical Review E2009;:016118.
21. Carvalho, D.M., Resende, H., Nascimento, M.C.V.. Modularity maximization adjusted by neural networks. In:ICONIP’14; no. 8834 in Lecture Notes in Computer Science. 2014, p. 287–295.
22. Krempel, L.. Visualizing networks with spring embedders: Two-mode and valued data.American Statistical Association1999;:36–45. 23. Kleinberg, J.M.. Authoritative sources in a hyperlinked environment.J ACM1999;46(5):604–632.
24. Langville, A.N., Meyer, C.D.. A reordering for the pagerank problem.SIAM J Scientific Computing2006;27(6):2112–2120. doi:10.1137/ 040607551.
25. Coleman, J.S., Katz, E., Menzel, H..Medical innovation: a diffusion study. Advanced Study in Sociology. Bobbs-Merrill Co.; 1966. 26. Meli´an, C.J., Bascompte, J.. Food Web Cohesion.Ecology2004;85(2):352–358. URL:http://dx.doi.org/10.1890/02-0638.