Proposed Differential Evolution Technique for
Solving the Power System Economic
Load Dispatch Problem
Sapna Kapoor
l, Rameshwar Singh
2PG Student [Control System], Dept. of EE, NITM Engineering College, Gwalior, Madhya Pradesh, India1 Assistant Professor, Dept. of EE, NITM Engineering College, Gwalior, Madhya Pradesh, India2
ABSTRACT: Electrical power industry restructuring has created highly vibrant and competitive market that altered many aspects of the power industry. In this changed scenario, scarcity of energy resources, increasing power generation cost, environment concern, ever growing demand for electrical energy necessitate optimal economic dispatch. In This paper presents an application of the Differential Evolution optimization algorithm to power system economic load dispatch problem with ramp rate limit for 15 unit test case system. Power system Economic load dispatch problems are applied and compared its solution quality and computation efficiency to Genetic algorithm (GA) and Differential Evolution optimization algorithm.
KEYWORDS: power system Economic Load Dispatch, Genetic Algorithm,Differential Evolution algorithm,
I. INTRODUCTION
Electric utility system is interconnected to achieve the benefits of minimum production cost, maximum reliability and better operating conditions. The economic scheduling is the on-line economic load dispatch, wherein it is required to distribute the load among the generating units which are actually paralleled with the system, in such a way as to minimize the total operating cost of generating units while satisfying system equality and inequality constraints. For any specified load condition, ELD determines the power output of each plant (and each generating unit within the plant) which will minimize the overall cost of fuel needed to serve the system load. ELD is used in real-time energy management power system control by most programs to allocate the total generation among the available units. ELD focuses upon coordinating the production cost at all power plants operating on the system [1]. Economic Load Dispatch (ELD) is an important optimization problem to schedule the generation among generating units in power system. The main aim of ELD problem is to minimize the operation cost by satisfying the various operational constraints in order meet the load demand. Due to the nonlinear nature of modern generating unit’s input-output characteristics and other constraints, the topic of ED problem is still becoming the main research interest in order to find for the better solution [2]. Economic load dispatch (ELD) is the online dispatch which is used for the distribution of load among the generating units. The cost of power generation, particularly in fossil fuel plants, is very high and ELD helps in economy a considerable amount of profits [3]. Non-conventional techniques are evolutionary programming [14][16], genetic algorithm [13], particle swarm optimization [15]is solving non-linear ELD problems. In this paper, Differential Evolution technique is discussed to solve the ED problem by considering the linear equality and inequality constraints for a 15 units system and the results were compared with GA. The algorithm described in this paper is capable of obtaining optimal solutions efficiently.
II.ECONOMIC LOAD DISPATCH - THERMAL STATIONS
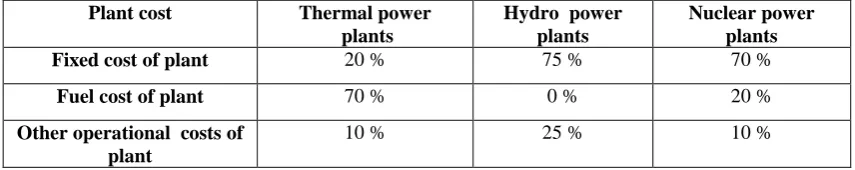
problem with both continuous and discrete control variables. Mathematical programming approaches most general formulation, the ELD is a nonlinear, non-convex, large scale, static optimization problem with both continuous and discrete control variables [4].A power system is a mix of different type of generations, out of which thermal, hydro and nuclear power generations contribute the active share. However, economic operation has conveniently been considered by proper scheduling of thermal or hydrogenation only. As for the safety of nuclear station, these types of stations are required to run at its base loads only and there is a little scope for the schedule of nuclear plants in practice. Economy of operation is most significant in case of thermal stations, as the variable costs are much higher compared to other type of generations. This can be considered by looking at various costs of different stations.
Table 1: Various Costs of different Stations
Plant cost Thermal power plants
Hydro power plants
Nuclear power plants Fixed cost of plant 20 % 75 % 70 %
Fuel cost of plant 70 % 0 % 20 %
Other operational costs of plant
10 % 25 % 10 %
Obviously the cost of fuel form the major portion of all variable costs and the purpose of economic operation is to reduce the cost of fuel. This is a static optimization problem. This paper deals with the economic load dispatch of the thermal plants [5].
A. Economic Dispatch
The objective of economic load dispatch of electric power generation is to schedule the committed generating unit outputs so as to meet the load demand at minimum operating cost while satisfying all units and operational constraints of the power system[6]. The economic dispatch problem is a constrained optimization problem and it can be mathematically expressed as follows:
𝑴𝒊𝒏𝒊𝒎𝒊𝒛𝒆 𝑭𝑻= 𝑭𝒏(𝑷𝒏) 𝒏
𝒏=𝟏
… … … . (𝟏)
Where, FT: total generation cost (Rs/hr) n: number of generators Pn : real power generation of nth generator (MW) Fn(Pn) : generation cost for Pn Subject to a number of power systems network equality and inequality constraints. These constraints include:
B. System Active Power Balance For power balance, an equality constraint should be satisfied. The total power generated should be the same as total load demand plus the total line losses
𝐏𝐃+ 𝐏𝐋− 𝐏𝐧 = 𝟎 𝐧
𝐧=𝟏
… … … . (𝟐)
Where, PD: total system demand (MW) PL: transmission loss of the system (MW)
C. Generation Limits Generation output of each generator should be laid between maximum and minimum limits. The corresponding inequality constraints for each generator are (2.3) Where, Pn, min: minimum power output
𝑷𝒏,𝒎𝒊𝒏 ≤ 𝑷𝒏≤ 𝑷𝒏,𝒎𝒂𝒙
Where, Pn, min: minimum power output limit of nth generator (MW) Pn,max : maximum power output limit of nth generator (MW) The generation cost function Fn(Pn) is usually expressed as a quadratic polynomial:
𝑭𝒏 𝑷𝒏 = 𝒂𝒏𝑷𝒏𝟐+ 𝒃𝒏𝑷𝒏+ 𝒄𝒏… … … … (𝟑)
Where, an, bn and cn are fuel cost coefficients.
derivatives of the objective function as in classical optimization method. The DE can be used in optimization problems where the objective function is stochastic, non-continuous, noisy, difficult to differentiate, change over time. The candidate solutions in DE are referred as agents. These agents are moved around in solution space to combine the position of existing agents from the population. If the new position of an agent is enrichment, then it is accepted and becomes the part of the population otherwise the new position is rejected [7][8]. In DE algorithm, solutions are represented as chromosomes based on floating-point numbers. In the mutation process of this algorithm, the weighted difference between two randomly selected population members are added to a third member to generate a mutated solution followed by a crossover operator to combine the mutated solution with the target solution so as to generate a trial solution. Then a selection operator is applied to compare the fitness function value of both competing solutions, namely, target and trial solutions to determine who can survive for the next generation. The basic DE algorithm consists of four steps, namely, initialization of population, mutation, crossover and selection [9][10]. Also, it has three control parameter, namely, population size (Np), scaling coefficient (F), and crossover probability (CR).
IV.CONTROL PARAMETER OF DIFFERENTIAL EVOLUTION ALGORITHM
Proper selection of control parameters is very important for algorithm performance and success. The control parameters are problem specific. Therefore, the set of control parameters have to be chosen carefully. Parameter tuning is the most common method to select control parameters. Parameter tuning adjusts the control parameters through testing until the best settings are determined. Typically, the following ranges are good initial estimates: F = [0.5, 0.6], CR = [0.75, 0.90], and NP = [3*D, 8*D]. In order to avoid premature convergence, F or NP should be increased, or CR should be decreased. Larger values of F result in larger perturbations and better probabilities to escape from local optima, while lower CR preserves more diversity in the population thus avoiding local optima.
(A) Population initialization: (B) Mutation (C) Crossover (D) Selection operate (A) INITIALIZATION OF DIFFERENTIAL EVOLUTION
At the early stage of DE search, i.e. t = 0 the problem independent variables are initialized somewhere in their feasible numerical range. Therefore, if the jth variable has its lower and upper bounds as 𝑥𝑗𝐿 and 𝑥𝑗𝑈, respectively, then the jth
component of the ith population member may be initialized as: The basic strategy employs the difference of two randomly selected parameter vectors as the source of random variations for a third parameter vector. It can be presented:-
P= [𝑌1 (𝐺)
… … … . 𝑌𝑁𝑃 (𝐺)
] (4)
𝑌𝑖(𝐺) = [𝑋1𝑖(𝐺), 𝑋2𝑖 (𝐺)… … … . 𝑌𝐷𝑖(𝐺)] (5) Where i = 1,2, ………Np
𝑋𝑖𝑗 (0)= 𝑥𝑗 𝐿 + 𝑟𝑎𝑛𝑑 0,1 , (𝑥𝑗𝑢− 𝑥𝑗𝑙) (6)
Where rand (0, 1) is a uniformly distributed random number between 0 and 1.
(B) MUTATION OF DIFFERENTIAL EVOLUTION
In each generation, a donor vector Vi(t) is created in order to change the population member vector Xi(t). Generally, the method of creating this donor vector demarcates between various DE schemes.
In this mutation strategy, creation of the donor vector, Vi(t) for the ith member Xi passes through the following steps:
1 Three different members Xr1, Xr2, and Xr3, are chosen randomly from the current population and not coinciding with the current member Xi.
1. Next, a scalar number F scales the difference between any two of the chosen members and this scaled difference is added to the third one. Therefore, the jth component of Vi(t) can be expressed as,
𝑣𝑖,𝑗(𝑡 + 1) = 𝑥𝑟1,𝑗 𝑡 + 𝐹( 𝑥𝑟2𝑗(t)...𝑥𝑟3𝑗 𝑡 )
(C) CROSSOVER OF DIFFERENTIAL EVOLUTION
To increase the diversity of the population, crossover operation is carried out in which the donor vector exchanges its components with those of the current member Xi(t). Two types of crossover schemes can be used by DE algorithm. These are exponential crossover and binomial crossover. Among these two the binomial variant is much more used in recent applications. Recombination is employed to generate a trial vector by replacing certain parameters of the target vector with the corresponding parameters of a randomly generated donor vector. This is similar to a process known as crossover in Gas and ESs.
(D) SELECTION OF DIFFERENTIAL EVOLUTION
To keep the population size constant over subsequent generations, the selection process is carried out to determine which one of the child and the parent will survive in the next generation , i.e. at time t = t+1. DE actually involves the survival of the fittest principle in its selection process.
The selection process can be expressed as:-
𝑥𝑖 𝑡 + 1 = 𝑈𝑖 (𝑡) 𝑖𝑓 𝑓 𝑈𝑖(𝑡) ≤ 𝑓(𝑥𝑖 𝑡 ) ... (7) 𝑥𝑖 (𝑡) 𝑖𝑓 𝑓 𝑥𝑖(𝑡) < 𝑓(𝑈 𝑡 ) ... (8)
Where f (U(t)) is the function to be minimized. So, if the child yields a better value of the fitness function, it replaces its parent in the next generation; otherwise, the parent is retained in the population. Hence, the population either gets better in terms of the fitness function or remains constant but never deteriorates.
V. RESULT AND DISCUSSION
The 15-generating test system has been taken from [11].The proposed Differential Evolution Algorithm has been implemented successfully to solve the economic load dispatch problem of 15 units. In this paper case studies of effect of different population and compare different optimization technique.
Test Case (A) Population Size based solution
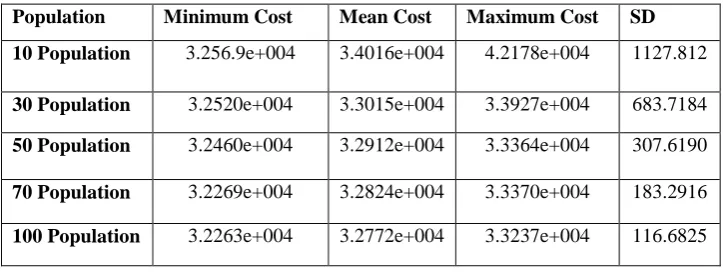
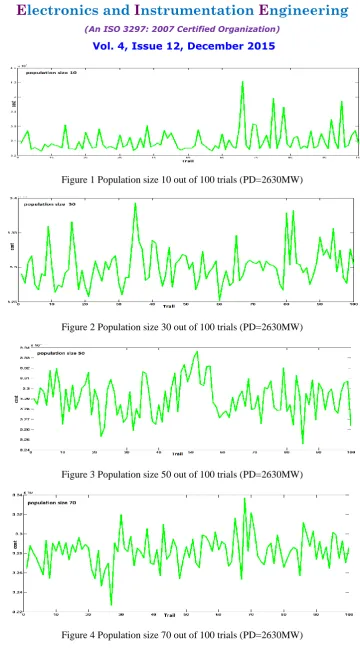
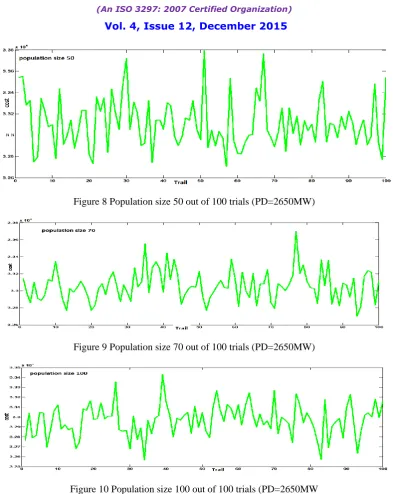
In this test case effect of population size 10, 30.50,70 and 100 in different parameter and used power demand 2630 MW and 2650.There are best trails results minimum cost, mean cost, maximum cost and standard deviation is shown in figure 1 (pop 10), figure 2 (pop 30), figure 3 (pop 50), figure 4 (pop 70), figure 5 (pop 100),table 2 and figure 6 (pop 10), figure 7 (pop 30), figure 8 (pop 50), figure 9 (pop 70), figure 10 (pop 100) & table 3.Proposed Differential Evolution Algorithm achieved quite effective result, It’s clear that Pop size increase so system cost and standard deviation of the of the system decreased.
Table 2 Result of different population size on 15 unit systems (2630) Population Minimum Cost Mean Cost Maximum Cost SD 10 Population 3.256.9e+004 3.4016e+004 4.2178e+004 1127.812
30 Population 3.2520e+004 3.3015e+004 3.3927e+004 683.7184
50 Population 3.2460e+004 3.2912e+004 3.3364e+004 307.6190
70 Population 3.2269e+004 3.2824e+004 3.3370e+004 183.2916
Figure 1 Population size 10 out of 100 trials (PD=2630MW)
Figure 2 Population size 30 out of 100 trials (PD=2630MW)
Figure 3 Population size 50 out of 100 trials (PD=2630MW)
Figure 5 Population size 100 out of 100 trials (PD=2630MW)
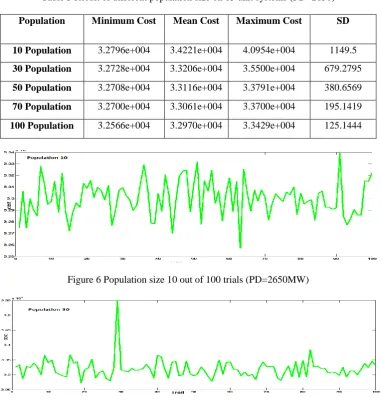
Table 3 Result of different population size on 15 unit systems (PD=2650)
Population Minimum Cost Mean Cost Maximum Cost SD
10 Population 3.2796e+004 3.4221e+004 4.0954e+004 1149.5
30 Population 3.2728e+004 3.3206e+004 3.5500e+004 679.2795
50 Population 3.2708e+004 3.3116e+004 3.3791e+004 380.6569
70 Population 3.2700e+004 3.3061e+004 3.3700e+004 195.1419
100 Population 3.2566e+004 3.2970e+004 3.3429e+004 125.1444
Figure 6 Population size 10 out of 100 trials (PD=2650MW)
Figure 8 Population size 50 out of 100 trials (PD=2650MW)
Figure 9 Population size 70 out of 100 trials (PD=2650MW)
Figure 10 Population size 100 out of 100 trials (PD=2650MW
Test case (B): Comparers of 15- unit system between Genetic algorithm and Proposed Differential Evolution Algorithm
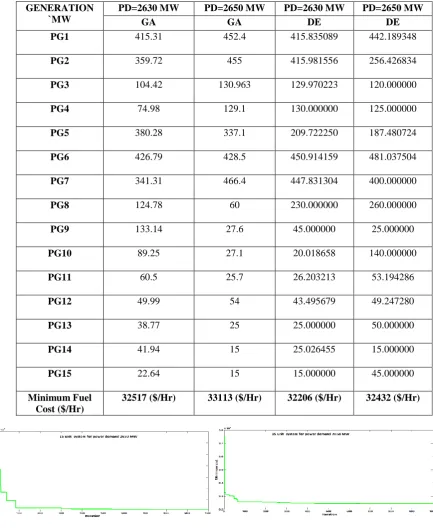
Proposed Differential Evolution Algorithm achieved quite effective result. A parameter tuning was done to find optimal values of F 0.9 & C 0.9, NP 1000 and number of Iteration used 1000 for 15 unit ELD problem, Results obtained from Proposed Differential Evolution Algorithm have been compared with Genetic algorithm [11]. Comparison the best results of GA and DE are shown in Table 4 and fig 11 & fig 12. The proposed DE algorithm provided better results compared to GA evolutionary techniques.
Table 4 Comparison Genetic algorithm and Proposed Differential Evolution Algorithm
GENERATION `MW
PD=2630 MW PD=2650 MW PD=2630 MW PD=2650 MW
GA GA DE DE
PG1 415.31 452.4 415.835089 442.189348
PG2 359.72 455 415.981556 256.426834
PG3 104.42 130.963 129.970223 120.000000
PG4 74.98 129.1 130.000000 125.000000
PG5 380.28 337.1 209.722250 187.480724
PG6 426.79 428.5 450.914159 481.037504
PG7 341.31 466.4 447.831304 400.000000
PG8 124.78 60 230.000000 260.000000
PG9 133.14 27.6 45.000000 25.000000
PG10 89.25 27.1 20.018658 140.000000
PG11 60.5 25.7 26.203213 53.194286
PG12 49.99 54 43.495679 49.247280
PG13 38.77 25 25.000000 50.000000
PG14 41.94 15 25.026455 15.000000
PG15 22.64 15 15.000000 45.000000
Minimum Fuel Cost ($/Hr)
32517 ($/Hr) 33113 ($/Hr) 32206 ($/Hr) 32432 ($/Hr)
VI. CONCLUSION
In this paper, authors have successfully introduced Differential Evolution optimization algorithm to solve power system Economic load dispatch problem and compared its results to those of other well established algorithms. It is observed that the Proposed Differential Evolution Algorithm exhibits a comparative performance with respect to other population based techniques. It clearly shows that the figure 11 and figure 12 Differential Evolution optimization algorithms is converging to a better quality near-optimal solution, better computation time and more stable characteristics convergence.
REFERENCES
1. Anjali Tikalkar1, Manju Khare2,” Economic Load Dispatch Using Linearly Decreasing Inertia Weight Particle Swarm Optimization” International Journal of Emerging Technology and Advanced Engineering, Volume 4, Issue 1, January 2014.
2. Janaki Kolli1, K Bhavana2,” Comparative Study to Solution of Economic Load Dispatch - Using Evolutionary Algorithms” International Journal of Emerging Trends in Electrical and Electronics (IJETEE – ISSN: 2320-9569) Vol. 11, Issue. 5, September-2015.
3. Neetu Agrawal, Shilpy Agrawal, K. K. Swarnkar, S. Wadhwani, and A. K. Wadhwani” Economic Load Dispatch Problem with Ramp Rate Limit Using BBO”, International Journal of Information and Education Technology, Vol. 2, No. 5, October 2012.
4. M. Anuj Gargeya1, Sai Praneeth Pabba2,” Economic Load Dispatch Using Genetic Algorithm And Pattern Search Methods” International Journal of Advanced Research in Electrical, Electronics and Instrumentation Engineering Vol. 2, Issue 4, April 2013.
5. Dr. L.V.Narasimha Rao1, “PSO Technique for Solving the Economic Dispatch Problem Considering the Generator Constraints”, International Journal of Advanced Research in Electrical, Electronics and Instrumentation Engineering, Vol. 3, Issue 7, July 2014.
6. K. Sudhakara Reddy1, Dr. M. Damodar Reddy2, “Economic Load Dispatch Using Firefly Algorithm”, International Journal of Engineering Research and Applications (IJERA), Vol. 2, Issue4, July-August 2012,
7. R. Storn and K. Price, “Differential evolution: a simple and efficient adaptive scheme for global optimization over continuous spaces”, Technical Report TR-95-012, Berkeley, USA: International Computer Science Institute, 1995.
8. [K. Vaisakh and L. R. Srinivas, “Differential Evolution Approach for Optimal Power Flow Solution”, Journal of Theoretical and Applied Information Technology.
9. Surekha P, Dr.S.Sumathi,“Solving Economic Load Dispatch Problems Using Differential Evolution With Opposition Based Learning” WSEAS Transactions On Information Science And Applications, Issue 1, Volume 9, January 2012.
10. C.Kumar, T.Alwarsamy, “Solution Of Economic Dispatch Problem Using Differential Evolution Algorithm”, International Journal Of Soft Computing And Engineering (IJSCE) ISSN: 2231-2307, Volume-1, Issue-6, January 2012.
11. Piyush Jain, K.K.Swarnkar, Dr. S.Wadhwani, Dr. A.K.Wadhwani, “Prohibited Operating Zones Constraint with Economic Load Dispatch using GeneticAlgorithm” International Journal of Engineering and Innovative Technology (IJEIT) Volume 1, Issue 3, March 2012.
12. Chao-Lung Chiang “Improved genetic algorithm for power economic dispatch of units with valve-point effects and multiple fuels,” IEEE Trans. Power Systems, vol.20, no. 4, pp.1690-1699, 2005.
13. N.Sinha,R.chakrabarti,P.K.Chattopadhyay,“Evolutionary programming techniques for economic load dispatch,” IEEE Trans. on Evolutionary Computation, vol. 7, no. 1, pp. 83-94, 2003
14. Giang ZL. Particle swarm optimization to solving the economic dispatch considering the generator constraints. IEEE Transaction on Power System 2003; 18(August (3)):1187–95.
15. Ah King R. T. F. and Rughooputh H. C. S., “Elitist Multiobjective Evolutionary Algorithm for Environmental/Economic Dispatch”, IEEE Congress on Evolutionary Computation, Canberra, Australia, vol. 2, pp. 1108-1114, 2003.
BIOGRAPHY
Sapna Kapoor was born on 28th February 1990.She did B.E. from Madhav Institute of Technology & Science Gwalior (India) in 2011. She is Pursuing M.tech. In Electrical Egg. (Control system) from N.I.T.M college Gwalior (M.P.).Her area of interest control system, power system, electrical machines.