Masthead Logo
University of Tennessee, Knoxville
Trace: Tennessee Research and Creative Exchange
Doctoral Dissertations Graduate School
12-2018
Modeling, Simulation, and Analysis of Cascading
Outages in Power Systems
Wenyun Ju
University of Tennessee, [email protected]
This Dissertation is brought to you for free and open access by the Graduate School at Trace: Tennessee Research and Creative Exchange. It has been accepted for inclusion in Doctoral Dissertations by an authorized administrator of Trace: Tennessee Research and Creative Exchange. For more information, please [email protected].
Recommended Citation
Ju, Wenyun, "Modeling, Simulation, and Analysis of Cascading Outages in Power Systems. " PhD diss., University of Tennessee, 2018. https://trace.tennessee.edu/utk_graddiss/5318
To the Graduate Council:
I am submitting herewith a dissertation written by Wenyun Ju entitled "Modeling, Simulation, and Analysis of Cascading Outages in Power Systems." I have examined the final electronic copy of this dissertation for form and content and recommend that it be accepted in partial fulfillment of the requirements for the degree of Doctor of Philosophy, with a major in Electrical Engineering.
Kai Sun, Major Professor We have read this dissertation and recommend its acceptance:
Mingzhou Jin, Fanxing Li, Hairong Qi
Accepted for the Council: Carolyn R. Hodges Vice Provost and Dean of the Graduate School (Original signatures are on file with official student records.)
Modeling, Simulation, and Analysis of
Cascading Outages in Power Systems
A Dissertation Presented for the
Doctor of Philosophy
Degree
The University of Tennessee, Knoxville
Wenyun Ju
December 2018
ii
Copyright © 2018 by Wenyun Ju All rights reserved.
iii
DEDICATION
This dissertation is dedicated to my beloved parents, Chunxi Ju and Jinhua Gong, my elder sisters, Shujuan Gong and Wenxia Ju, whose loves and encouragements make it possible for me to finish this work.
iv
ACKNOWLEDGEMENTS
Time flies in the blink of an eye. I can remember clearly the first day I came to UTK in 2014, before which to pursue a PhD degree in the United States was beyond my imagination. However, the story was happening. As a fruit needs not only sunshine but cold nights and chilling showers to be ripe, a character needs not only joys but trials and difficulties to become mellow. I am becoming more mature and thorough over this intensive period. Today is the day: writing this note of thanks is the finishing touch on my dissertation. It has been a period of intense learning for me, not only in the research area, but also on a personal level. Writing this dissertation has had a big impact on me. I would like to reflect on the people who have supported and helped me so much throughout this period. I would like to express my thanks to those who helped me with various aspects of conducting research and writing this dissertation.
Special mention goes to my advisor, Dr. Kai Sun, for the patient guidance, encouragement and advice he has provided throughout my whole PhD period. I have been extremely lucky to have a supervisor who cared so much about my work, and who responded to my questions and queries so promptly. Without his guidance and persistent help this dissertation would not have been possible.
Similar, profound gratitude goes to Dr. Fangxing “Fran” Li, Dr. Hairong Qi, and Dr. Mingzhou Jin for their times and efforts in serving as the members of my dissertation committee.
I would especially like to thank my dear friends Miss Yajun Wang, Mr. Qingxin Shi, and Miss Siqi Wang. This small group including me is full of energy and passion. Thank you for your company.
I also would like to thank Dr. Weihong Huang, Dr. Fengkai Hu, Dr. Chengxi Liu, Dr. Bin Wang, Dr. Nan Duan, Dr. Junjian Qi, Dr. Lin Zhu, Miss Yinfeng Zhao, Dr. Zheyu Zhang, Mr. Yichen Zhang, and Dr. Wenxuan Yao, who gave much support to my research and PhD life.
v
Moreover, I would like to express my special thanks to other students and scholars in our group, Dr. Yongli Zhu, Dr. Rui Yao, Mr. Denis Osipov, Mr. Xin Xu, Mr. Yang Liu, Mr. Tianwe Xia, Mr. Guoqiang Zu, Mr. Yichen Guo, and Dr. Dongsheng Cai for being supportive to my research.
In addition, special thanks go to my friends Miss Ling Jiang, Dr. Chongwen Zhao, Mr. Shuoting Zhang, Dr. Bo Liu, and Mr. Ren Ren.
A special thank goes to Angie, you make me realize that life is too short to wait.
Finally, but by no means least, thanks go to the Center for Ultra Wide-Area Resilient Electric Energy Transmission (CURENT) for the support under the Engineering Research Center Program of the National Science Foundation and the Department of Energy under Grant No. EEC-1041877. I would like to express my sincere gratitude for providing excellent materials, logistical and human conditions and creating a loving and friendly atmosphere for conducting research.
vi
ABSTRACT
Interconnected power systems are prone to cascading outages leading to large-area blackouts. Modeling, simulation, analysis, and mitigation of cascading outages are still challenges for power system operators and planners.
Firstly, the interaction model and interaction graph proposed by [27] are demonstrated on a realistic Northeastern Power Coordinating Council (NPCC) power system, identifying key links and components that contribute most to the propagation of cascading outages. Then a multi-layer interaction graph for analysis and mitigation of cascading outages is proposed. It provides a practical, comprehensive framework for prediction of outage propagation and decision making on mitigation strategies. It has multiple layers to respectively identify key links and components, which contribute the most to outage propagation. Based on the multi-layer interaction graph, effective mitigation strategies can be further developed. A three-layer interaction graph is constructed and demonstrated on the NPCC power system.
Secondly, this thesis proposes a novel steady-state approach for simulating cascading outages. The approach employs a power flow-based model that considers static power-frequency characteristics of both generators and loads. Thus, the system frequency deviation can be calculated under cascading outages and control actions such as under-frequency load shedding can be simulated. Further, a new AC optimal power flow model considering frequency deviation (AC-OPFf) is proposed to simulate remedial control against system collapse. Case studies on the two-area, IEEE 39-bus, and NPCC power systems show that the proposed approach can more accurately capture the propagation of cascading outages when compared with a conventional approach using the conventional power flow and AC optimal power flow models.
Thirdly, in order to reduce the potential risk caused by cascading outages, an online strategy of critical component-based active islanding is proposed. It is performed when any component belonging to a predefined set of critical
vii
components is involved in the propagation path. The set of critical components whose fail can cause large risk are identified based on the interaction graph. Test results on the NPCC power system show that the cascading outage risk can be reduced significantly by performing the proposed active islanding when compared with the risk of other scenarios without active islanding.
Index Terms—Blackout; cascading outages; multi-layer interaction graph;
interaction graph; key link; key component; dynamic load flow; AC-OPA; DC-OPA; AC optimal power flow considering frequency deviation; Northeastern Power Coordinating Council (NPCC) Power System; under-frequency load shedding.
viii
TABLE OF CONTENTS
Chapter One Introduction and Background Information ... 1
1.1 Introduction ... 1
1.1.1 Major Causes of Cascading Outages ... 3
1.1.2 Procedure of Cascading Outages... 4
1.2 Modeling, Simulation, and Analysis of Cascading Outages ... 5
1.2.1 High-Level Statistic Approaches ... 6
1.2.2 Stochastic Simulation Approaches ... 8
1.2.3 Quasi-Dynamic and Dynamic Simulation Approaches ... 10
1.2.4 Complex Network Theory Approaches ... 15
1.2.5 Interdependent Approaches ... 16
1.2.6 Other Approaches ... 19
1.3 Contributions of this Work ... 22
Chapter Two Multi-Layer Interaction Graph for Simulation and Analysis of Cascading Outages ... 24
2.1 Introduction ... 24
2.2 Demonstration of Interaction Graph and Interaction Model on the NPCC Power System ... 25
2.2.1 Original Cascades and Simulated Cascades ... 25
2.2.2 Interaction Matrix and Interaction Graph ... 25
2.2.3 Identification of Key Links and Components ... 26
2.2.4 Interaction Model ... 26
2.2.5 Mitigation Strategies of Cascading outages ... 27
2.2.6 Determining The Line Flow Limits ... 27
2.2.7 Simulation Results ... 29
2.3 Multi-Layer Interaction Graph ... 36
2.3.1 Database of Cascades and Links ... 38
2.3.2 Link Weights for Different Layers ... 39
ix
2.4 Mitigation Strategies ... 46
2.4.1 Weakening of Key Intra-Layer Links ... 46
2.4.2 Validation of Mitigation Strategies ... 47
2.5 Number of Cascades Needed for a Database ... 47
2.6 Case Studies ... 48
2.6.1 A Multi-Layer Interaction Graph ... 50
2.6.2 Key Inter-Layer Links and Components ... 53
2.6.3 Multi-Layer Interaction Graph for Increased System Load ... 56
2.6.4 Distribution of Key Intra-Layer Links among Generations ... 59
2.6.5 Validation of Mitigation Strategies ... 59
2.6.6 Determining the Number of Cascades... 61
2.7 Conclusions of this Chapter ... 62
Chapter Three Simulation of Cascading Outages Using a Power-Flow Model Considering Frequency... 64
3.1 Introduction ... 64
3.2 Proposed Simulation Approach for Cascading Outages ... 67
3.2.1 DLF Model ... 67
3.2.2 Dynamic Load Flow Model ... 70
3.2.3 Under-Frequency Load Shedding Scheme ... 72
3.2.4 Generator Frequency and Transmission Line Protections ... 73
3.2.5 Simulation Procedure of the Proposed Approach ... 75
3.3 Case Studies ... 77
3.3.1 Selection of Parameters ... 77
3.3.2 Tests on the Two-area System ... 78
3.3.3 Tests on the IEEE 39-bus System ... 79
3.3.4 Tests on the NPCC System ... 86
3.4 Conclusion of this Chapter ... 90
Chapter Four Critical Component-Based Active Islanding for Reducing Cascading Outage Risk ... 92
x
4.2 Proposed Strategy of Active Islanding ... 94
4.2.1 Illustration of Active Islanding ... 94
4.2.2 Critical Components With Interaction Graph ... 96
4.2.3 Strategies of Active Islanding ... 98
4.3 Case Studies ... 100
4.3.1 Different Classes of Cascades ... 100
4.3.2 Comparison between Different Classes ... 100
4.3.3 Selection of Number of Critical Components ... 104
4.4 Conclusion of this Chapter ... 106
Chapter Five Summary and Future Works... 108
5.1 Summary ... 108
5.2 Future Works ... 109
List of References ... 110
Appendix ... 127
Publications during Ph.D. Study ... 128
xi
LIST OF TABLES
Table 1-1. The 15 Largest North American Blackouts and Their Causes,
1984-2006. ... 2
Table 1-2. Descriptive Statistics for the NERC Disturbance Data, 1984–2006. .... 2
Table 1-3. Comparison of the Models and Approaches of Cascading Outages. . 20
Table 2-1. Information of Parameters. ... 30
Table 2-2. Line Flow Limits for Original DC-OPA Method. ... 31
Table 2-3. Key Links of NPCC Test Bed. ... 32
Table 2-4. Key Components of NPCC Test Bed. ... 32
Table 2-5. Probability of Tripping with Line Loading. ... 49
Table 2-6. Numbers of Overlapped Links between Different Layers. ... 52
Table 2-7. Influences of Different Mitigation Strategies on Different Assessment Indices. ... 61
Table 3-1. AC-OPFf and AC-OPF Models. ... 71
Table 3-2. UFLS Scheme of NPCC for Different Load Buses. ... 73
Table 3-3. Parameters for the Turbine-Governor Model. ... 78
Table 3-4. Estimation of Convergence Rate of DLF Calculation. ... 82
Table 3-5. Generator Power Outputs and System Frequencies. ... 84
Table 3-6. Statistical Comparison of the Two Approaches with 1028 Samples. . 86
Table 3-7. Propagation Path of Cascading Outages in Scenario 5. ... 87
Table 3-8. Comparison of Steady-state Frequencies for Scenario 5. ... 87
Table 3-9. Propagation Path of Cascading Outages in Scenario 6. ... 87
Table 3-10. Comparison of Steady-state Frequencies for Scenario 6. ... 87
Table 3-11. Statistical Comparison of the Two approaches with 10000 Samples. ... 90
Table 3-12. Comparison in Time Performance ... 90
xii
LIST OF FIGURES
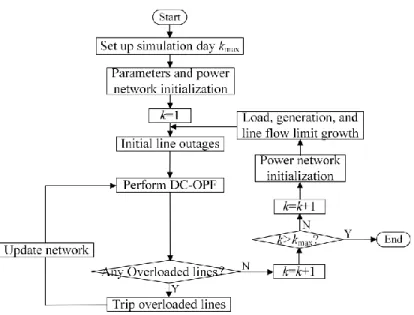
Figure 2-1. Flow chart of the DC-OPA method for line flow limits. ... 28
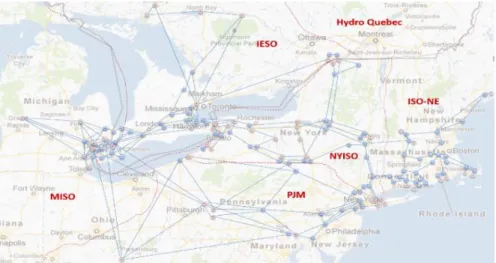
Figure 2-2. NPCC power system test bed. ... 30
Figure 2-3. Simulation results of total line flow limits. ... 30
Figure 2-4. Complementary cumulative probability distribution of link weight. .... 33
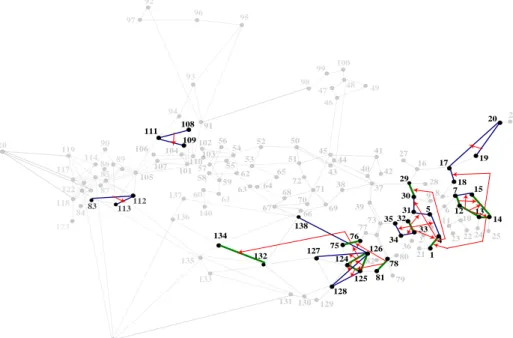
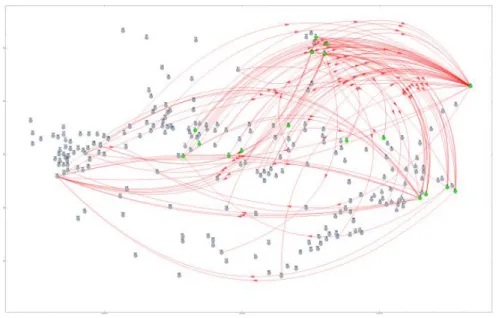
Figure 2-5. Key links (red arrows), key components (green lines), and other involved components (blue lines) with the rest of the system (faded). ... 34
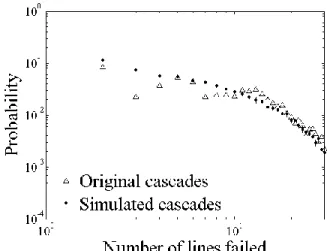
Figure 2-6. Probability distributions of the total number of line failed for original and simulated cascades. ... 35
Figure 2-7. Probability distributions of the total number of line failed for original and simulated cascades under different mitigation strategies... 36
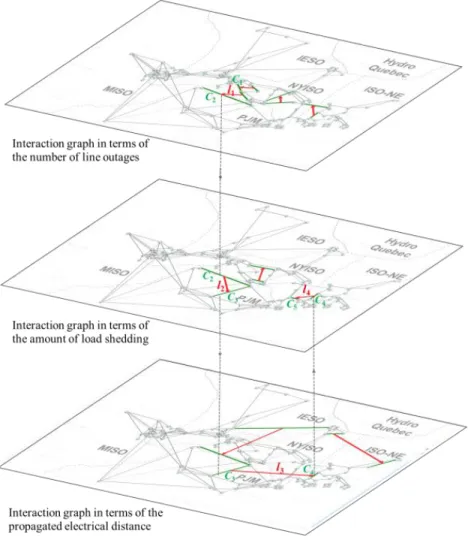
Figure 2-8. Schematic diagram on how a scenario of cascade outages propagates in and across multiple layers of the interaction graph for the NPCC power system. ... 37
Figure 2-9. Path of a sample scenario of cascade outages. ... 37
Figure 2-10. Schematic diagram of the cascades. ... 38
Figure 2-11. Subgraph influenced by a link in the first layer. ... 42
Figure 2-12. Subgraph influenced by a link in the second layer. ... 43
Figure 2-13. Subgraph influenced by a link in the third layer. ... 44
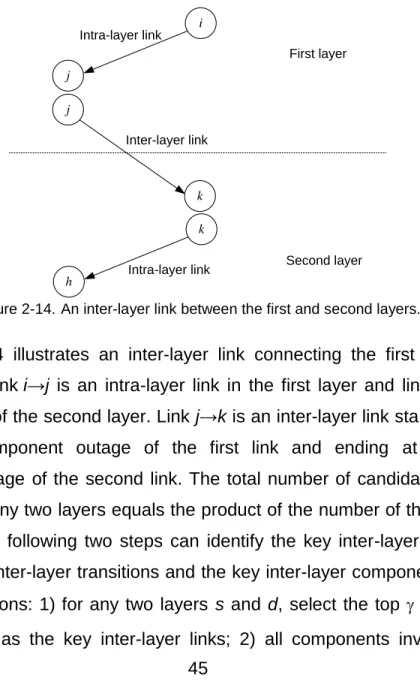
Figure 2-14. An inter-layer link between the first and second layers. ... 45
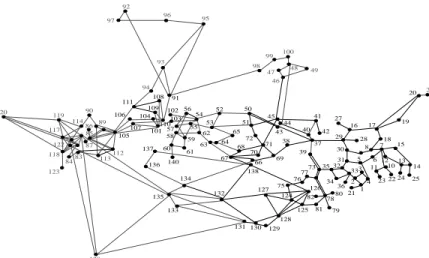
Figure 2-15. NPCC 140-bus system. ... 49
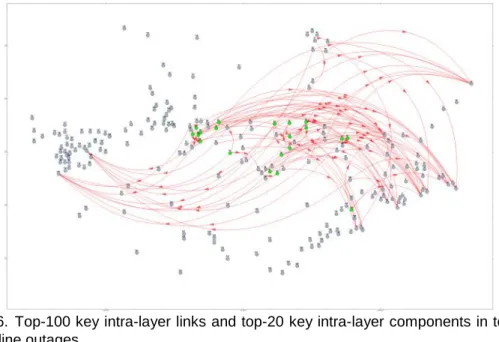
Figure 2-16. Top-100 key intra-layer links and top-20 key intra-layer components in terms of the number of line outages. ... 51
Figure 2-17. Top-100 key intra-layer links and top-20 key intra-layer components in terms of the amount of load shedding. ... 51
Figure 2-18. Top-100 key intra-layer links and top-20 key intra-layer components in terms of the propagated electrical distance... 52
xiii
Figure 2-19. Numbers of occurrences for key intra-layer links in different layers.
... 53
Figure 2-20. Comparison for the assessment indices for the top-100 key intra-layer links in different intra-layers. ... 53
Figure 2-21. Numbers of inter-layer links for different numbers of key intra-layer links. ... 54
Figure 2-22. Schematic diagram of key inter-layer links, key inter-layer components, and key intra-layer links. ... 55
Figure 2-23. Top-100 key intra-layer links and top-20 key intra-layer components in terms of the number of line outages at 110% system load. ... 57
Figure 2-24. Top-100 key intra-layer links and top-20 key intra-layer components in terms of the amount of load shedding with 110% system load. ... 57
Figure 2-25. Top-100 key intra-layer links and top-20 key intra-layer components in terms of the propagated electrical distance with 110% system load. ... 58
Figure 2-26. Numbers of overlapped links for different numbers of key intra-layer links. ... 58
Figure 2-27. Distribution of key intra-layer links in transitions of generations. .... 58
Figure 2-28. R and for different numbers of cascades. ... 62
Figure 3-1. Relationship between generator trip probability and frequency. ... 74
Figure 3-2. UFLS and generator frequency protection module. ... 75
Figure 3-3. Simulation procedure of the proposed approach. ... 76
Figure 3-4. Simulation procedure of a conventional approach for comparison. .. 76
Figure 3-5. Frequency variations from the DPF model and time-domain simulation... 79
Figure 3-6. Scenarios 1, 2, 3, and 4 on the IEEE 39-bus system. ... 80
Figure 3-7. Frequency variations of scenario 1. ... 81
Figure 3-8. Frequency variations of scenario 2. ... 81
Figure 3-9. Convergence of N-R method with the DLF model. ... 82
Figure 3-10. Frequency vs D of Scenario 3. ... 83
xiv
Figure 3-12. Comparison of two approaches on Scenario 7. ... 88
Figure 3-13. Comparison of two approaches on Scenario 8. ... 89
Figure 4-1. Simulation procedure of cascading outage without active islanding . 94 Figure 4-2. One scenario of cascading outage without active islanding ... 95
Figure 4-3. One scenario of cascading outage with active islanding... 95
Figure 4-4. Subgraph influenced by the link i → j. ... 97
Figure 4-5. Component i and involved links ... 98
Figure 4-6. Simulation procedure of cascading outages with the strategy of critical component-based active islanding ... 99
Figure 4-7. Simulation procedure of cascading outages with the strategy of non-critical component-based active islanding... 99
Figure 4-8. Number of cascades performing active islanding ... 101
Figure 4-9. Comparison of load shed between cascades with and without active islanding for Classes 1, 2, and 3. ... 102
Figure 4-10. Comparison of load shed between cascades with and without active islanding for Classes 1, 4, and 5. ... 102
Figure 4-11. Comparison of load shed between cascades with and without active islanding for Classes 1, 6, and 7. ... 102
Figure 4-12. Ratio of the number of cascades ... 104
Figure 4-13. Average reduced amount of load shed for those cascades with reduced risk ... 105
Figure 4-14. Ratio of the number of cascades with increased risk ... 106
Figure 4-15. Average increased amount of load shed for those cascades with increased risk ... 106
1
CHAPTER ONE
INTRODUCTION AND BACKGROUND INFORMATION
1.1 Introduction
Power system is one of the most complex systems in the modern society. The modern power system is approaching to the critical operating limits in the environment of market. With the increasing of load demand, high capacity and long transmission networks are widely used to meet the requirement. With the integration of renewable energies such as wind and solar, the uncertainty, intermittence bring bigger challenge to the operation of power system. Therefore, a random outage or local outage may propagate and thus cause large-scale blackout eventually [1].
Large blackouts, although infrequent, are costly to society with estimates of direct costs up to billions of dollars. For example, a blackout happened in Aug. 14, 2003 in areas of Midwest and Northeast United States, and Ontario in Canada. 50 million people are affected and the total cost of it is around 10 billion dollars [2]. Some other indirect costs such as the failures of communications, natural gas, transportation, water supply and social disruptions are also caused. The influences of large blackouts in the Unites States with more than 50,000 customers or 300 MW load loss are analyzed based on the data sets obtained from North American Electric Reliability Corporation (NERC). It is summarized in Table 1-1.
From Table 1-1, the main reasons of the large blackouts are either extreme natural events (hurricanes, ice storms, etc.) or cascading outages. Table 1.2 gives descriptive statistics for these data with and without the smaller events.
2
Table 1-1. The 15 Largest North American Blackouts and Their Causes, 1984-2006.
Date Location MW Customers Primary cause
1 14-Aug-2003 Eastern U.S.,
Canada
57,669 15,330,850 Cascading outage
2 13-Mar-1989 Quebec, New York 19,400 5,828,000 Solar flare, cascade
3 18-Apr-1988 Eastern U.S.,
Canada
18,500 2,800,000 Ice storm
4 10-Aug-1996 Western U.S. 12,500 7,500,000 Cascading outage
5 18-Sep-2003 Southeastern U.S. 10,067 2,590,000 Hurricane Isabel
6 23-Oct-2005 Southeastern U.S. 10,000 3,200,000 Hurricane Wilma
7 27-Sep-1985 Southeastern U.S. 9,956 2,991,139 Hurricane Gloria
8 29-Aug-2005 Southeastern U.S. 9,652 1,091,057 Hurricane Katrina
9 29-Feb-1984 Western U.S. 7,901 3,159,559 Cascading outage
10 4-Dec-2002 Southeastern U.S. 7,200 1,140,000 Ice/wind/rain storm
11 10-Oct-1993 Western U.S. 7,130 2,142,000 Cascading outage
12 14-Dec-2002 Western U.S. 6,990 2,100,000 Winter storm
13 4-Sep-2004 Southeastern U.S. 6,018 1,807,881 Hurricane Frances
14 25-Sep-2004 Southeastern U.S. 6,000 1,700,000 Hurricane Jeanne
15 14-Sep-1999 Southeastern U.S. 5,525 1,660,000 Hurricane Floyd
Table 1-2. Descriptive Statistics for the NERC Disturbance Data, 1984–2006.
All events
≥0 customers/MW ≥300 MW ≥50k customers
≥300 MW or ≥50k customers
Total number of events 856 278 321 438
Number of blackouts 547 258 304 406
Number after filling missing data
547 307 382 419
Number after adjusting for growth 547 317 373 413 Mean size in MW 524 1508 947 987 Median size in MW 86 634 300 385 Standard deviation in MW 2396 4034 3648 3285
Mean size in customers 164,483 321,984 430,585 317,372
Median size in customers 1323 85,228 149,500 94,643 Standard deviation in customers 689,815 1,106,958 1,075,888 939,638
3
From the reports of those blackouts [1], [2], and [3], cascading outage is a key factor leading to a large blackout. According to NERC, a cascading outage is “the uncontrolled successive loss of system elements triggered by an incident at any location [4]-[7].” Actually, sometimes the cascading outage is initiated by more than one disturbance. Some cascading outages may stop before they bring large influence to the system, while some of them bring disastrous results. According to N-1 or N-2 criterion, electric power systems are generally designed withstand single or double failure without causing the violation of any operating limit. Nevertheless, other possible outages, such as human errors or hidden failures in protection relays may enlarge the propagation of outages and lead to a cascading outage finally. Generally speaking, the component outages will cause the redistribution of the power flow and then cause the overload of other components even dynamic instability problems.
Cascading outage involves a large amount of complex mechanisms, which makes it more difficult to understand cascading outage fully. This subsection gives an overview on cascading outage from different perspectives and highlights its challenge for the analysis and modeling of cascading outages. 1.1.1 Major Causes of Cascading Outages
Basically, the causes for cascading outages can be divided into four categories [8]:
Nature disasters: Fire, lighting, wind/rain, ice storm, hurricane, Tornado,
earthquake.
Human activity: Operator error or inappropriate actions, or fail to take
actions, inappropriate setting for protection devices, intentional attack.
Unexpected component failure: Equipment failure or hidden failure.
System failures: Distance relays trigger the transmission line due to
overcurrent or under-voltage, voltage collapse, abnormal excitation in generators, abnormal speed in generators, generators tripped by
under-4
frequency, generators tripped by under-voltage, generator tripped by out-of-step, insufficient reactive power support, small signal instability. The first three categories are common outages that initiate the events, whereas the fourth category is failures that commonly enlarge the cascading. It is almost impossible to prevent the happen of the outages in the first and second categories with modern technology. However, most cascading outage blackouts involve the dependent outages in the third and fourth categories.
1.1.2 Procedure of Cascading Outages
According to [9], basically, the procedure of cascading outage can be divided into two phases, which are remarked by slow phase and fast phase.
For the slow cascade phase, the outages propagate slowly and have little influence on the stability of power system. The time interval for this phase ranges from several minutes up to several hours. Most outages in this phase are belonging to common problems and the operators cannot identify them easily. Thus the operators miss the chance to prevent the propagation of outages. Besides, some hidden failures may be exposed during this phase, which trigger some transmission lines and components [10].
During the fast cascade phase, power system becomes unstable. With the redistribution of power flow, the overloaded transmission components are triggered in a short time, they may cause voltage collapse, frequency collapse, and oscillations. Meanwhile, the dynamic instability may trip the generators, which lead to further load and generation imbalance and exaggerate the dynamic instability. It is almost impossible for systems operators to stop the propagation of the cascading during this phase manually. The time interval for this phase ranges milliseconds to tens of seconds [9]. Generally, the overloaded components such as transmission lines can still work for several hours under over-load conditions, and they can be reclosed if no other fault is found. However, when a large power swing happens in power system, the settings of distance relay of zone 2 or zone 3 may trip the transmission line with short time delay, and they will be acting so quickly that the system operator has no time to respond and reclose the line or
5
stop the cascading. Thus, the cascading starts tripping like a domino and eventually cause a large blackout.
Cascading phenomena are complicated because of the diversity of failures and the many different mechanisms by which failures can interact. There are varying modeling requirements and timescales (milliseconds for electromechanical effects and tens of minutes for voltage support and thermal heating). Combinations of several of types of failures and interactions can typically occur in large blackouts, including cascading overloads, failures of protection equipment, transient instability, forced or unforced initiating outages, reactive power problems and voltage collapse, software, communication, and operational errors. Therefore it is very difficult to analyze it through conventional power system analysis approaches and models. Many models and approaches have been proposed to try to consider those mechanisms [11-94]. Some models and approaches are utilizing complex network theory to investigate the relationship between the propagation of cascading outages and topological structure. Some are using stochastic approaches to consider the uncertainties in a cascading outage. Some are modeling dynamics of system to involve machine, voltage and frequency issues. High-level statistical models have also been proposed to estimate the average cascading outage propagation and blackout distribution sizes, which can provide useful suggestions for power system long-term planning. Interdependent infrastructures are modeled to analyze the interactions between power grids and cyber networks and study the propagation of cascading outage between different networks.
1.2 Modeling, Simulation, and Analysis of Cascading Outages
A large amount of models and approaches has been proposed in order to model, simulate, and analyze the cascading outages [11-94]. However, no existing model or approach can capture all the mechanisms during the cascading outage. Each model or approach can only focus on one or several aspects, while the information of the overall phenomenon is still needed in the simulation. In this
6
subsection, a brief review and summary of the state-of-art cascading outage analysis models and methodologies will be presented. According to their different perspectives and characteristics, those models and approaches can be divided into six categories:
High-level statistic approaches
Stochastic simulation approaches
Quasi-dynamic and dynamic simulation approaches
Network theory approaches
Interdependent approaches
Other approaches
Note that each model or approach may have characteristics which are involved in other categories. The classification in this thesis is based on its main feature and characteristic. This is just a rough classification and there are other classifications.
1.2.1 High-Level Statistic Approaches
This type of approaches investigated the process of cascading outage without considering the physics of power systems. For example, they may neglect the structure of power systems, times between different outages, and the diversity of power system components and interactions. They are very useful to understand cascading outage in more detailed models.
1) CASCADE Models
CASCADE model is an analytically tractable model based on load of the component [11]. It assumes a random initial load on all identical components and a given disturbance load on each component to initiate cascading. Some components may fail when load exceeds a certain threshold, where the load of other components will be redistributed, thus forming a cascading process. The cascading only stops when no overloaded component exists or the whole system fails. The redistributed formulas are much simpler when compared with detailed models that simulate detailed cascading failure mechanisms such as power
7
flows. It is easier to obtain the total number of component outages as well as the probability distribution of the blackout sizes. The model shows how system loading affects the risk of a cascading failure [12]. When there is low load level, the tail part of component failures is approximately exponential. The probability of a large cascading outage is also low. However, when a critical loading level is exceed, the distribution of the component outages follows the power law and the risk of a large blackout increases significantly. This model is good for understanding the general property of cascading outages but it ignores all physical properties of power systems.
The above model is modified further and applied to analyze several factors related to cascading outages. The cascading motor stall has been analyzed with the CASCADE model in [13]. Reference [14] showed a high risk on voltage collapse when a failure triggered a cascade of motor stalling. [15] has analyzed the power system reliability by using a modified CASCADE model, the time of outage propagation is also considered in [15].
2) Branching Process Models
Branching process model can be regarded as an improved CASCADE model and it is widely used in the theory of probability [16]. This model has been used in many areas such as Y chromosome transmission in genetics disappearance of surnames in genealogy. [17] first introduced this model to the analysis of cascading outages. Based on them, some improvements have been made in [18-20], they mentioned the importance for applying the branching process models. More recently, some new applications based on such models can be found in [21], and [22].
Each individual component outage affects the outages in the next stages interdependently according to a given distribution in the branching process model. The results in [23] have shown that the probability distribution of outages from a branching process can match with the simulated CASCADE model as well as the historical data. The computation speed to estimate the propagation and distribution of the size of blackout is faster by using the branching process model.
8
[24] has investigated the influence of topology on the average propagation of cascading outages in power system with this model. A novel and systematic approach to discretize the data of load shed has been introduced by [25] and the Galton-Watson branching process with a Poisson offspring distribution can be used. Further, a multi-type branching process [26] has been applied to analyze the statistics and interdependencies of cascading outages. The probability distribution of load shed, the isolated buses and their conditional largest possible total outages can be predicted by this model. This model needs few samples of cascading outages to realize relatively accurate estimation but the disadvantage of this model is that it lacks detailed mechanisms of the cascading outages in power systems. It can only estimate the blackout size distribution of cascading outage. From the perspective of operation, real time prediction and mitigation of cascading outages cannot be realized with this model.
3) Interaction Model
Reference [27] proposes a power system’s interaction model that is constructed based on a database of cascades from either historical events or simulations. That interaction model extracts key information on cascading outages of the power system, quantifying how interactions between component failures influence the risk of cascading outages and capturing general propagation patterns of cascades. Thus, scenarios of cascading outages can be simulated and analyzed quickly and effectively in a time-intensive environment only using that interaction model for prediction of their propagations and mitigation actions without need to conduct time-consuming simulation of the original power system model. Thus, the interaction model if available for a power system can readily fit into real-time operation for operators’ situational awareness and decision support.
1.2.2 Stochastic Simulation Approaches
A cascading outage can be described by a sequence of deterministic and stochastic events. For example, based on simulations, the features of cascading
9
outages can be reproduced basically if we tune the parameters affecting the simulation for well-studied power systems. However, it is another matter entirely to be able to predict or simulate the events of a cascading outage before it happens. However, cascading outage will rarely proceed as you expect. Due to the large uncertainties that initiate and exacerbate the cascading, the stochastic simulation, also known as probabilistic simulation is necessary since it can try to consider all possible factors. Moreover, some factors such as the misoperation because of human error and transmission lines that contact over grown trees due to relatively high current flow are very hard to be modeled in the simulation. It is thus essential to use stochastic approaches to simulate more possible events.
1) Markov Chain Models
A Markov chain is a type of stochastic process used to describe a system that follows a chain of linked events [28]. It is utilized to model the stochastic factors in cascading outage of a power grid, such as hidden failure or misoperations. The result of this model can be used as an evaluation of overall probabilities of all states that depicts the cascading outage. The model can normally have a large size.
In reference [29], a stochastic Markov chain model has been introduced. The model was based on power flow redistribution. It took into account the uncertainties in the load setting, generation and line flows. The model also captured the cascading events with regard to real time signals. The critical components have been identified using the metrics provided. Reference [30] presented a network-based Markov chain model to study the propagation dynamics of the entire power networks. Robustness of the power network has been analyzed through the model. An extended Gillespie method was adopted in the model [31]. It also showed that small-world network structure would propagate cascading outage more widely and rapidly compared with a regular power network. A Markovian tree-based multi-timescale cascading outage simulation model has been provided in [32], aiming at risk assessment of cascading outage. The paper also proposed a novel forward-backward
10
Markovian tree search scheme based on a risk estimation index. In [33], the author introduced a continuous-time Markov chain approach modeling the system dynamics. The model considered loading level, error in transmission-capacity estimation, and constraints in performing load shedding. It also allowed real-time prediction of blackout evolution probability. Recently, an influenced graph model using Markovian chain was described in [34]. Large amounts of data from cascading outage simulations were synthesized into a Markovian network model. The distribution of the cascading outage results achieved from this model matched those from cascading outage simulators. A methodology based on this model has been demonstrated to identify the probability of risk when a component was upgraded in the power system.
2) PRACTICE Models
A useful stochastic simulation approach of cascading outages has been proposed in [35]. In this model, “single-path” mode and “multi-path” mode are used. Single-path mode allows uncertainties only relevant to the initial events, after which the system will behave “as expected” during the cascading. Multi-path mode can simulate uncertainties and the response from protection systems, through the whole procedure during the cascading. The hidden failure probabilistic model, the overcurrent relay probabilistic model and the event tree-based probabilistic cascading approaches was adopted in the techniques. The model was tested on Italian EHV transmission grid and a comparison was made with a detailed overload-based dynamic time domain simulator. It showed that the results obtained from the model and the dynamic time domain simulator can match well with each other at least for the slow cascade phase [36].
1.2.3 Quasi-Dynamic and Dynamic Simulation Approaches
Dynamic simulation approaches are similar to conventional methodologies that focus on power system dynamic characteristic analysis, while the difference is that conventional methodologies are hard to simulate interactions under multi-contingency cases during the cascading outage. New dynamic simulation models
11
perform well on capturing some specific system dynamics during the cascading. In addition, most mechanisms can be included in dynamic simulation models under a variety of outages so that a relatively accurate prediction can be made. However, due to the large amount of details to be taken into consideration, the computation speed will be challenging. Right now, such models will mainly contribute to deeply understanding the cascading outage mechanisms rather than real time prediction and analysis for industrial utilization.
1) OPA Models
The researchers from Oak Ridge National Laboratory (ORNL), Power System Engineering Research Center of Wisconsin University (PSerc) and Alaska University (Alaska) proposed this ORNL-PSerc-Alaska (OPA) model [37]. It is DC power flow-based model. This model contains two parts: fast dynamic process and slow dynamic process. Slow dynamic process is utilized to simulate the evolution of power gird such as generation growth, load growth and transmission capacity limits upgrade. The fast dynamic process is often used to simulate outages and cascading overloading. In this model, a re-dispatch model DC-OPF based on linear programing is used to adjust the generation and load. The cost function has been taken into consideration to avoid unnecessary load shedding. This model described a simplified dynamic process of cascading outages and can be used to investigate the self-organization of power systems. This OPA model was validated on a 1553-bus WECC network and the simulation results were compared with historical WECC data with an acceptable approximation [38]. The disadvantage of this model is that it cannot provide an accurate simulation on real outages of power systems and it only focus on the limited parts of cascading outages such as overloading.
An improved OPA model [39] has been proposed to improve the limitations found in the original model. This improved OPA model has considered more important factors such as dispatching, communication, protection relay, planning, and operation mode. Two indices have been proposed to quantify the cascading outage risk from the perspective of statistics, i.e. Value at Risk (VaR)
12
and Conditional Value at Risk (CVaR). Then this model was validated on the Northeast Power Grid in China.
Another AC OPA model has been proposed by [40]. This model contains two dynamic processes: fast dynamics and slow dynamics. Fast dynamics involve series blackouts. Slow dynamics can reflect the time evolution of power systems. This novel AC OPA model can be used to analyze the voltage stability of power systems and it is tested on the IEEE 118-bus power system and the results showed that the ratio of total load to system transmission capacity can explain SOC of power systems. This model has been modified in [41] further and considered slow process such as tree contact and line outages due to line heating into the simulation of cascading outages. Utility vegetation management was also considered in this model.
2) Multi-Timescale Quasi-Dynamic Model
The multi-timescale quasi-dynamic model has been proposed in [42]. This model enabled the consideration of different timescales involved in the process of cascading outages which cannot be simulated by the existing approaches. The simulation of cascading outages with representation of time evolution can be realized. Three categories of timescales: short-term scale, mid-term scale, and long-term scale are modeled. Meanwhile, this model can consider some dynamics such as load variation and generation excitation protection. An improved re-dispatch model has been proposed because that transmission loading relief (TLR) and re-dispatch normally took 10–30 min [43]. The above improvements enabled more accurate simulation of cascading outages. This model was tested on IEEE 30-bus power system to study the role of generation protection. The model was also demonstrated on a reduced 410-bus US-Canada northeast power grid. The results showed that the simulated event can match
well with the blackout event happened in 2003.
13
Manchester model was proposed by the University of Manchester [44]. It is based on AC power flow. A wide variety of mechanisms related to cascading outages such as hidden failures, generator instability, under-frequency load shedding (UFLS), emergency load shedding and re-dispatch of active and reactive power were considered in this model. Monte Cardo simulation was used for the risk of assessment of cascading outages with this model. Other research [45-47] extended the Manchester model to study the mitigation strategies for cascading outages and assess the cost of blackout.
4) TRELSS Model
Transmission Reliability Evaluation of Large Scale Systems (TRELSS) is another commercial platform for the simulation and analysis of cascading outages [48]. It is developed by EPRI and Southern Company Services. This model can simulate the cascading outage as a sequence of quasi-steady state system conditions based on AC power flow which are triggered by the tripping outages. The actions of breakers have been modeled by the Protection and Control Group (PCG). The model was tested on Western Interconnection power system [49] to identify the most severe initial outages.
5) ASSESS Model
ASSESS is developed by Reseau de Transport d’Electricite (RTE) in France and it is a commercial platform for the simulation and analysis of cascading outages [50]. This platform is quite flexible for letting many uncertainties to be considered. Four blocks have been provided by this model such as quasi-steady state simulator that could model dynamics of systems [51], security-constrained AC optimal power flow [52], time-domain simulator that could model many control actions such as governors and zone 3 protection relay [53], and the access to some tools for the statistical analysis of samples of cascading outages. ASSESS provided a wide range of models including sequences of events, protection settings, line ratings, fault clearance time, etc.
14
The disadvantage of this model is that it requires a large amount of data and the computation speed is still challenge with this platform.
6) Dynamic PRA Model
A two-level dynamic probabilistic risk assessment (PRA) model was introduced in [9]. The proposed model divided the process of cascading outage into two phases and two different models were used in the two phases. The influences some factors such as variation of cross-border power flows, maintenance and shut-down of power plants, and the penetration of wind power on cascading outages were investigated. This model was tested on New England Test System (NETS) and New York Power System (NYPS) 69-bus test system. It was found from the results that the thermal effects can contribute to cascading outages.
An improved PRA model was introduced in [54] further. Two decomposition models were used to analyze the fast phase and slow phase of cascading outages, respectively. The frequency and the influence of severe cases can be estimated with this model. The scenarios can be classified with a clustering method so that the dynamic analysis was manageable from a computational perspective. The dynamic models of generators were considered in [55].
7) COSMIC Model
A novel nonlinear dynamic model for the simulation of cascading outages has been proposed in [56]. It is called Cascading Outage Simulator with Multiprocess Integration Capabilities (COSMIC). COSMIC was able to simulate power system with a set of hybrid discrete and continuous differential algebraic equations, as well as protection systems and machine dynamics. The model involved a wide variety of mechanisms including rotating machines, exciters, governors, power flows using nonlinear power flow equations, load voltage responses, discrete changes (e.g. components failure and load shedding) and etc. COSMIC used a recursive process to compute the differential algebraic
15
equations, which represented various mechanisms. Four kinds of loads, i.e. constant power (P), constant current (I), constant impedance (Z), exponential (E), or any combination of them (ZIPE) have been modeled [57]. The results obtained from COSMIC model were compared with that from PowerWorld on IEEE 9-bus power system [58]. Another simulation has been made and the results were compared with a simple dc power-flow QSS model. The cascading processes had good consistency during the early stage between two models, while the simulation was substantially different during later stages.
1.2.4 Complex Network Theory Approaches
Many literature and researches focus on the propagation of cascading outage in complex networks that is partially inspired by the propagation of failures and congestion in Internets [59], [60], [61]. From the statistically results, it is found that power girds have the characteristics of power laws and criticality, which suggests the strong connection between the statistical characteristics of the topology of the network and the dynamics of cascading. The models consider flows of discrete packets that are injected and removed from all nodes and transfer the packets along the shortest distance paths between any two nodes. The criticality of links or nodes can be quantified by the concept of “betweenness”. It is proportional to the number of shortest distance paths through the link or node. Based on complex network theory, these models abstract the power grid as undirected network or directed network which is consisting with vertexes and edges to study the statistical characteristics of power grids. These models are very different from the power system models. Cascading phase transitions and the vulnerability of network have been studied in [62], [63], and [64]. It was found that the typical power girds are small-world networks in [65]. Later, some researches have studies power grids based on complex network theory by considering more properties and characteristics of power girds. By considering the electrical distances in power systems, it was found that the power systems have a scale free structure [66]. Topological graph concept has been proposed that was more consistent with the patterns of power
16
system generation and load [67]. An “influence model” has been introduced in [68]. It is a tree network that representing the influences between idealized components abstractly. Components can be failed or operational according to a Markov model that represents both internal component failure and repair processes and influences between components that cause failure propagation. A Markov model has been proposed for nodal components in [69], it was found that the outages can propagate along the transmission lines of power networks with a fixed probability.
1.2.5 Interdependent Approaches
Analysis of interdependent networks has been done for many years in various areas [70]. With the increased coupling between power grid and cyber or communication network, the risk between the interdependent networks also increases. The possible outages of control systems connecting to the cyber networks such as SCADA can contribute to the propagation of cascading outages between interdependent networks. At the same time, cyber attack is happening frequently in the environment of smart grid [71]. The typical event happened in Ukraine in 2015 [72]. The attack on the cyber network caused the SCADA distribution management system to be controlled remotely and some substations were disconnected for several hours. This attack brought much influence to many areas in Ukraine. With the coupling between power grid and cyber network, one outage in cyber network may propagate to power grid and cause the devices and equipment in power grid to be out of function. Risk assessment for interdependent networks has been studies in some researches [73-77]. It is still a big challenge since many mechanisms are involved from power grid and cyber network.
1) Complex Network-Based Interdependent Models
In real world, there are many interdependent infrastructures. We are familiar with some of them such as economic, transportation, and Internet networks. Complex network theory has been widely used in the study of these
17
areas [78-79]. The coupling between power grid and cyber network has caused much attention [80]. Some researchers begin to investigate the interdependence between power grid and cyber network with complex network theory.
An interdependent model has been introduced in [81], which was used for the analysis of robustness of interdependent networks with the propagation of cascading outages. This model was tested on a power grid and an Internet network involved in Italy blackout happened in 2003. The results showed that by removing a set of critical nodes, the cascading outage would be triggered in the two interdependent networks and caused a complete fragmentation finally. An analytic solution can be obtained with this model. An improved interdependent model was proposed in [82], it was used to analyze the robustness of power gird with random multiple support-dependence relations. The test results showed that the similar conclusion can be obtained from the interdependent networks when compared with that from the single networks. An interdependent model was introduced in [83], it was used for designing some strategies to mitigate the propagation of cascading outages in interdependent networks. The model was tested on a power grid and an Internet network involved in Italy blackout happened in 2003. It was found that the cascading outage in interdependent networks can be suppressed by selecting a small number of autonomous nodes. The above models are useful to study the general and overview property of interdependent networks but they fail to consider properties of power gird such as Kirchhoff laws. Some electrical properties have been considered in the coupling model proposed in [84], and the model considered power grid and the supporting Control and Communication Network (CCN). For power gird, substation and generator were considered. For CCN, the router was considered. The minimum number of nodes from both networks was calculated whose fail can totally destroy the interdependent networks. A new interdependent model was proposed to involve there networks, i.e. power grid, communication network, and interdependency network [85]. A sensitivity analysis was performed to evaluate the mitigating method in the model. More recently, a more
18
comprehensive model has been proposed in [86]. The model used a mesh network that considered power system characteristics. Moreover, bidirectional links including data uploading and command downloading channels were modeled. These links were supposed to connect all cyber network nodes as well as a corresponding physical node in power grids. The fragility of the coupling model has been studied under various cyber-attacks, such as denial-of-service (DoS) attacks, replay attacks and false data injection attacks. Load shedding and relay protection have been involved in the model.
2) Flocking-Based Hierarchical Cyber-Physical Models
A hierarchical cyber-physical multi-agent model of smart grid based on flocking theory has been presented in [87-88]. The model considered dynamic nodes (generators in this model), PMU and local cyber-controller. The frequency, phase angle and other related parameters were involved in the generators which were regarded as physical parts. PMU and local cyber-controller served as cyber elements. The model concentrated on control strategies for robustness and resilience of a coupling system. The potential performance improvement has been tested using New England 39-bus power system with various faults and communication delays.
3) Inter-Dependent Markov Chain Models
A probabilistic cascading outage analysis framework was provided by the Inter-Dependent Markov Chain (IDMC) model to study the effects of interdependencies among power grid and physical networks. The IDMC was introduced by [89] and it demonstrated that interdependencies between two systems can affect each other on distribution sizes of outages significantly. The results also showed that systems with exponentially distributed outages sizes tend to be less robust as evidenced by the power-law distributed outage sizes for the two networks. It assumed that the communication network was more vulnerable when an outage occurred, which would increase the probability of
19
outage in power grid. It was also found that when power system components failed, it may trigger cyber networks as well with a given probability.
1.2.6 Other Approaches
1) Potential Cascading Models
Physical and Operational Margins (POM) is based on AC power flow. The Potential Cascading Models (PCM) is an integrated function of POM [90]. With the initial events, the following events can be simulated with this model. For selecting the initial events, cluster approach was used to select the N-1 or N-2 contingencies. This model was tested on US 2007 Eastern Interconnection model with summer peak load. The previous manually analysis was consistent with the result obtained. And some unidentified potentially cascading-initiating possibilities were found. The model used the same data to test remedial actions in [91]. The remedial actions such as active and reactive power dispatch, phase-shifter adjustment, and transformer tap change, emergency load shedding, line switching, and reactor and capacitor switching were applied at each stage during the process of cascading outage until the propagation of cascading outage has been fully mitigated [92]. It showed that all identified potential cascading outage can be stopped using the proposed remedial actions.
2) Historical Data-Based Models
The main purpose of historical data-based models was to reproduce the history blackout events with accurate approximation. The models can be modified if there is obvious mismatch between the real disturbance data and reproduced results. This model would be very helpful for deeply understanding the blackout and cascading outages. An event was simulated and reproduced by using Electric Power Research Institute (EPRI) ETMSP models [93]. The tested event happened on August 10, 1996, the location is in western North America. Around 7.49 million people were affected with loss of 30,390 MW of load. In this study, the standard WSCC dynamic data was used to reproduce the simulation result for this event, however, the result was far away from the real data. Some
20
modifications were made on the data and models and then the simulation results could match well with the real data. Many factors that contribute to cascading outages need to be considered in the simulation and analysis of cascading outages. However, historical data-based models may not be the best models to analyze the cascading outage.
3) Hidden Failure Models
Hidden Failure model has been proposed in [94] and hidden failure plays important role to the propagation of cascading outages. With the propagation of outages, there will be overloaded line in the power system and the lines connecting to the overloaded line are exposed to the unexpected tripping. Generally, hidden failure model is based on DC power flow. The influences of critical factors such as hidden failure probability function, spinning reserve capacity, system load level, and power flow distribution were investigated. Critical protection relays in the power system can be identified by fast simulation and random search. The model was tested on WSCC 179-bus power system with mitigation approaches and risk assessments being studied.
The comparisons between different models and approaches are
summarized by Table 1-3 [95].
Table 1-3. Comparison of the Models and Approaches of Cascading Outages.
Models Advantages Disadvantages
High-Level Statistic Approaches
CASCADE Models
Failure probability is related to load level.
Ignores all details of cascading. Branching
Process Models
Can be regarded as an improved CASCADE model.
Consider each failure component from early stages through a given distribution. Interaction
Model
Quantify how interactions between component failures.
Probabilistic method to generate new samples of cascading outages.
Stochastic Simulation Approaches
PRACTICE Models
“Single-path” mode and “multi-path” mode introduced.
Event-tree-based approach adopted.
Fail to consider dynamic instability and cascading details. Markov Chain Models
Non-locally propagation illustrated. Enable quantitative risk assessment. Simple and tractable.
21
Table 1-3. Continued.
Models Advantages Disadvantages
Quasi-Dynamic and Dynamic Simulation Approaches
OPA Models
Take into consideration the effects of dispatching, automation, communication, relay protection, operation mode and planning.
Tree contact, failure of lines due to line heating, and UVM modeled.
Slow simulation. Detailed power system data required. Multi-timescale Quasi-Dynamic Model
Employ quasi-dynamic approach. Approximate time evolution considered. Improved re-dispatch simulation. Manchester
Models
AC power flow adopted.
Monte Carlo methods are applied to risk assessment.
TRELSS Model
Take into account actions of breakers. Voltage problems modeled using quasi-steady state AC power flow.
ASSESS Model
Security-constrained AC optimal power flow provided.
Using quasi-steady state simulator to model dynamics of system.
Modeling controls in system through full time-domain simulator.
Dynamic PRA Model
Two levels of cascading outage simulated using two different models. COSMIC Model
Consider non-linear dynamic mechanisms.
Various load and relay modeled. Complex
Network Theory Approaches
Topological Models
Quickly discover the unexpected emergence of collective behavior.
Lack of electrical features of power systems. Interdependent Approaches Complex Network-Based Interdependent Models Interdependencies depicted.
Computer and cyber risks considered.
Difficult to validate. Detailed mechanisms ignored. Flocking-Based Hierarchical Cyber-Physical Models
Frequency, phase angle, and other related parameters involved. Control strategies provided. Inter-Dependent
Markov Chain Models
Enable a system-level prediction with tractable details of the system. Dynamic nodes, PMU and local cyber-controller modeled. Other Approaches Potential Cascading Models
“Cluster” approach employed. Aim at predicting potential cascading
outages. Focus only part
of cascading outage mechanisms. Historical
Data-Based Models
Accurately reproduce history events. Complementary to existing models. Hidden Failure
Models
Hidden Failure and generator re-dispatch considered.
22
1.3 Contributions of this Work
The main challenges for the modeling, simulation and analysis of cascading outages are:
1) The detailed process of cascading outages in a power system cannot be captured accurately by existing steady-state approaches due to ignoring dynamics under outages and control actions. Although dynamic simulation can provide more detailed dynamic information but its major drawback is intense time consumption for large system models. Also, existing power system models are not validated well for mid-term or long-term power system simulations over an extended time period of tens of minutes to several hours, which, however, are the typical time spans for the whole process of cascading outages. Thus, power flow based steady-state or quasi-dynamic simulation models are acceptable for representing the cascading process at least for the early stage of cascading outages since transient behaviors of a power system fade away and system often reaches its steady state quickly. Therefore this thesis focuses on the development of steady-state approaches for the modeling, simulation, and analysis of cascading outages that are able to provide important insights on dynamic behaviors of the system under outages and control. The existing steady-state approaches for cascading outages are mainly for offline analysis. This thesis will target at online simulation and analysis of cascading outages for proactive mitigation control against a power blackout.
2) Frequency is an important indicator of the real-time balance between active powers of the generation and load in a power system, especially during cascading outages. Abnormal frequency may trigger under-frequency load shedding (UFLS) and generator frequency protection, causing a large amount of loss in generation and load, so it is a significant contributing factor of cascading outages and blackouts. However, frequency is seldom considered yet in existing steady-state approaches for the simulation and analysis of cascading outages.
23
This thesis introduces the system frequency deviation into the power flow model so that frequency-related outages and control actions can be simulated.
3) Various remedial and emergency actions, including load and generator tripping, excitation controls, and intentional islanding, are deployed to prevent cascading blackouts. The intentional or active islanding method is a good way for mitigation of cascading outages. The computational efficiency of these methods is the remaining challenge.
The main focus of this thesis is for the three challenges mentioned above. The contributions of this thesis are summarized by:
1) The framework of a multi-layer interaction graph is proposed for the monitoring and mitigation of cascading outages. This multi-layer interaction graph can be constructed offline based on a large number of samples of cascades with detailed stated-state models. It can be used online for monitoring and mitigating cascading outages.
2) A novel steady-state approach for the simulation of cascading outages is proposed considering frequency. By using this approach, the propagation of cascading outages can be captured more accurately.
3) An online strategy of critical component-based active islanding is proposed that isolates outages within a designed area so as to reduce the cascading outage risk of the system.
24
CHAPTER TWO
MULTI-LAYER INTERACTION GRAPH FOR SIMULATION
AND ANALYSIS OF CASCADING OUTAGES
2.1 Introduction
The high computational complexity for simulation of cascading outages cannot meet the requirements for online applications. Thus, an advisable approach for online analysis and mitigation of cascading outages would be utilization of a high-level model that is established offline directly from a comprehensive database on historical or simulated cascading events. The “influence model” which is a tree network is proposed to quantify the influences between the components of network [68]. Similar to this general idea, [96] quantifies the interactions between transmission lines by line interaction graph in order to analyze cascading failures. Ref. [27] constructs an interaction network from a database of cascade outages to capture key components and key links between component outages that play critical roles in outage propagation. The interaction network is useful for understanding the general patterns of outage propagation and has potentials in online applications. Then this interaction network can be combined with online monitoring and mitigation of cascading outages. The valuable information extracted from the samples of cascading outages includes the outage components involved, propagation paths of outages, amounts of load shedding, geographic distances between two outages, etc., which if presented together can provide system operators with a comprehensive picture on the propagation patterns of outages and take effective control actions. This chapter first demonstrates the application of the interaction model and interaction graph to a realistic Northeastern Power Coordinating Council (NPCC) power system in Section 2.2 [97]. Then this chapter proposes a multi-layer interaction graph [98] as the extension and generalization of the single-layer interaction network in [27]. Different from that interaction network, this
multi-25
layer interaction graph integrates multiple layers that respectively identify the key intra-layer links and components in each layer contributing the most to outage propagation from various perspectives, e.g. the number of line outages, the amount of load shedding and the electrical distance on outage propagation. Besides, key inter-layer links that connect components from different layers are also defined to model the transition from one type of consequences to another type. All the key intra-layer links and components and key inter-layer links and components together provide comprehensive information on the dominant outage propagation patterns, based on which effective mitigation measures can be further developed. Section 2.3 introduces the proposed multi-layer interaction graph and the method for identifying key intra- and inter-layer links and components. Section 2.4 proposes multiple strategies to mitigate the propagation of cascading outages and validates the proposed multi-layer interaction graph. Section 2.5 proposes a method to determine the minimum number of samples of cascading outages needed for constructing a reliable multi-layer interaction graph. Section 2.6 demonstrates the multi-layer interaction graph obtained from a simulated database of cascading outages on a Northeastern Power Coordinating Council (NPCC) 48-machine 140-bus system. Finally conclusions are drawn in Section 2.7.
2.2 Demonstration of Interaction Graph and Interaction Model on
the NPCC Power System
2.2.1 Original Cascades and Simulated Cascades
In this chapter, “original cascades” are the cascading outage sequences from utilities or generated by detailed cascading outage models while “simulated cascades” are the cascading outages sequences produced directly by the interaction model that is built from “original cascades”.