* Corresponding author. Tel: +919861394573 E-mail: [email protected] (K.D. Mohapatra)
© 2017 Growing Science Ltd. All rights reserved. doi: 10.5267/j.ijiec.2016.9.002
International Journal of Industrial Engineering Computations 8 (2017) 251–262
Contents lists available at GrowingScience
International Journal of Industrial Engineering Computations
homepage: www.GrowingScience.com/ijiec
Comparison of optimization techniques for MRR and surface roughness in wire
EDM process for gear cutting
K.D. Mohapatraa*, M.P. Satpathya and S.K. Sahooa
aDepartment of Mechanical Engineering, National Institute of Technology, Rourkela, India
C H R O N I C L E A B S T R A C T
Article history:
Received February 4 2016 Received in Revised Format August 16 2016
Accepted September 8 2016 Available online
September 8 2016
The objective of the present work is to use a suitable method that can optimize the process parameters like pulse on time (TON), pulse off time (TOFF), wire feed rate (WF), wire tension (WT) and servo voltage (SV) to attain the maximum value of MRR and minimum value of surface roughness during the production of a fine pitch spur gear made of copper. The spur gear has a pressure angle of 20⁰ and pitch circle diameter of 70 mm. The wire has a diameter of 0.25 mm and is made of brass. Experiments were conducted according to Taguchi’s orthogonal array concept with five factors and two levels. Thus, Taguchi quality loss design technique is used to optimize the output responses carried out from the experiments. Another optimization technique i.e. desirability with grey Taguchi technique has been used to optimize the process parameters. Both the optimized results are compared to find out the best combination of MRR and surface roughness. A confirmation test was carried out to identify the significant improvement in the machining performance in case of Taguchi quality loss. Finally, it was concluded that desirability with grey Taguchi technique produced a better result than the Taguchi quality loss technique in case of MRR and Taguchi quality loss gives a better result in case of surface roughness. The quality of the wire after the cutting operation has been presented in the scanning electron microscopy (SEM) figure.
© 2017 Growing Science Ltd. All rights reserved Keywords:
Dedendum Desirability Gear
Surface roughness Taguchi orthogonal design Wire tension
1. Introduction
interference, Undercuttingis done. In a pair of meshing spur gears, the width of the gears along the line of contact is parallel to the gear axes and it shifts its position along the tooth profile curve from top to bottom region of tooth height during the course of action (Maitra). In the recent years, gear technology has gained a wide acceptance in different aspects of engineering.
Wire electric discharge machining is one of the most accurate, precise and most popular machining process in non-traditional machining process (Hsue & Su, 2004). It is basically a non-conventional machining process to manufacture complex or hard materials that are electrically conductive and difficult to manufacture. It has the ability to cut intricate and complex shapes with a better precision, accuracy and provides a good surface finish. In wire EDM process there is no direct contact between the work-piece material and the tool material, therefore the material of any hardness can be machined by this process as long as it is electrically conductive (Bamberg & Rakwal, 2009). The material removal occurs by continuous spark discharges at the gap between the tool electrode and the work-piece material connected in an electrical circuit. The dielectric fluid, mainly distilled water provides a cooling effect, is continuously supplied to flow away the cut debris. The sparks caused by the dielectric medium give rise to the temperature in the work-piece material near the point of interaction. The temperatures are high enough to melt and vaporise the metal in the area of electrical discharges (Dauw & Albert, 1992). The wire used is mainly a brass wire, is continuously supplied from the spool through the work-piece and diameter of the wire ranges from 0.1 mm to 0.3 mm (Speeding & Wang, 1997). Due to the variation in the dimensional accuracy, the wires once used cannot be reused again and it is collected at the bottom of the collection tank (Bovina et al., 1991). In wire EDM, brass, tungsten, copper, aluminium and zinc coated brass are widely applied as tool electrodes. However WEDM is vital machine tool and finds its application in aerospace, nuclear, tool and die making industries, automobile, computer and electronics industries.
2. Literature review
K.D. Mohapatra et al. / International Journal of Industrial Engineering Computations 8 (2017)
From the past literature it can be seen that less work has been carried out on optimization in wire EDM process and very few experiments have been conducted in manufacturing of gears. No work has been carried out in comparing the optimization technique for the best suitable parameters in gear cutting process using wire EDM. So the present paper focuses on both experimental and optimization method to show the parameters affecting the output responses by comparing both the techniques.
3. Design of Experiments and Experimentation
3.1 Gear Geometry
The gear figure is obtained from the suitable software by giving the required number of teeth and pitch circle diameter. The gear has an addendum diameter of 81.66 mm, dedendum diameter of 55.4 mm, tooth width of 9.1 mm and a base diameter of 65.7 mm. 12 teeth were obtained from the gear and each tooth is cut with one set of parameter repeated once. A total of twelve outputs have been obtained for twelve different runs. Table 1 depicts the gear specifications chosen for the experiment.
Table 1
Gear specifications used for machining of gear
3.2 Role of copper in manufacturing of gears
Copper is malleable that is it can be shaped and bent without cracking. Copper is corrosion resistant and it offers high strength the gear. Copper gear is easy to machine and or alone it can be used to make gears. Bronze with copper provides high strength and low friction which is widely used for power gears. Copper is a good conductor of electricity, hence copper gear results in spark proof starting of the engines. Copper gears can also help oil pumps to convey fluids with very little flash points such as benzene and gasoline for transportation of various oils such as diesel, petroleum and lubricant oils at a temperature below 70°C. Copper gears are used in semiconductor industries in clocks, paper making, radiators, aerospace, printing and mining industries, trucks, electric motors and air brakes. Several researches have been attempted previously, and the authors have concluded that the wire EDM is capable of producing high quality miniature gears.In this present study, more control factors were taken in order to improve the better accuracy of results.A total of 12 sets of experiments i.e. L12 were carried out by taking 5 factors and 2 levels each. The design of experiments consists of input factors like Pulse on time (TON), Pulse off time
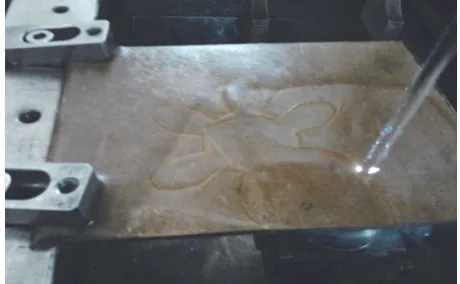
(TOFF), Wire feed rate (WF), Wire tension (WF) and Servo voltage (SV). Fig. 1 shows a copper plate being
cut by a wire EDM machine in the shape of a gear.
Fig. 1. A gear cut shaped copper plate using Wire EDM
Gear specifications Gear Constraints
Profile Involutes
Number of teeth 12
Pressure angle 20°
Since there are 2 levels and 5 input parameters, different optimization technique can be used to optimize the process parameters. However Taguchi quality Loss and desirability with Grey Taguchi optimization method has been chosen in order to compare the optimization to find out the optimal setting for MRR and surface roughness. Based on the literature review and based on the assumptions that each process parameter is independent in this experiment, Taguchi function was used.
Table 2
Selection of parameters and ranges for gear cutting operation
Input Parameters Symbol Unit Level
I II
Pulse on time TON µs 112 116
Pulse off time TOFF µs 57 61
Wire feed rate WF m/min 4 5
Wire tension WT kg-f 6 7
Servo Voltage SV v 20 30
Table 2 depicts the different input parameters and values taken at different levels. The ranges were chosen according to the machine constraints and literature reviews. The range of Pulse on time is chosen a low of 12 µs and a high of 16 µs, where 1 is the Equi-energy Pulse mode setting of the machine. Similarly Pulse off time varied from 57 and 61 µs.The cutting operation is done by using a CNC ECOCUT wire EDM machine using dielectric as distilled water.The present work is carried out by using a thick rectangular copper plate of 10 cm length and width having 3 mm thickness. The combinations of process parameters obtained were experimented and the output parameters i.e. MRR and surface roughness were calculated for 12 different readings. Table 3 shows the different fixed input parameters taken for machining of gear operation.
Table 3
Fixed parameters used in the experiment
3.3 Determination of MRR and surface roughness
In wire EDM, the material is removed from the work-piece by a series of sparks from electrical discharge. In the present study, the material removal rate was calculated by taking cutting speed (VC), diameter of
the wire (k) and work-piece thickness (h) into consideration. In wire EDM, the material removal is more if the spark is increased. It is always good to maximize the MRR. MRR is expressed in terms of mm3/min.
The material removed in wire EDM is given by the formula
(1)
Cutting speed is calculated by taking length of the wire and time into consideration. The cutting length is determined from the wire EDM machine. The cutting speed is expressed as mm/min. The cutting speed is given by the following formula
60 (2)
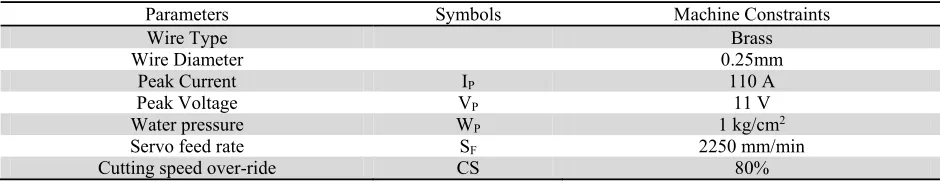
Parameters Symbols Machine Constraints
Wire Type Brass
Wire Diameter 0.25mm
Peak Current IP 110 A
Peak Voltage VP 11 V
Water pressure WP 1 kg/cm2
Servo feed rate SF 2250 mm/min
K.D. Mohapatra et al. / International Journal of Industrial Engineering Computations 8 (2017)
where l is the length of the cut wire in mm and t is the time of cut in second. The surface roughness (Ra) in wire EDM is an important output parameter, however wire EDM machine provides a good surface finish during machining operation. The roughness during the cut depends upon the input parameters setting control in the machine. For example increase in the Pulse on time may result in increase in spark, and may lead to bad surface finish. However it is important to minimize the surface roughness in order to get a good surface finish. In the present study, the roughness is calculated by using a Talysurf instrument. The roughness of the surface was measured two times on both the left flank and right flank of the gear on its lay and their average was taken in order to calculate the surface roughness for this experiment.
4. Analysis of the experimentation
In the present experiment, L12 orthogonal array was carried out for 2 levels and 5 factors for determining the MRR and surface roughness. However the statistical analysis was divided into three phases. In the first phase, MRR and surface roughness was calculated. The second phase consists of determination of ANOVA in order to know the significant factors for each machining response. The final phase is to optimize the responses to know the best combination. Table 4 depicts the output responses obtained during each set of machining operation.
Table 4
Taguchi L12 array and output results obtained for MRR and Surface roughness
Input Parameters Output Responses
SL Number TON TOFF WF WT SV MRR Ra
1 112 57 4 6 20 2.43 2.05
2 112 57 4 6 20 2.44 2.2
3 112 57 5 7 30 2.52 2.0
4 112 61 4 7 30 2.01 2.05
5 112 61 5 6 30 1.97 1.90
6 112 61 5 7 20 2.16 1.85
7 116 57 5 7 20 3.22 2.10
8 116 57 5 6 30 2.95 2.25
9 116 57 4 7 30 2.90 2.30
0 116 61 5 6 20 3.12 2.50
11 116 61 4 7 20 3.06 2.55
12 116 61 4 6 30 2.61 2.45
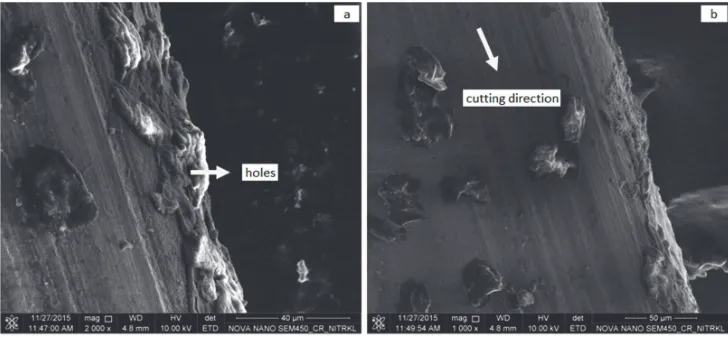
4.1 Microstructure of the wire
The brass wire that is used for the cutting operation of the gear is being viewed under the scanning electron microscope (SEM). Fig. 2 shows the SEM images of the wire. Fig. 2(a) depicts that after the machining of the work-piece, there is some material removal of the wire. The material also executes some types of holes and burrs which indicate that if further cut with the same wire, the type of finishing operation will not be as good as the previous one. Fig. 2(b) shows the SEM image of cutting direction of the wire. It can be clearly seen that there are some marks towards the downward direction which indicate that the wire cuts the work-piece in that direction.
5. Optimization technique for the experiment
In order to know the best results, optimization is done. The optimization is necessary to know the best possible combinations from a given set of results. There are two types of optimization, Single objective optimization and multi objective optimization. Single objective optimization considers each output responses individually with respect to the process parameters used. Multi objective optimization combines all the output responses to one and then considers each response individually with respect to process parameters.
5.1 Multi objective optimization using Taguchi Quality loss
Taguchi, a statistical method, was developed by Genichi Taguchi to develop the quality of manufactured goods and is also applied to engineering field. Taguchi design is an orthogonal array method and an efficient tool for the design of high quality manufacturing system. In Taguchi, a loss function is generated from the error. The purpose of this optimization is to maximize the MRR and minimize the surface roughness in order to get the best result. For data processing, higher the better should be taken for MRR and lower the better should be taken for surface roughness.
5.1.1 Methodology used for calculating Taguchi Quality loss
Consider the responses. For Lower the better(LB)
(3)
For Higher the better(HB)
1 (4)
where, Lij is the quality loss function and yij is the ith performance of the response table in the ith trial.
Calculation of Normalized Values
The data are normalized in order to avoid the effect of using different units and to reduce the variability. It is a transformation function performed to distribute the data evenly on a single input and to scale it into an acceptable range for further analysis.
The normalized function is given by the formula
∗
(5)
K.D. Mohapatra et al. / International Journal of Industrial Engineering Computations 8 (2017)
Calculation of Total Loss function
The average is taken for calculating Tij
The total loss function or theTaguchi Loss function is given by the following formula
W N (6)
where, Wi is the Weight-age which is always taken as 1.
Calculation of S/N ratio
The S/N ratios are expressed on a decibel scale. The S/N ratio can be calculated as the logarithmic transformation of the loss function which is given by
10 log (7)
6.2 Multi objective optimization using Desirability with Grey Taguchi
The desirability function approach is one of the most widely accepted and used method for multi response optimization process. The idea is based on quality of a process or product that has more than one quality characteristics. The desirability function was proposed by Harrington (1965) using functional forms described by Derringer and Suich (1980). The approach behind this is that the functions are translated to a common scale ([0, 1]),and then the geometric mean are combined to get the overall optimize metric.
Grey Taguchi, also known as grey relational analysis is an important method in grey system theory. This theory was first initiated by Deng to mainly study the uncertainties in system models and to make forecasts and decisions. The meaning of grey originally means black and white. The process of transferring original sequence to comparable sequence is the data processing in this analysis.
5.2.1 Methodology used for calculating Desirability with grey Taguchi
The Desirability function is given as For higher the better,
drmax =
0 if y ymin
1 if y ymax
if ymin≤ y ≤ ymax (8)
For lower the better,
drmin =
1 if y ymin
0 if y ymax
if ymin≤ y ≤ ymax (9)
Here r is the desirability index function which is taken as 1.y is the undesirable value. The values of ymax
and ymin are chosen by the user. The grey relational coefficient £i (k)can be calculated as
where ∆ is the deviation sequence of the reference sequence and is the identification coefficient whose value lies between 0 and 1, usually taken as 0.5. ∆ and ∆ are the largest and smallest values of each sequence respectively.
The ideal sequence is taken as 1. In order to find ∆ , 1 is subtracted from each values of ∆.
The final step is to find out the Grey relational grade ( ) which is given by
1
£i k (11)
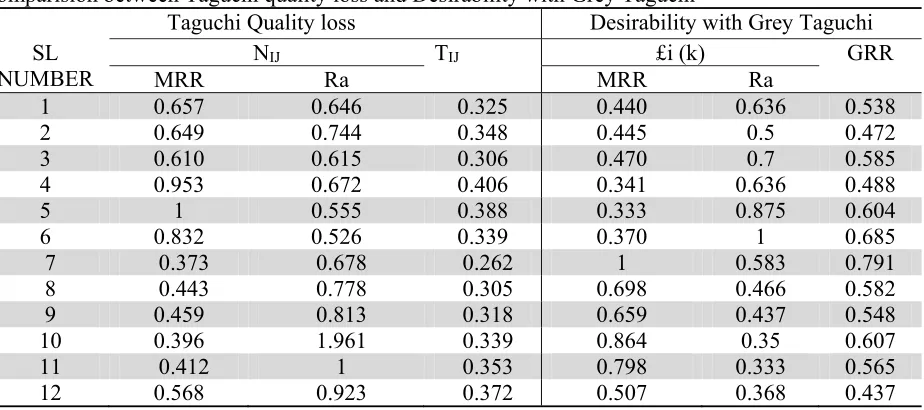
Table 5
Comparision between Taguchi quality loss and Desirability with Grey Taguchi
Taguchi Quality loss Desirability with Grey Taguchi
SL
NUMBER N
IJ TIJ £i (k) GRR
MRR Ra MRR Ra
1 0.657 0.646 0.325 0.440 0.636 0.538
2 0.649 0.744 0.348 0.445 0.5 0.472
3 0.610 0.615 0.306 0.470 0.7 0.585
4 0.953 0.672 0.406 0.341 0.636 0.488
5 1 0.555 0.388 0.333 0.875 0.604
6 0.832 0.526 0.339 0.370 1 0.685
7 0.373 0.678 0.262 1 0.583 0.791
8 0.443 0.778 0.305 0.698 0.466 0.582
9 0.459 0.813 0.318 0.659 0.437 0.548
10 0.396 1.961 0.339 0.864 0.35 0.607
11 0.412 1 0.353 0.798 0.333 0.565
12 0.568 0.923 0.372 0.507 0.368 0.437
6.3 Main effect plot diagram for Taguchi Quality loss and Desirability with Grey Taguchi
K.D. Mohapatra et al. / International Journal of Industrial Engineering Computations 8 (2017)
Fig. 3(a) shows the main effect plot for Taguchi Quality loss and Fig. 3(b) shows the main effect plot for Desirability with Grey Taguchi. From Fig. 3(a), it is clear that the highest points of TON, TOFF,WF,WT
and SV are at 112 µs,61µs,4 m/min, 6 g-f and 30 V respectively. The combinations obtained from this
are 112-61-4-6-30, which is not there in the Table 4, for which a confirmation test is needed to know the best values of MRR and Ra from these combinations. From the Fig. 3(b), it is clear that the highest values occur at the point 116-57-5-7-20. The combination is present in the Table 4. The respective MRR and surface roughness for this combination is 3.22 and 2.10 respectively.
Table 6
Result of Confirmatory test for TQL
Optimal Machining parameters
Predicted Experimental
Level TON1TOFF2WF1WT1SV2 TON1TOFF2WF1WT1SV2
S/N ratio for TQL -8.352 -9.897
Confirmation test is done to verify and predict the improvement on the process parameters. Table 6 shows the confirmation test for 112-61-4-6-30 combinations. Confirmation test depicts that the S/N ratio for TQL in predicted has an error of 15.6% than the experimental. In other words, the test results confirm the earlier design and analysis for optimizing the machining parameters. The percentage of error can be calculated by
% of Error = | ∗ 100| (12)
6. Results and discussion
6.1 Comparison of output responses
The output responses i.e. MRR and surface roughness for different optimization technique has been carried out. Table 7 shows the comparison of output responses of MRR and Ra between TQL and Desirability with Grey Taguchi.
Table 7
Comparision of output responses
Optimization techniques Input Parameters Output responses
TON TOFF WF WT SV MRR Ra
TQL 112 61 4 6 30 2.142 1.7
Desirability with Grey Taguchi 116 57 5 7 20 3.225 2.1
From Table 7, it is clear that the best result obtained for MRR and Ra is at different process parameter settings for different optimization method. From the Table 7, it shows that the material removal is good, when the pulse on time is at 112 µs and it is better when the TON setting is at 116 µs because more is the
material removed, better is the result. In this case Desirability with Grey gives the better result for MRR. Similarly for surface roughness, it can be seen from table 7 that when the Pulse on time is at 112 µs, the roughness tends to be less in case of Taguchi quality loss, which is the best for the result. In other words we can say that the roughness tends to be the best at setting TON 112 µs rather than TON 116 µs in case of
Taguchi quality loss.
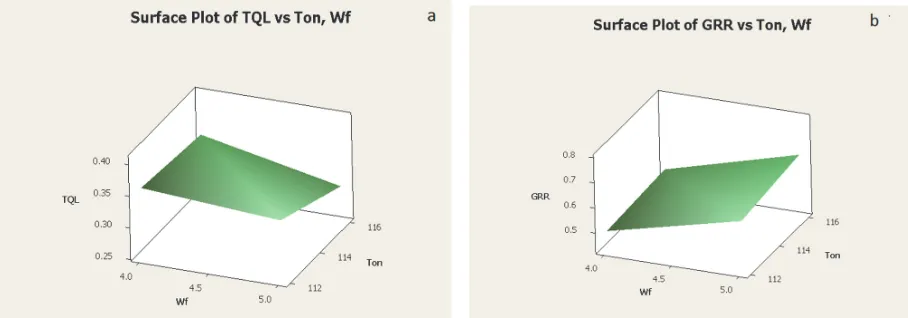
6.2 Comparison of Surface plot for MRR and Ra
Fig. 4(a) and Fig. 4(b) shows the surface plot in between TON and WF for Taguchi Quality loss and
where from the Fig. 4(b) the surface plot reveals that grade function is highest, when the TON is 112 µs
and wire feed rate 4m/min.
Fig. 4. (a).Surface plot for Taguchi Quality loss with input parameters; 4(b) Surface plot for Desirability with Grey Taguchi with input parameters
6.3 Effect of process parameters
The process parameters affect significantly to the response parameters. From the Fig. 3(a), it is clear that with the increase in the pulse on time, wire feed rate and wire tension, the loss function decreases. This is due to the fact that larger sparks causes the wire to move more quickly bearing a greater load to the wire, resulting in a decrease in the loss function. Increase in the pulse on time results in faster cutting speed leading to different values of MRR and Ra. With the increase in pulse off time and servo voltage, the loss function increases. From the Fig. 3(b), it is seen that the Grey Relational Grade function decreases when the pulse off time and servo voltage increases and the Grey Relational Grade function increases when the pulse on time, wire feed rate and wire tension increases. This is exactly the opposite of loss function. This is due to the fact that high discharge energy causes more melting of the metal resulting in an increase in the cuttings speed which results in an increase in Grey Relational Grade. More tension in the wire causes high reaction forces which results in different values of MRR and Ra resulting in an increase in GRR.
Table 8
ANOVA table for TQL
Source DF Seq SS Adj SS Adj MS F P % Contribution
TON 1 0.0020 0.018 0.018 21.31 0.006 11.97
TOFF 1 0.0090 0.079 0.079 88.93 0.000 53.89
WF 1 0.0020 0.002 0.002 26.86 0.004 11.97
WT 1 0.0009 0.0006 0.0006 6.94 0.046 5.38
SV 1 0.0011 0.0011 0.0011 13.35 0.015 6.58
Residual Error 5 0.0004 0.0004 0.0004 2.39
Total 10 0.0167 100
K.D. Mohapatra et al. / International Journal of Industrial Engineering Computations 8 (2017)
Table 9
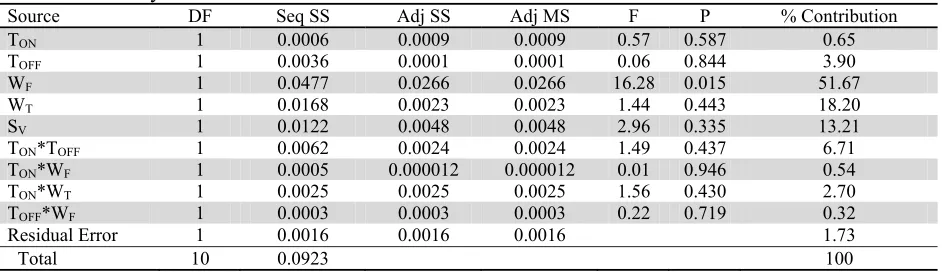
ANOVA for Grey Relational Grade
Source DF Seq SS Adj SS Adj MS F P % Contribution
TON 1 0.0006 0.0009 0.0009 0.57 0.587 0.65
TOFF 1 0.0036 0.0001 0.0001 0.06 0.844 3.90
WF 1 0.0477 0.0266 0.0266 16.28 0.015 51.67
WT 1 0.0168 0.0023 0.0023 1.44 0.443 18.20
SV 1 0.0122 0.0048 0.0048 2.96 0.335 13.21
TON*TOFF 1 0.0062 0.0024 0.0024 1.49 0.437 6.71
TON*WF 1 0.0005 0.000012 0.000012 0.01 0.946 0.54
TON*WT 1 0.0025 0.0025 0.0025 1.56 0.430 2.70
TOFF*WF 1 0.0003 0.0003 0.0003 0.22 0.719 0.32
Residual Error 1 0.0016 0.0016 0.0016 1.73
Total 10 0.0923 100
Table 10
Response table for TQL
Level TON TOFF WF WT SV
1 0.355 0.305 0.3571 0.3481 0.3259
2 0.324 0.366 0.3232 0.3307 0.3492
Delta 0.030 0.060 0.0339 0.0174 0.0233
Rank 3 1 2 5 4
Table 11
Response table for Grey Relational Grade
Level TON TOFF WF WT SV
1 0.5738 0.6028 0.5094 0.5476 0.6312
2 0.5891 0.5649 0.6427 0.6109 0.5413
Delta 0.0152 0.0379 0.1333 0.0634 0.0899
Rank 5 4 1 3 2
Table 10 and Table 11 determine the rank of the input parameters used in the experiment. From the response Table 10 it is seen that the most significant parameter is pulse off time which is ranked as 1. Pulse off time provides a significant contributionto the output responses i.e. MRR and Ra. Similarly from the Table 11, it is concluded that in optimization ofprocess parameters, wire feed rate plays a significant role in optimizing the response parameters i.e. MRR and Ra.
7. Conclusions
This paper has described the comparison of two multi objective optimization method of wire EDM process using Taguchi quality loss function and Hybrid optimization method i.e. Desirability with Grey Taguchi method. It was observed that the F value of pulse off time is 88.93 which is found to be highly significant parameter and the percentage of contribution is 53.89% in case of TQL. However a % contribution of 51.67 was found while optimising it in Desirability with Grey Taguchi method and wire feed rate was found to be the most significant parameter with F value 16.28. Combining and analysing both the optimization techniques, it was found that wire feed rate is most significant factor in determining MRR and Ra. The P value for WF in case of loss function and Hybrid technique is 0.004 and 0.015
References
Lin, C. T., Chung, I. F., & Huang, S. Y. (2001). Improvement of machining accuracy by fuzzy logic at
corner parts for wire-EDM. Fuzzy sets and systems, 122(3), 499-511.
Dauw, D. F., & Albert, L. (1992). About the evolution of wire tool performance in wire EDM. CIRP
Annals-Manufacturing Technology, 41(1), 221-225.
Gökler, M. I., & Ozanözgü, A. M. (2000). Experimental investigation of effects of cutting parameters on
surface roughness in the WEDM process.International journal of Machine tools and
manufacture, 40(13), 1831-1848.
Hsue, W. J., Liao, Y. S., & Lu, S. S. (1999). Fundamental geometry analysis of wire electrical discharge
machining in corner cutting. International journal of machine tools and manufacture, 39(4), 651-667.
Hsue, A. W. J., & Su, H. C. (2004). Removal analysis of WEDM’s tapering process and its application
to generation of precise conjugate surface.Journal of materials processing technology, 149(1),
117-123.
Jahan, M. P., Wong, Y. S., & Rahman, M. (2009). A study on the quality micro-hole machining of
tungsten carbide by micro-EDM process using transistor and RC-type pulse generator. Journal of
materials processing technology, 209(4), 1706-1716.
Kinoshita, N., Fukui, M., & Gamo, G. (1982). Control of wire-EDM preventing electrode from
breaking. CIRP Annals-Manufacturing Technology, 31(1), 111-114.
Lee, S. H., & Li, X. (2003). Study of the surface integrity of the machined workpiece in the EDM of
tungsten carbide. Journal of Materials Processing Technology, 139(1), 315-321.
Maitra, G.M. A handbook of Gear Design. 2nd ed, New Delhi: Tata McGraw-Hill Education Publishing
Company.
Qu, J., Shih, A. J., & Scattergood, R. O. (2002). Development of the cylindrical wire electrical discharge
machining process, part 2: surface integrity and roundness. Journal of Manufacturing Science and
Engineering,124(3), 708-714.
Rakwal, D., & Bamberg, E. (2009). Slicing, cleaning and kerf analysis of germanium wafers machined
by wire electrical discharge machining. Journal of Materials Processing Technology, 209(8),
3740-3751.
Ramakrishnan, R., & Karunamoorthy, L. (2004). Surface roughness model for CNC wire electro
discharge machining. Journal of Manufacturing Technology Today, 3(5), 8-11.
Scott, D., Boyina, S., & Rajurkar, K. P. (1991). Analysis and optimization of parameter combinations in
wire electrical discharge machining. The International Journal of Production Research, 29(11),
2189-2207.
Spedding, T. A., & Wang, Z. Q. (1997). Parametric optimization and surface characterization of wire
electrical discharge machining process. Precision Engineering, 20(1), 5-15.
Spedding, T.A., & Wang, Z.G. (1997). Study on modelling of wire EDM process.Journal of Material
Processing Technology, 69, 18–28.
Saha, P., Singha, A., Pal, S. K., & Saha, P. (2008). Soft computing models based prediction of cutting speed and surface roughness in wire electro-discharge machining of tungsten carbide cobalt
composite. The International Journal of Advanced Manufacturing Technology, 39(1-2), 74-84.
Tanimura, T. (1977). The properties of the servo gap sensor with wire spark-erosion machining. Annals
of the CIRP, 25, 59.
Tosun, N., Cogun, C., & Tosun, G. (2004). A study on kerf and material removal rate in wire electrical
discharge machining based on Taguchi method. Journal of Materials Processing Technology, 152(3),
316-322.