Doctor of Psychology (PsyD) Theses and Dissertations
4-1-2015
Examination of the Effects of Mild Hearing Loss on
Memory Using the Wide-Range Assessment of
Learning and Memory – Second Edition
(WRAML2)
Heather Paige-Deming
George Fox University
This research is a product of the Doctor of Psychology (PsyD) program at George Fox University.Find out moreabout the program.
This Dissertation is brought to you for free and open access by the Theses and Dissertations at Digital Commons @ George Fox University. It has been accepted for inclusion in Doctor of Psychology (PsyD) by an authorized administrator of Digital Commons @ George Fox University. For more information, please [email protected].
Recommended Citation
Paige-Deming, Heather, "Examination of the Effects of Mild Hearing Loss on Memory Using the Wide-Range Assessment of Learning and Memory – Second Edition (WRAML2)" (2015).Doctor of Psychology (PsyD).Paper 174.
of Learning and Memory – Second Edition (WRAML2)
by
Heather Paige-Deming
Presented to the Faculty of the
Graduate Department of Clinical Psychology
George Fox University
In partial fulfillment
of the requirements for the degree of
Doctor of Psychology
in Clinical Psychology
Newberg, Oregon
Spring, 2015
Examination of the Effects of Mild Hearing Loss on Memory Functioning Using the
Wide-Range Assessment of Learning and Memory – Second Edition (WRAML2)
Heather Paige-Deming
Graduate Department of Clinical Psychology at
George Fox University
Newberg, Oregon
Abstract
The current study examined whether young adults with mild hearing loss around 1000 Hz
would differ from normal hearing participants in their performance on a standardized memory
and learning instrument used in the field of psychology (i.e., WRAML2; Sheslow & Adams,
2003). Participants were 46 normal hearing individuals and 23 individuals with mild hearing
loss. Hearing participants were randomly assigned to 1 of 3 groups (hearing control, 23 decibel
loss, and 37 decibel loss). All 4 groups completed the WRAML2 under standardized conditions.
Based on the effortful hypothesis, it was anticipated that individuals with hearing impairment
would show deficits on verbally administered tasks requiring immediate recall. Results indicated
that mildly hearing-impaired individuals were as successful as their hearing control counterparts
in completing memory tasks efficiently. Only the group with simulated 37 dB hearing loss
showed deficits in performance on verbally administered memory tasks with limited contextual
Table of Contents
Approval Page ... ii
Abstract ... iii
List of Tables ... vi
List of Figures ... vii
Chapter 1 Introduction ... 1
Background ... 1
Hearing loss ... 4
The Effortful Hypothesis ... 6
Children and Measures of Intelligence ... 8
The Wide Range Assessment of Memory and Learning – Second Edition (WRAML2) . 10 Purpose of the Present Study ... 10
Chapter 2 Method ... 12
Participants ... 12
Instruments ... 13
Wide-Range Assessment of Memory and Learning-II ... 13
uHear ... 14
Noise reduction headphones ... 15
Procedure ... 16
Chapter 3 Results ... 18
Fidelity Check on Hearing ... 18
Examination of the WRAML2 Indices ... 22
Chapter 4 Discussion ... 25
Summary of Findings ... 25
Limitations ... 31
Conclusion ... 32
References ... 33
Appendix A Informed Consent Form ... 40
Appendix B Demographic Survey ... 41
List of Tables
Table 1 Core Index Composition for the WRAML2 ...13
Table 2 Optional Subtests and Index Score Composition for the WRAML2 ...14
Table 3 Mean WRAML subtest scores for the Normal hearing, Simulated Mild Loss,
Simulated Moderate Loss, and Hearing Loss groups ...20
Table 4 Mean WRAML2 domain scores for the Normal hearing, Simulated Mild Loss,
List of Figures
Figure 1 Hearing curves of participants in the Normal and Hearing Loss groups ...19
Chapter 1
Introduction
Background
Hearing loss is known to impact many domains of psychological functioning, including
social functioning, language comprehension, and cognitive abilities, but conclusions have yet to
be drawn about the effect of mild hearing impairment on memory functioning in adults between
the ages of 18 to 45 years. Hearing loss is a pervasive problem affecting 10% of the American
population, approximately 40 million people (“Prevalence of Hearing Loss,” n.d.). The interplay
of hearing ability and cognition was a research focus after World War II, however, research in
this area significantly decreased for a number of decades, reemerging once again within the last
10 years (Arlinger, Lunner, Lyxell, & Pichora-Fuller, 2009). Advancement in communication
technologies, such as hearing aids and cochlear implants, is one of the many factors that renewed
interest in the field, perhaps in part due to its relevance to an aging baby-boomer generation.
However, the notion that hearing impairment only affects the elderly is a common misconception
(“Prevalence of Hearing Loss,” n.d.). The Better Hearing Institute website notes that 65% of all
hearing loss in the United States occurs in individuals under the age of 65, with more than 6
million incidences of hearing loss occurring between the ages of 18 and 44 (“Prevalence of
Hearing Loss,” n.d.).
Hearing loss in children has also been extensively studied. Hearing impairment is one of
regard to language and cognitive development without appropriate early intervention (Paludetti,
et al., 2012).
Many studies have also concluded that hearing loss is related to cognitive decline in older
adults (Shahidipour, Geshani, Jafari, Jalaie, & Khosravidard, 2013; Uhlmann, Teril, Rees,
Mozlowski, & Larson, 1989) and new evidence from the Baltimore Longitudinal Study of Aging
purports that hearing loss might be a risk factor in incident dementia (Lin et al., 2011). Other
studies have shown that verbal memory impairment and decline in memory might be correlated
to age-related brain disease (Howieson et al., 1997; Shahidipour et al, 2013).
The bulk of the more recent research regarding hearing loss and cognition has primarily
focused on the elderly, on children, and on auditory communication technologies. Researchers
have looked at the relationship between memory and hearing loss in adult populations, aged 18
to 45 years, but many these studies have primarily focused on the ramifications of
severe-to-profound hearing loss, with less emphasis on how mild hearing deficits can impact an
individual’s cognitive competency. Addressing hearing loss and its implications is especially
important when considering the use of psychological testing.
While recommendations are available on how to appropriately select and administer
psychometric psychological tests with hard-of-hearing and deaf individuals, the term hearing
impairment complicates matters (“Mild and Unilateral Hearing Loss in Children”, n.d.). The
term hearing impairment is problematic because it is used to categorize all forms and degrees of
hearing loss. The overgeneralized definition varies from state to state, and even from practice to
practice (Wechsler, 2008). Because there is no one widely accepted definition, misinterpretations
performance across intellectual domains in the hearing impaired has also been mixed (Domino,
& Domino, 2006).
Early IQ studies found that individuals with hearing impairment struggled while
performing tasks that comprise Verbal IQ measurement, while Braden (1990) and his colleagues
found that Performance IQ was actually lower, albeit still the normal range, for individuals with
hearing impairment when compared with their hearing counterparts on the most commonly used
and widely accepted Wechsler tests (Braden, 1990; Domino, & Domino, 2006). Working
memory and processing speed performance, as measured by the Weschler tests, were also
impacted by hearing loss. Braden’s analysis of 21 studies indicated that the Digit Span and
Coding Wechsler subtests were lower, with a mean of 8.77 (versus the expected mean of 10) ,
among deaf individuals than their hearing peers (these two tests were once contributors to Verbal
IQ in the early versions of the Wechsler Scales). Further, another study found that hearing
impaired individuals performed above average on the Block Design and Picture Completion
subtests, two of four subtests that had comprised the Wechsler Performance IQ domain (Domino,
& Domino, 2006).
Interestingly, despite early research findings regarding discrepant results of the hearing
impaired population, many of the cognitive and neurological psychometric tests recommend that
the deaf and hard-of-hearing populations only be administered subtests with minimal verbal
content, unless special accommodations are made to tailor the assessment to the needs of the
individual, such as use of sign language. Furthermore, Domino and Domino (2006) state that
hearing impaired children continue to be evaluated on psychometric tests that have not been
that only tests of non-verbal performance be administered to people with hearing impairment, it
is important to note that many of these studies involving the effect of hearing impairment on the
assessment of intellectual domains have been conducted on children; relatively few studies have
looked at adults with mild hearing disability, especially using psychometric instruments designed
to assess memory.
Hearing Loss
Hearing is measured by assessing sensitivity to sound intensity and pressure, the two
physical correlates of loudness, presented at a variety of frequencies (i.e., pitches). It is most
often measured by audiological or “audiometric testing” conducted in appropriately equipped
laboratories by trained audiologists (Isaacson & Vora, 2003; Maerlender, 2010). Audiometric
testing delivers pure tone sounds of various frequencies to determine an individual’s hearing
threshold, defined as the lowest intensity at which various pure tones or words can be detected
50% of the time (Wingfield, Tun, & McCoy, 2005). The patient’s thresholds obtained on the
hearing measure are compared to normal hearing at each frequency and the difference is
measured in decibels (dB). In speech testing, another measure of auditory ability, the subject is
presented with a list of words and asked to repeat each word. The degree of speech loss is
calculated by the percentage of words the individual fails to correctly repeat back to the
examiner (Isaacson & Vora, 2003; Isaacson, 2010).
The average human ear can perceive sounds ranging 0 to 200 dB. An individual with very
good hearing can hear sounds as low as -15dB’s, the weakest sound a human ear can detect,
whereas 200 dB is the loudest sound. To give some perspective, 20 dB is comparable to the noise
normal hearing falls between 0 and 25 dB. Depending on the severity of loss, the threshold range
for hearing begins to increase. For example, individuals with mild loss can only begin to hear
sounds falling between 25 and 40 dB, and those with moderate loss can start to detect sounds
within the range of 40 dB to 65 dB. Individuals with severe hearing deficits cannot detect sounds
softer than 65 dB and those with profound loss can only hear sounds above 90 dB. As such,
sounds that a normal hearing individual would consider loud are barely audible to those with
moderate hearing impairment. With moderate loss, speech comprehension can become
problematic, creating limitations in language usage, language comprehension and vocabulary.
Language comprehension is extremely impacted with severe loss.
The ability to detect pitch of sound perceived by the human ear, or the frequency of
sound vibrations per second, is also important to the understanding of hearing. The human ear
can detect sounds ranging from 20 to 20,000 Hz with speech frequencies falling in the range of
250 to 8000 Hz (Kutz, 2015). The onset of hearing impairment often impacts higher frequencies
first. High frequency loss typically decreases the clarity of sound, and therefore human speech is
difficult to understand even though it can be heard, particularly when similar sounding words
include high-frequency consonants, such as /f/, /s/, /sh/, and /ch/. This is why individuals with
hearing loss can sometimes struggle to understand women and small children, as those voices
typically have higher frequency tones (“Noise Induced Hearing Loss,” 2012).
Because the ear is a sensitive and intricate sensory organ, many aspects of hearing can
become impaired. There are three distinct types of hearing loss seen within medical practice:
conductive, sensorineural, and mixed loss, an impairment that has concomitant conductive and
Sensorineural hearing impairment is caused by dysfunction or damage to the inner ear.
This part of the ear houses the cochlea, the organ responsible for converting sound waves to
electrical impulses. The cochlea is a delicate structure that can be affected by aging, illness, head
trauma, genetics, toxic substances, and congenital defects. Loss of hair cells in the
frequency region of the basilar membrane of the cochlea causes a loss of acuity for
high-frequency sounds. This degeneration can significantly affect speech perception (Wingfield et al.,
2005). Other sources of sensorineural loss include damage to the central neural pathways, most
often caused by genetic anomalies or trauma.
Conductive loss, which occurs when sound conduction is impeded in either the external
or middle ear due to infection, injury, or birth defects, is the second most common form of
hearing loss (Isaacson & Vora, 2003; Isaacson, 2010). Conductive hearing loss results when
sound cannot efficiently transverse the ear canal, tympanic membrane, and/or ossicular chain of
the middle ear (Isaacson, 2010). This type of impairment is typically not as severe as
sensorineural loss, with hearing deficits usually falling within the mild to moderate range.
The Effortful Hypothesis
Some studies suggest that hearing loss can negatively impact memory, even when words
and other auditory stimuli could be correctly identified by the hearing impaired individual.
Rabbitt (1968) proposed the effortful hypothesis to explain this phenomenon (Rabbitt, 1968,
1990). The effortful hypothesis suggests that perceptual effort required for speech recognition
might draw from attentional resources that would have otherwise been allocated for memory. In
short, Rabbitt argued that the hearing impaired listener must invest extra effort in the earlier
complaints from people who are hard of hearing is that, although they can understand, listening
takes much of their effort (Pichora-Fuller, 2006). Pichora-Fuller (2006) states that the more
mental energy is spent to achieve the primary goal of understanding, the less remains available
for other goals (Kahneman, 1973; Pichora-Fuller, 2006). Poor language comprehension and
limitations of perceived memory are consequences of effortful listening in both hearing and
hearing loss conditions.
Normal hearing individuals may struggle with memory tasks if background noise masks
auditory stimuli. “If increased listening effort results in the expenditure of limited working
memory resources on perceptual processing, thereby leaving fewer resources remaining for
storage, it would be expected that listeners who are hard-of-hearing would be poorer than normal
hearing listeners” (Pichora-Fuller, 2006, p.77; Van Boxtel et al., 2000; Larsby, Hallgren, Lyxell,
& Arlinger, 2005). One study looked at mild hearing loss and memory difficulties using list
recall. Rabbitt (1990) found that participants with mild hearing loss recalled the list of 15 words
less accurately than the normal hearing control group, although they had repeated each word
correctly when initially presented. Rabbitt (1990) attributed these findings to the fact that the
hearing impaired group allocated their resources to the task of perceiving speech input, leaving
fewer resources for encoding and subsequent recall (Pichora-Fuller, 2006).
Using the effortful hypothesis as a foundation, several studies have conducted tasks
requiring immediate free recall of word-lists, or both immediate recall and delayed recall of word
lists, in order to ascertain short-term and/or long-term memory functioning of hearing impaired
individuals (Piquado, Cousins, Wingfield, & Miller, 2010; van Boxtel et al., 2000). While there
learning performance, studies have yielded inconsistent results. Some studies propose that age
can be used to explain poor performance of free recall tasks rather than hearing ability, and that
these differences increase with age (Rabbitt, 1990; van Boxtel et al., 2000). Others have
suggested that age is not a factor, but rather hearing loss, as an independent factor, imposes extra
burden on processing resources and working memory, thereby negatively affecting word recall.
Many of the tasks used in previous studies have focused on word recall lists or word
recognition tasks in assessing memory and effortful processing. While many of these tasks are
helpful in ascertaining memory abilities, findings based on assessment using standardized
measures are not widely known (Wake, Hughes, Poulakis, Collins & Rickards, 2004).
Children and Measures of Intelligence
As noted earlier in the text, assessing intellectual development and/or functioning of
children have primarily been accomplished by using standardized assessment measures. These
instruments are advantageous because they offer more objectivity than other assessments, have
norms for comparison. However, many researchers have modified the use of standardized testing
when assessing children with hearing loss because they do not want the scores of
auditory/language based subtests to skew results, assuming that the use of such subtests will
penalize children with hearing loss (Plapinger & Sikora, 1995).
Some studies using standardized psychometric tests have focused directly on deaf and
hard-of-hearing children, but have predominantly looked at intelligence rather than specifically
on memory and/or learning. Vernon (2005) reviewed the last 50 years of comparative research
conducted on deaf and hard-of-hearing children with regard to intelligence testing;
“advent of intelligence testing in the early 1900’s” (Vernon, 2005, p.225 ). Many of these studies
compared hard-of-hearing and normal hearing children’s intelligence test performance to the
performance by sub-groups of other hearing impaired individual and to test norms (Vernon,
2005). When those with known biological etiology for intellectual deficit were omitted from the
study, the hearing impaired subjects performed as well on the IQ tests as their normal hearing
counterparts.
Another study by Niedzielski, Humeniuk, Blaziak, and Gwizda, (2006) confirmed that
hearing-impaired children’s IQ scores do not significantly differ from those of children with
normal hearing. However, this study also examined whether there were differences in the
development of intellectual functioning among children with unilateral hearing loss (either right-
or left-sided loss) using the Wechsler Intelligence Scale for Children - Revised. The authors
found that children with right ear impairment typically had poorer performance on verbal
intelligence when comparing them to children with left-sided loss, whereas non-verbal
intelligence was negatively correlated with left ear impairment (Niedzielski et al., 2006).
While there has been more research dedicated to determining the influence that hearing
loss may have on intelligence, the relationship between mild-to-moderate hearing loss and
memory, particularly within the college-aged, young adult population, have focused on the use of
standardized psychometric measures as a tool to measure memory. The Wide Range Assessment
of Memory and Learning – Second Edition (WRAML2; Sheslow & Adams, 2003) is a
commonly used standardized measure in the field of psychology that is used to evaluate memory
The Wide Range Assessment of Memory and Learning – Second Edition (WRAML2)
There has been continuing debate regarding the construct of memory. Many theoretical
models have attempted to take the colossal task of understanding and defining the memory
system over the past century, but the clearer picture has begun to emerge within the last 20 years
(Sheslow & Adams, 2003). Recent models of memory propose that memory is active and multi-
systemic set of processes that includes attention, short-term, temporary retention, long-term
storage, executive functioning, and retrieval acquired knowledge (Ericsson & Kintsch, 1995;
Kintsch, Healy, Hegarty, Pennington, & Salthouse, 1999; Sheslow & Adams, 2003). Memory
and learning are interrelated (Wechler, 2008). The WRAML2 is an individually administered
battery of tests designed to examine verbal and visual learning and memory, and it also includes
an attention/concentration component (Hall, 2006).
The WRAML2 is not based specifically on one model of memory, but rather takes a
relatively eclectic approach, conceptualizing memory function and learning as an active and
dynamic system that involves highly complex cognitive processes such as learning, attention and
concentration, and executive functioning (Sheslow & Adams, 2003).
Purpose of the Present Study
The purpose of this study was to assess adults with mild hearing loss and compare their
performance on a variety of memory tasks to normal hearing peers. The current study focused on
adults between 18 and 45 years of age. It is generally assumed that young, healthy adults are not
yet subject to age-related cognitive decline, including reduced memory for incoming information
(Wingfield et al., 2005). The memory and learning tests of the WRAML2 were used to assess
important system for cognitive performance and is therefore applicable to the concept of the
effortful hypothesis (Giesbrecht, 2008). This study tested the hypothesis that there would be no
statistically significant differences between working memory subtest scaled scores obtained from
the WRAML2 of adults with mild hearing loss compared to those of their healthy hearing peers.
In sum, the purpose of this research was to study the effect of mild hearing loss in an adult
population on a variety of memory tasks using a standardized memory measure that had not been
Chapter 2
Method
Participants
Sixty-nine adults aged 18 to 45 years were participant volunteers in this study. Fifty-six
participants were gathered from a convenient sample of George Fox University undergraduate
psychology students via a virtual student research board, one that offered class credit for research
participation. Thirteen subjects were gathered from local communities via snowball sampling.
Participants’ hearing was screened and 23 participants with mild hearing loss (ranging from 26 dB
to 40 dB) were identified. While it was hypothesized it would be difficult to find a sample with
hearing loss, it was relatively easy to find young adults with mild hearing loss, as hearing
impairment is a ubiquitous problem across ages. All participants were tested for pure-tone hearing
acuity across the frequencies ranging from 250 - 6000 Hz using the program uHear, described
below. Volunteers with moderate-to-severe hearing loss were excluded from the study, as were
those with no collegiate experience. All participants were required to identify English as their
native language. Hearing loss participants were not receiving intervention in the form of cognitive
restructuring and/or hearing devices for their loss at the time of administration. 80% of the
participants in this study were comprised of individuals between the ages of 18 to 24 years, 71% of
the sample was Euro-American, and 54% was female. 46% were male, 29% were classified as
bi-racial, and 20% were between the ages of 25 to 45 years of age, with approximately 15% falling
Instruments
Wide-Range Assessment of Memory and Learning-II (WRAML2; Sheslow & Adams,
2003) is an individually administered battery of tests designed to assess verbal and visual
learning and memory of individuals between the ages of 5 and 90 years. The adult core battery
provides a General Memory Index, which includes the Verbal Memory, Visual Memory, and
Attention/Concentration indices, and is comprised of six subtests. Seven supplemental subtests
were also included to evaluate delayed recall, recognition, and working memory abilities; two of
these seven subtests examine the Working Memory domain. Testing took approximately 90
minutes, because supplemental tests were included in administration. This study included the full
adult battery, which meant that the both core and optional tests were given to each participant.
Table 1 and Table 2 provide a description of the organization of the fifteen subtests into indices.
Table 1
Core Index Composition for the WRAML2
Index Subtest
General Memory Index (GMI) Verbal Memory Index Story Memory
Verbal Learning
Visual Memory Index Design Memory Picture Memory
Attention/Concentration Index Finger Windows Number/Letter
Note: Recognition subtests for the Verbal Memory Index and Visual Memory Index form the General
Note continues.
The WRAML2 Manual (Sheslow & Adams, 2003) reports Person separation reliabilities for the core
subtests range from .85 to .94; the optional subtests range from .56 to .93. Reliability, as measured by
internal consistency, is good across indices, ranging from .83 - .95 across the age groups used in this
study. Internal consistency of core and optional subtests, including the recall and working memory tests,
range from .71 to .94. The recognition subtests used in this study and corresponding age groups have fair
internal consistency ranging from .38 to .88, respectively.
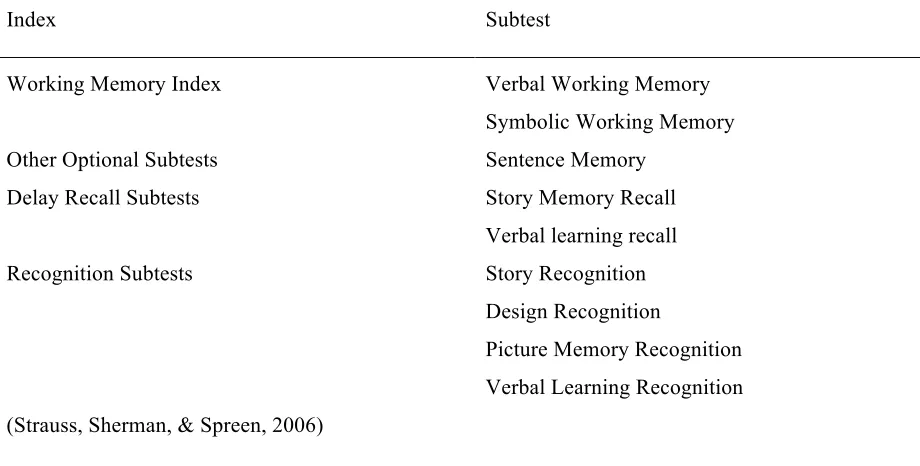
Table 2
Optional Subtests and Index Score Composition for the WRAML2
Index Subtest
Working Memory Index Verbal Working Memory
Symbolic Working Memory Other Optional Subtests Sentence Memory
Delay Recall Subtests Story Memory Recall Verbal learning recall
Recognition Subtests Story Recognition
Design Recognition
Picture Memory Recognition Verbal Learning Recognition (Strauss, Sherman, & Spreen, 2006)
uHear is a brief hearing screener application, designed by Unitron for the iPhone and iPod
Touch that takes approximately eight minutes to complete. The application includes three
assess how well an individual can hear in common listening conditions. The hearing sensitivity test
assesses pure-tone frequencies from 250 Hz to 6000 Hz, the frequency range representative of the
speech spectrum. The participants were only required to complete the hearing sensitivity test and
self-report questionnaire.
The uHear application was downloaded onto three Apple iPod Touch 16 GB MP3 Players
(5th Generation) with three sets of identical headphones (Sony Studio Series headphones) for
standardization purposes.
In a recent study, Wang, Zupancic, Ray, Cordero, and Demke (2014) tested whether the
uHear app was as reliable as traditional audiometric tests. Their study determined that the
software was reliable for lower pure-tone frequencies (250 Hz, 500Hz, and 1000Hz) but
overestimated hearing loss at higher frequencies (2000 Hz, 4000 Hz, 6000 Hz). Another study
looking at the validity of the uHear app found that the application was a successful screener in
ruling out moderate hearing loss (pure tone average > 40 dB) and in quantifying the degree of
hearing loss in individuals with hearing impairment (Szudez et al., 2012). Neither study
advocated using the screener to act as a replacement for traditional audiometric testing methods
and recommended that individuals identified with hearing deficits be referred to a hearing
healthcare professional (Wang, Zupancic, Ray, Cordero, & Demke, 2014).
Noise reduction headphones were used to create mild simulated hearing loss by
masking the hearing of normal hearing participants. The two sets of headphones included were
the 3M Peltor Optime 98 cap-mount earmuffs and the 3M Peltor Ultimate 10 Hearing earmuffs,
both normally used to protect an individual’s hearing from loud noises that could potential cause
latter had a noise reduction rating of 30 dB. While not within the mild hearing loss range per se, a
simulation of a 23 dB loss was enough of a difference to elicit effort in on memory tasks in normal
hearing individuals. The 3M Peltor Ultimate 10 Hearing earmuffs were used in conjunction with
Magid IHP32RF Polyurethane From E2 Disposable Uncorded Foam Earplugs with a noise
reduction rating (NRR) of 32 dB to simulate further loss. A website designed for hearing safety
reports that the NRR can be increased by using both ear muffs and earplugs concurrently. The
headphones are rated to create a 30 dB loss, the ear foam plugs a 32 decibel loss. Therefore, we can
calculate high-mild simulated loss had a loss of 37 dB based on the assumed formula
(“Double-hearing-protection” n.d.). In summary, low-mild hearing loss (i.e., a 23 dB reduction) was
simulated by asking normal hearing participants to wear the 3M Peltor Ultimate 10 Hearing
earmuffs, and a high-mild hearing loss (i.e., a 37 dB reduction) was simulated by asking
participants to wear both the 3M Peltor Ultimate 10 Hearing earmuffs and the ear foam plugs
simultaneously.
Procedure
George Fox University Human Subjects Review Committee approved this study. To
receive class credit for participation, each volunteer was required to sign the consent form (see
Appendix A) and complete a simple demographic survey, which included basic information such
as age, sex, race, current year in college, and last degree obtained (see Appendix B). All examiners
were doctoral candidates in a clinical psychology program who had successfully demonstrated
competency in the administration, scoring and interpretation of the WRAML2. The examiners
informed the participants that their participation was voluntary and that they could discontinue
would be kept confidential per American Psychological Association standards and would be
destroyed after seven years.
Examiners met the participants in a waiting room and lead them to private offices for the
test administration. After completing the required preliminary forms, hearing ability was assessed
using the uHear screener. Each participant with normal hearing ability was then randomly assigned
to one of three groups, a hearing control group (Group 1), and two mild simulated loss groups.
Participants assigned to Group 2 simulated low-mild hearing loss (i.e., simulated 23 dB loss) and
Group 3 simulated high-mild hearing loss (i.e., simulated 37 dB loss) had their hearing masked via
sound reduction headphones and earplugs, respectively. Participants who presented with mild
hearing loss comprised the fourth group (Group 4). The four groups were comprised of 196
hearing control participants, 13 low-mild simulated loss participants, 14 high-mild simulated loss
participants, and 23 participants with mild hearing loss.
The 56 undergraduate participants were assigned to quiet offices on-campus to complete
WRAML2 testing in an allotted two-hour time block. The 13 other participants were tested in their
Chapter 3
Results
Fidelity Check on Hearing
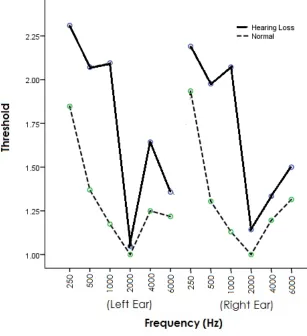
The aural sensitivity of the Normal (n = 46) and Hearing Loss (n = 23) groups differed
significantly. Specifically, a 12 (frequencies) by 2 (groups) repeated-measures ANOVA resulted
in a significant main effect of frequencies, Greenhouse-Geisser F (6.00, 390.15) = 30.45, p <
.001, and a main effect of hearing group, F (1, 65) = 39.85, p < .001. But most importantly, there
was a significant interaction of frequencies and hearing groups, Greenhouse-Geisser F (6.00,
390.15) = 6.76, p <.001. The interaction, shown in Figure 1, indicated that the Hearing Loss
group is significantly less sensitive to frequencies lower than 2000 Hz. It is important to note that
human speech occupies pure-tone thresholds of 500 Hz, 1000 Hz, and 2000 Hz (Carhart, 1946;
Preece & Fowler, 1992)
In order to ensure the groups were comparable before the simulated hearing loss, a 12
(frequencies) by 3 (groups) measures ANOVA was conducted. This 12 x 3
repeated-measures ANOVA documents that, as would be expected, sensitivity differed across the
frequencies Greenhouse-Geisser F(6.63, 278.46) = 18.23, p <.001). More importantly, prior to
the simulated hearing losses, there were no significant differences in the three groups of normal
hearing participants, F(2, 42) = 1.01, p = .37, nor was there an interaction of frequency and
Figure 1. Hearing curves of participants in the Normal and Hearing Loss groups. Threshold
categories were 1 = normal hearing; 2 = mild loss; 3 = moderate loss.
The WRAML2 Subtest Results
The mean scaled scores for each of the 15 WRAML2 subtests for the four groups are
shown in Table 3. It should be noted that scaled score averages range from 8 to 12. Participants
who obtained scaled scores above a 12 performed in the high average (to superior) ranges, and
those with scaled scores below 8 were in the below average (to borderline) ranges. Looking at
Table 3, the reader can see that the means fell within the average range on all but 8.3 % of the
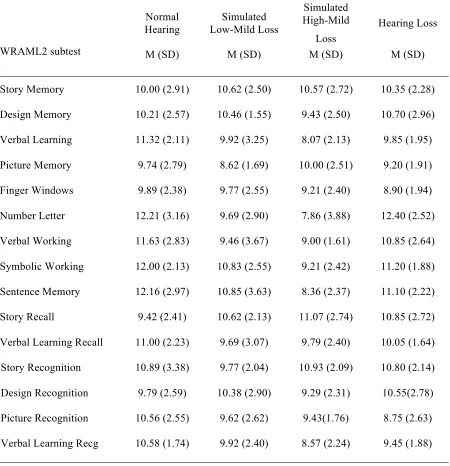
Table 3
Mean WRAML2 subtest scores for the Normal hearing, Simulated Mild Loss, Simulated Moderate Loss, and Hearing Loss groups.
Normal Hearing
Simulated Low-Mild Loss
Simulated High-Mild
Loss
Hearing Loss
WRAML2 subtest M (SD) M (SD) M (SD) M (SD)
Story Memory 10.00 (2.91) 10.62 (2.50) 10.57 (2.72) 10.35 (2.28)
Design Memory 10.21 (2.57) 10.46 (1.55) 9.43 (2.50) 10.70 (2.96)
Verbal Learning 11.32 (2.11) 9.92 (3.25) 8.07 (2.13) 9.85 (1.95)
Picture Memory 9.74 (2.79) 8.62 (1.69) 10.00 (2.51) 9.20 (1.91)
Finger Windows 9.89 (2.38) 9.77 (2.55) 9.21 (2.40) 8.90 (1.94)
Number Letter 12.21 (3.16) 9.69 (2.90) 7.86 (3.88) 12.40 (2.52)
Verbal Working 11.63 (2.83) 9.46 (3.67) 9.00 (1.61) 10.85 (2.64)
Symbolic Working 12.00 (2.13) 10.83 (2.55) 9.21 (2.42) 11.20 (1.88)
Sentence Memory 12.16 (2.97) 10.85 (3.63) 8.36 (2.37) 11.10 (2.22)
Story Recall 9.42 (2.41) 10.62 (2.13) 11.07 (2.74) 10.85 (2.72)
Verbal Learning Recall 11.00 (2.23) 9.69 (3.07) 9.79 (2.40) 10.05 (1.64)
Story Recognition 10.89 (3.38) 9.77 (2.04) 10.93 (2.09) 10.80 (2.14)
Design Recognition 9.79 (2.59) 10.38 (2.90) 9.29 (2.31) 10.55(2.78)
Picture Recognition 10.56 (2.55) 9.62 (2.62) 9.43(1.76) 8.75 (2.63)
Verbal Learning Recg 10.58 (1.74) 9.92 (2.40) 8.57 (2.24) 9.45 (1.88)
in Group 3, specifically on the Number Letter subtest. The table also shows that the means for
subtests. The Hearing Loss group (Group 4) also appeared to be one scaled score lower than
Group 1.
In order to determine whether there were significant differences among the four groups’
scaled score means, a 15 (subtest) by 4 (group) repeated-measures ANOVA was employed. The
ANOVA assumptions were tested. The data were not skewed, however the assumption of
homoscadicity was not met, Mauchly’s W (104) = .003, p < .001, therefore a
Greenhouse-Geisser ANOVA formula was employed.
The results of the 15 (subtests) by 4 (groups) repeated-measures ANOVA showed a
significant difference among subscores, Greenhouse-Geisser F (3, 38, 528.22) = 2.60, p = .007; a
significant difference among the groups F(3, 63) = 3.80, p = .014; and a significant subtest by
group interaction, Greenhouse-Geisser F (25.15, 528.22) = 2.50, p < .001. Power for these
ANOVAs was good for the within-subject tests (i.e., .84 for subtests and .89 for the interaction)
but was quite low for the between-subject test (i.e., .50 for groups).
In order to determine where these differences existed, 15 one-way ANOVAS were run,
one on each of the 15 subtests. The follow-up showed that 5 of the 15 WRAML2 subtests had
significant differences among the four groups, including Verbal Learning Memory, F(3, 63) =
5.65, p = .002; Number Letter Sequencing, F(3, 63) = 8.02, p < .001; Verbal Working Memory,
F(3, 63) = 4.53, p = .006; Symbolic Working Memory, F(3, 63) = 4.94, p = .004; and Sentence
Memory, F(3, 63) = 5.72, p = .002. Verbal Learning Recognition was close to showing a
significant difference among the four groups, F (3, 63) = 2.55, p = .064 and was therefore
explored to see which of the groups were most dissimilar. The effect sizes indicated no effects or
was extremely low too (i.e., Power ranged from .07 to .55). The Effect sizes were large for the
ANOVAs that were statistically significant and the associated Power was adequate (i.e. Power
ranged from .63 to .85).
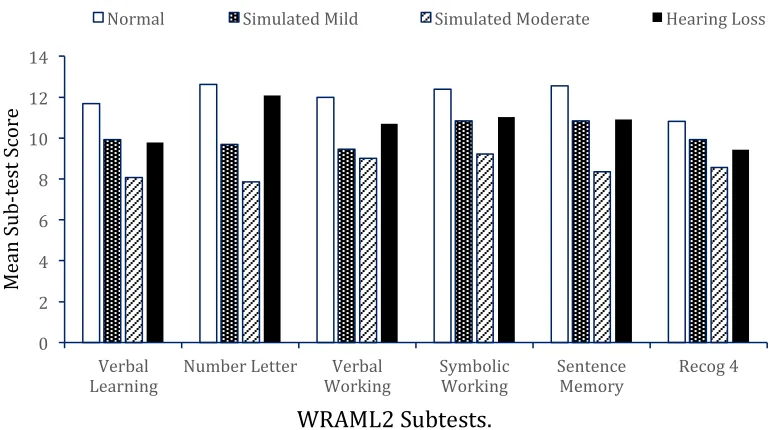
Figure 2 shows the mean scaled scores for six WRAML2 subtests that had significant
differences among the groups. A Tukey’s Honestly Significant Difference
Test (HSD), a conservative post hoc test, was used as a follow-up to each of the six significant
one-way ANOVAs to identify the differences among the four groups for each subtest. Tukey’s
HSD revealed that for all six subtests (i.e., Verbal Learning, Letter Number Sequencing, Verbal
Working Memory, Symbolic Working Memory, Sentence Memory, Verbal Learning
Recognition) there were significant differences between Groups 1 (Normal Hearing) and 3 (37
dB Simulated High-Mild Hearing Loss). For the Number Letter subtest, in addition to the
significant difference between Groups 1 and 3, there were also significant differences between
Groups 1 (Normal Hearing) and 2 (23 dB Simulated Low-Mild Hearing Loss), and Goups 3 (37
dB Simulated High-Mild Hearing Loss) and 4 (Mild Hearing Loss).
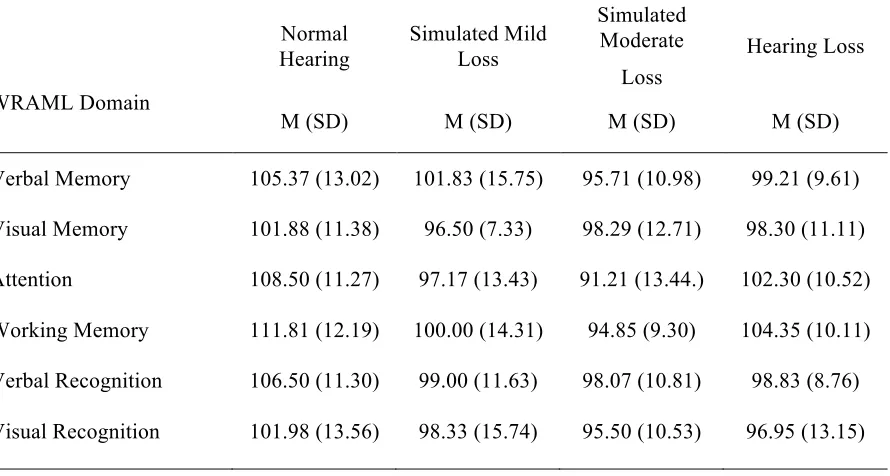
Examination of the WRAML2 Indices
This study also assessed the groups’ performance by domains, or indices. The mean
scaled scores for each of the six WRAML2 domains for the four groups are shown in Table 4.
The Verbal Memory, Visual Memory, and Attention and Concentration Indices are the three core
WRAML2 domains. Working Memory Index scores as well as those from the Verbal
Recognition and Visual Recognition Indices were also calculated. Results are shown as standard
0 2 4 6 8 10 12 14
Verbal
Learning Number Letter Working Verbal Symbolic Working Sentence Memory Recog 4
M
ea
n
Su
b-‐t
es
t S
co
re
Normal Simulated Mild Simulated Moderate Hearing Loss
WRAML2 Subtests.
Figure 2. Mean scaled scores for the four groups on six WRAML2 subtests.
from 50 – 160, with 68 percent of the population falling in the range of 85 – 115. Domain mean
scores on all six of the WRAML2 domains fell within the average range (from 91.2 to 111.8).
At first glance, the reader can see from Table 4 that the domain standard scores among
the four groups were highest for Group 1 and lowest for Group 3. This was the case across all
indices, which is what we would expect given the pattern of subtest scores.
In order to determine whether there were significant differences among the four groups’
mean domain scores, a 6 x 4 repeated-measuresANOVAwas employed and assumptions were
tested. The data were not skewed and the assumption of equal variances was met, Mauchly’s W
Table 4
Mean WRAML2 domain scores for the Normal hearing, Simulated Mild Loss, Simulated Moderate Loss, and Hearing Loss groups.
Normal Hearing
Simulated Mild Loss
Simulated Moderate
Loss
Hearing Loss
WRAML Domain
M (SD) M (SD) M (SD) M (SD)
Verbal Memory 105.37 (13.02) 101.83 (15.75) 95.71 (10.98) 99.21 (9.61)
Visual Memory 101.88 (11.38) 96.50 (7.33) 98.29 (12.71) 98.30 (11.11)
Attention 108.50 (11.27) 97.17 (13.43) 91.21 (13.44.) 102.30 (10.52)
Working Memory 111.81 (12.19) 100.00 (14.31) 94.85 (9.30) 104.35 (10.11)
Verbal Recognition 106.50 (11.30) 99.00 (11.63) 98.07 (10.81) 98.83 (8.76)
Visual Recognition 101.98 (13.56) 98.33 (15.74) 95.50 (10.53) 96.95 (13.15)
The results showed no significant difference across domains F (5, 305) = 1.63, p = .150,
eta2 = .03 indicating a small effect, Power = .55, and all groups responded to the domains in the
same way, i.e., there were no interactions, F (15, 305) = 1.16, p = .305, eta2 = .05 indicating a
small effect, Power = .74. A significant difference between the four groups was obtained, F (3,
61) = 5.20, p = .003, eta2 = .20 indicating a large effect, Power = .91. To help identify where the
significant differences were among the four groups, a Tukey test (HSD) was used in follow-up
and revealed that Group 3 performed significantly worse than Group 1 on all domains. No other
Chapter 4
Discussion
Summary of Findings
This study investigated whether mild hearing loss affects memory abilities in a young
adult college population using standardized assessment. Results indicated that naturally
occurring mild hearing loss, measured by pure-tone audiometry at the 1000 Hz frequency, does
not impact memory performance, nor does simulating a 23 dB hearing loss. Simulating a
high-mild 37 dB hearing loss, however, significantly decreased functioning on 5 of the 15 adult
battery WRAML2 subtests and on all composite memory domains.
The task requirements of the five affected subtests differ in some important ways from
the non-affected subtests. First, the five subtests are administered aurally and are only allowed
one administration; no cues are given as is the case with Story Memory, also administered once
aurally. Story Memory gives the examinee context about the story, which can act as a framework
for the material. On the other five aurally administered subtests, the examinee must be able to
hear the [rote] verbal information clearly in order to produce a correct answer. Secondly, the
context of each of the five affected subtests is very limited in syntax, semantics, and referential
relations (Daneman & Merikle, 1996). In contrast, it is notable that no participants, regardless of
hearing ability, struggled with Story Memory task demands, which is also aurally demanding but
rich in contextual meaning and allotted cues, and does not require a verbatim response. It has
been widely documented that linguistic context aids in speech comprehension (Akeroyd, 2008;
are required to improve understanding of the acoustical signal regardless, of perceptual clarity.
This is important with regard to hearing impairment, as the effortful hypothesis suggests that
cognitive resources are limited and can be highly impacted by environmental demands.
By significantly reducing the quality of the auditory signal, as was true for participants in
Group 3, both short-term and working memory tasks (tasks that involve greater complexity) were
compromised. The Sentence Memory subtest was notably impacted as well for Group 3.
Although, the participants were able to produce the gist of the information immediately after
each administration, they were unable to produce the information exactly as it was given,
particularly on sentences involving greater complexity.
Speech Comprehension
Although this study primarily focused on the effect of mild hearing loss on memory, it is
important to discuss linguistic and perceptual components in speech comprehension to ascertain
why the hearing loss participants performed as well as their hearing counterparts on all
WRAML2 subtest administrations, and why those in Group 3 did not. Pichora-Fuller (1998) and
her colleagues hypothesized that encoding auditory information into long-term memory is more
challenging when cognitive resources are used to improve speech understanding in degraded
acoustical signals. (Kramer et al., 2009; Pichora-Fuller et al, 1998). Within this literature,
cognitive capacity is often researched by using word-lists and/or short but meaningful sentences
in interfering noise. This helps researchers determine how challenging listening conditions can
influence communication. It has been well documented that individuals who classify themselves
as “hard of hearing” struggle with following lectures in large halls and have difficulty
hearing loss would also struggle on WRAML2 subtests that involved auditory stimuli. This was
not the case, however.
We can assume from the results of the present study that adults with naturally occurring
mild hearing loss have adapted to, or compensated for, their loss over time by using the
perceptual, linguistic, and cognitive cues that contribute to effective speech understanding
(Pichora-Fuller et al., 1998). A large body of research has examined the interplay between
perceptual cues (visual, auditory, and tactile stimuli), cognition, and how cognitive factors
contribute to language understanding. Cognitive factors are especially important to consider with
regards to language comprehension and hearing impairment.
Bottom-up processing is one’s ability to process elementary perceptual units. In the case
of auditory information, bottom-up processing refers to the “coding and transfer of the acoustic
signals…into perceptual features such as loudness, pitch, and timbre” (Kramer et al., 2009, p.507
). The speed of information processing, working memory, and use of linguistic context relate to
top-down cognitive capacities. Top-down processing suggests that one’s ability to process
language starts with the larger chunks, i.e., concepts or words and works down to the finer details
of decoding specific speech sounds. Top down processing is extremely important in deciphering
muffled/distorted speech sounds, but top-down and bottom-up processing must work together for
successful speech understanding (Ronnberg, 2003.) We might conclude from the results that
individuals with naturally occurring hearing loss rely more on cognitive mechanisms for
sufficient comprehension. The ability to generalize acoustical signals in phonetic categories
language decoding to discuss in terms of adaptation to hearing loss. Speech reading, though, is
easier to perform with extended speech than with isolated words.
Research shows that both individual with normal hearing and those with hearing loss use
speech reading to some extent. Speech reading is thought to be analogous to the more commonly
used term, “lip reading,” but lip reading implies that one only uses the movement of lips to help
decipher nuances of comprehension (“Speechreading,” n.d.). The term “speech reading” includes
the act of reading lips, but it also involves taking visual cues from body language, facial
expression, and sounds made by the cheek/throat in its more encompassing definition
(“Speechreading,” n.d.). For those with intact hearing, speech reading acts as an aid in everyday
conversation, especially in noisy conditions, but it is critical that individuals with hearing loss
develop this skill for successful speech comprehension. Interestingly, a study published in the
journal of Speech, Language, and Hearing Research showed that speech reading proficiency in
hearing loss individuals does not begin to advance from normal hearing individuals until after 14
years of age (Kyle, Campbell, Mohammad, Coleman, & MacSweeney, 2013). Therefore we can
conclude that even the youngest hearing impaired participants in our study had at least four years
to unconsciously practice and develop reliance on visual speech cues; those in the simulated
groups did not have sufficient time to adapt to visual cues.
However, only 30% of information can be gleaned from speech reading. Even at the most
advanced levels, an individual must be competent in language to extract meaning using speech
reading (Ross, 1999). Many different speech sounds use similar physical movements of the lip,
jaw, and tongue and are therefore difficult to differentiate visually. As such, an individual cannot
The environment is also critical for successful speech reading. As noted, speech reading
is highly dependent on visual acuity and on the ability to assess rapid articulation. In ideal
circumstances, the reader would be in an appropriately lighted room, directly facing the
articulator without peripheral distraction. Such was the case with the current study – office
lighting was sufficient, noise was kept to a minimum, and the examiner always faced the
examinee regardless of assigned condition. Therefore, we can assume the environmental
conditions were suitable for the speech reading process and that those with hearing impairment
used their skills to successfully complete the memory tasks. If the WRAML2 battery was
administered in noisy conditions, would the participants who had hearing loss have done as well
as those with intact hearing? This might be an area of future research.
Interestingly, much of the recent research conducted in experimental audiology has
focused on using sentence threshold tests to evaluate abilities in speech perception. While the
test is easy to administer and more representative of everyday conversation than are rote memory
tasks, a disadvantage of the speech threshold test is that the sentences employed as stimuli are
too rich in contextual information (Bronkhorst & Wagner, 2002). As such, an individual can
recognize inaudible/missed words because of transitional word identification. Bronkhorst and
Wagner (2002) stipulated that the application of sentence tests do not help ascertain the role of
phoneme perception and learning in speech comprehension.
Dahan and Mead (2010) argued that no speech sound is identical to any sound one has
heard historically. In order to make sense of incoming acoustical signals, listeners rely on
previously learned linguistic cues to categorize ambiguous sounds onto mental representations. It
Mead, 2010). That is, basic units of speech, commonly known as phonemes, are the sublexical
units of language that comprise the foundation of speech comprehension. Listeners are
constantly adjusting their phonemic categories with incoming information to improve their
ability to comprehend language.
In their investigation of perceptual learning and generalization, Dahan and Mead (2010)
found that listeners who had prior exposure to distorted speech sounds were better than their
untrained counterparts at subsequent word/sentence identification. They postulated that
adaptation had occurred via sublexical generalization, even after only a few trials. Applying this
concept to this study, we can make the assumption that individuals assigned to the
high-simulated loss condition (37 dB) had not been able to adapt, or generalize, to the distorted words
presented. Lower scores on the Verbal Learning subtest could be attributed to novel presentation
of phonemic sound. That is, participants were unable to allocate sublexical information into the
appropriate mental categories because the sounds were too novel for recognition. For example,
“ice” is one word in the list of 16 words used to assess free immediate recall. Often a participant
would hear “mice” instead of “ice” or another of the many rhyming words. This did not seem
appear to be problematic with naturally occurring hearing loss, suggesting that categorical
schemas have been appropriately adapted to sound distortion under favorable listening
conditions.
Perhaps having had the chance to adapt to hearing loss over time by using environmental,
contextual and linguistic cues, the hearing impaired participants performed as well as the hearing
control group on all WRAML2 memory tests. The performance on memory tasks with low-mild
hearing impairment to a high-mild simulated loss suggests that not enough time had lapsed to
develop compensatory skills on verbally administered tasks. Hofman, Riswick, &Van Opstal,
(1998) found that it could take several weeks for an individual to adapt to distorted sound and
subsequently make correct judgments. Therefore, we can assume it would take at least a few
weeks to make the adaptations necessary to mirror the performance of the naturally occurring
mild hearing loss condition if no accommodations were made to the conditions.
Limitations
There are possible methodological concerns that might have impacted the findings of this
study. First, the smaller sample sizes of each group may be viewed as inadequate and therefore
results might be considered as misleading. However, the small sample sizes only impacted the
statistical significance of conditions with small or moderate effect sizes. It can be argued that
conditions with small or moderate effect sizes are practically and clinically irrelevant (Sink &
Mvududu, 2010).
Another caveat to the study’s conclusions are the methods by which hearing ability was
measured. As stated in the introduction, there are distinctive types of hearing abilities including
sensorineural, conductive, mixed, and neurological loss (Isaacson, 2003). Audiology tests can
formally diagnose the type hearing loss by measuring the sounds that reach the inner ear through
the ear canal via air waves and those that are transmitted through the back of the ear (skull) via
bone conduction. A thorough hearing test conducted by an audiologist can take up to 30 minutes
to administer in a sound-treated room. uHear, the eight-minute self-administered hearing
screener used in this study, was unable to differentiate the type of hearing loss, using only the
note that conductive loss can look different than sensorineural loss in terms of language and
other forms of cognitive development, particularly if the loss occurs early in childhood. This
study did not account for these differences, nor was emphasis placed on assessing the differences
between unilateral and bilateral hearing loss.
This screener was also used with generic headphones and was self-administered in a
college campus building. Although many of the participants were alone within enclosed offices,
noise outside the offices did not promote a quiet environment such as one would find in a
soundproofed room. Therefore, participants may have missed pure-tone frequencies due to
uncontrolled noise from outside their room. Further, the headphones used were not designed to
mask interfering noise. Based on the test of aural frequencies, it was interesting to find that none
of the participants, including those with hearing loss, had mild loss at the 2000 Hz frequency.
This may indicate that the manufacturer designed these headphones to emphasize sound quality
within this range, thereby skewing ones perception of incoming sound waves. Quality
headphones with complete noise reduction capability would be recommended in further study.
Conclusion
The practical implications of this study are fairly clear. Individuals with mild hearing loss
are not significantly dissimilar from their hearing counterparts in terms of memory performance.
This suggests that an individual might compensate for mild hearing deficits by relying more
heavily on cognitive resources and environmental cues. Clarity of hearing impairment
determined by audiometric testing would be beneficial for studies of hearing loss, as would
References
Akeroyd, M. A. (2008). Are individual differences in speech reception related to individual
differences in cognitive ability? A survey of twenty experimental studies with normal and
hearing-impaired adults. International Journal of Audiology, (47), S53 – S71.
Arlinger, S., Lunner, T., Lyxell, B., & Pichora-Fuller, M. K. (2009). The emergence of cognitive
hearing science. Scandinavian Journal of Psychology, (50), 371 – 384.
Atkinson, R., & Shiffren, R. (1968). Human Memory: A proposed system and its control
processes. In K.W. Spence & J. T. Spency (Eds.), The psychology of learning and
motivation, Vol 2. New York, NY: Academic Press.
Braden, J.P. (1990). Do deaf persons have a characteristic psychometric profile on the Wechsler
performance scales? Journal of Psychoeducational Assessment, 8(4), 518-526.
Bronkhorst, A.W., & Wagner, K. (2002). Evaluation of context effects in sentence recognition.
Journal of the Acoustical Society of America, 111(6), 2874-2886.
Carhart, R. (1946). Selection of Hearing Aids. Archives of Otolaryngology, 44, 1-18.
Dahan, D., & Mead, R. L. (2010). Context-conditioned generalization in adaptation to distorted
speech. Journal of Experimental Psychology: Human Perception and Performance,
36(3), 704-728.
Daneman, M., & Merikle, P. M. (1996). Working memory and language comprehension: A
meta-analysis. Psychonomic Bulletin and Review, 4(3), 422-433.
Domino, G., & Domino, M. (2006). Psychological testing an introduction (2nd Ed.). Cambridge,
Double Hearing Protection: Two Devices for Best Hearing Safety. (n.d.). Retrieved from
http://www.noisehelp.com/double-hearing-protection.html
Ericsson, K. A., & Kintsch, W. (1995). Long-term working memory. Psychological Review, 102,
211-245.
Giesbrecht, B. L. (2008). Evaluating the relationship among clinical measures of working
memory (unpublished doctoral dissertation). George Fox University, Newberg, OR).
Hall, S. J. (2006). Comparison between memory test results among persons with Alzheimer’s
disease (unpublished doctoral dissertation). George Fox University, Newberg, OR.
Hallgren, M., Larsby, B., Lyxell, B., & Arlinger, S. (2005). Speech understanding in quiet and
noise, with and without hearing aids. International Journal of Audiology, 44(10),
574-583.
Hofman, P.M., Van Riswick, J.G., Van Opstal, A.J. (1998). Relearning sound localization with
new ears. Natural Neuroscience, 1(5), 417-421.
Howieson, D. B., Dame, A., Camicioli, R., Sexton, G., Payami, H., & Kaye, J. A. (1997).
Cognitive markers preceding Alzheimer’s dementia in the healthy oldest old. Journal of
the American Geriatric Society, 45(5), 584-589.
Issaacson, J. E., & Vora, N. M. (2003). Differential diagnosis of treatment of hearing loss.
American Family Physician, 68, 1125-1132.
Issaacson, B., (2010). Hearing loss. Medical Clinics of North America, (94), 973-988.
Kintsch, W., Healy, A.F., Hegarty, M., Pennington, B. F., & Salthouse, T. A. (1999). Models of
working memory: Eight questions and some general issues. In Miyake & Shah (Eds.),
Models of Working Memory, 412-441. Cambridge, UK: Cambridge University Press.
Kramer, S. E., Zakveld, A. A., & Houtgast, T. (2009). Measuring cognitive factors is speech
comprehension. The value of using the Text Reception Threshold test as a visual
equivalent of the SRT test. Scandinavian Journal of Psychology, 50, 507-515.
Kutz, J. (2015, March 26). Audiology Pure-Tone Testing. Retrieved from http://emedicine.
Medscape.com/article/1822962-overview
Kyle, F. E., Campbell, R., Mohammed, T., Coleman, M., & MacSweencey, M. (2013). Speech
reading development in deaf and hard of hearing children: Introducing the test of child
speech reading. Journal of Speech, Language, and Hearing Research, 56(2), 416-426.
Lin, F. R., Metter, E. J., O’Brien, R. J., Resnick, S. M., Zonderman, A. B., & Ferrucci, L. (2011).
Hearing loss and incident dementia. JAMA Neurology, 68(2), 214-220.
Maerlender, A. (2010). Short-term memory and auditory processing disorders: Concurrent
validity and clinical diagnostic markers. Psychology in the Schools, 47, 975-984.
Mild and Unilateral Hearing Loss in Children. (n.d.). Retrieved from
http://www.asha.org/aud/articles/hearlosschild.htm
Niedzielski, Humeniuk, Blaziak, & Gwizda, (2006). Intellectual efficiency of children with
unilateral hearing loss. International Journal of Pediatric Otorhinolaryngology, 70,
1529-1532.
Noise Induced Hearing Loss. (n.d.). Retrieved from http://american-‐hearing.org/disorders/
Paludetti, G., Conti, G., Di Nardo, W., De Corso, E., Rolesi, R., Picciotti, P.M., & Fetoni, A. R.
(2012). Infant hearing loss: from diagnosis to therapy. Acta Otorhinolaryngologica
Italica, 32, 347-370.
Pichora-Fuller, M. (2006) Audition and cognition: What audiologists need to know about
listening. Phonak, International Adult Conference. Chicago, IL.
Pichora-Fuller, M., Johnson, C. E., & Roodenburg, K. E. J. (1998). The discrepancy between
hearing impairment and handicap in the elderly: Balancing transaction and interaction in
conversation. Journal of Applied Communication Research, 26, 99-119.
Piquado, T. P, Cousins, K. A.Q, Wingfield, A. & Miller, P. (2010). Effects of degraded sensory
input on memory for speech: Behavioral data and a test of biologically constrained
computational models. Brain Research, 1365, 48-65.
Plapinger, D. S., & Sikora, D. M. (1995). The use of standardized test batteries in assessing the
skill development of children with mild-to-moderate sensorineural hearing loss.
Language, Speech, and Hearing Services in Schools, 26, 39-44.
Preece, J. P., & Fowler, C. G. (1992). Relationship of pure-tone averages to speech reception
threshold for male and female speakers. Journal of the American Academy of Audiology,
3, 221-224.
Prevalence of Hearing Loss. (n.d.). The Better Hearing Institute. Retrieved from http://www.
betterhearing.org/hearingpedia/prevalence-hearing-loss
Rabbitt, P. (1968) Channel capacity, intelligibility, and immediate memory. Quarterly Journal of
Rabbitt, P. (1990) Mild hearing loss can cause apparent memory failures which increase with age
and reduce with IQ. Acta Otolaryngologia, 476, 167-176.
Ronnberg, J. (2003). Cognition in the hearing impaired and deaf as a bridge between signal and
dialogue: a framework and a model. International Journal of Audiology, 42, S68-S76.
Rose, N. S., Myerson, J., Roediger, H. L. III, & Hale, S. (2010). Similarities and Differences
between working memory and long-term memory: Evidence from the
levels-of-processing span task. Journal of Experimental Psychology: Learning, Memory, and
Cognition, 2, 471-483.
Shahidipour, Z., Geshani, A., Jafari, Z., Jalaie, S., & Khosravifard, E. (2013). Auditory memory
deficit in elderly people with hearing loss. Iranian Journal of Otorhinolaryngology,
25(72), 169-176.
Sheslow, D., & Adams, W. (2003). Wide range assessment of memory and learning (2nd Ed.).
Lutz, FL: Wide Range.
Sink, C. A., & Mvududu, N. H. (2010). Statistical power, sampling, and effect sizes: Three keys
to research relevancy. Counseling Outcome Research and Evaluation, 1(2) 1-18.
Speechreading –e-Michigan Deaf and Hard of Hearing. (n.d.). Retrieved from http://www.
michdhh.org/assistive_devices/speechreading.html
Strauss, E., Sherman, E., & Spreen, O. (2006). A compendium of neuropsychological tests:
Administration, norms, and commentary (3rd ed.). Oxford, United Kingdom: Oxford
Szudez, J., Ostevik A., Dziegilewshi, P., Robinson-Anagor, J., Gomaa, N., Hodgetts, B., & Ho,
A. (2012). Can you hear me now? Validation of an iPod-based hearing loss screening
test. Journal of Otolaryngology – Head & Neck Surgery, 41(1), S78-84.
Tun, P. A., Benichov, J. & Wingfield, A. (2010). Response latencies in auditory sentence
comprehension: Effects of linguistic versus perceptual challenge. Psychology and Aging,
25(3), 730-735.
Uhlmann, R. F., Teri, L., Rees, T. S., Mozlowski, K. J., & Larson, E. B. (1989). Impact of mild
to moderate hearing loss on mental status testing. Comparability of standard and written
Mini-Mental State Examinations. Journal of the American Geriatrics Society, 37(3),
223-228.
Van Boxtel, C. E. M., Van Beijstervellt, P. J., Houx, L. J. C., Anteunis, J. F. M., Metsemakes, &
Jolles, J. (2000). Mild hearing impairment can reduce verbal memory performance in a
healthy adult population. Journal of Clinical and Experimental Neuropsychology, 22(1),
147-154.
Vernon M., (2005). Fifty years of research on the intelligence of deaf and head-of-hearing
children: A review of literature and discussion of implications. Journal of Deaf Studies
and Deaf Education, 10(3), 225-231.
Wang, J., Zupancic, S., Ray, C., Cordero, J., & Demke, J. (2014). Hearing test app useful for
initial screening, original research shows. The Hearing Journal, 67(10), 32-35.
Wake, M., Hughes E. K., Poulakis Z., Collins C. & Rickards, F. W. (2004). Outcomes of
children with mild-profound congenital hearing loss at 7 to 8 years: A population study.
Wechsler, D. (2008). Wechsler adult intelligence scale – fourth edition. San Antonio, TX: The
Psychological Corporation.
Wingfield, A., Tun, P. A., & McCoy, S. L. (2005). Hearing loss in older adulthood: What is it
and how it interacts with cognitive performance. Current Directions in Psychological