ISSN (Print) : 2347 - 6710
I
nternational
J
ournal of
I
nnovative
R
esearch in
S
cience,
E
ngineering and
T
echnology
Volume 3, Special Issue 3, March 2014
2014
I
nternational
C
onference on
I
nnovations in
E
ngineering and
T
echnology (ICIET’14)
On 21st & 22nd March Organized by
K.L.N. College of Engineering, Madurai, Tamil Nadu, India
Copyright to IJIRSET www.ijirset.com
405
M.R. Thansekhar and N. Balaji (Eds.): ICIET’14
Active Power Measurement Based
Harmonic Source Detection in Power
System by Using Wavelet Transform
R.Thulasiram
#1, Ms.S.Rajeswari
*Department of ECE, PSN College of Engineering & Technology, Tirunelveli, India
Asst. Professor [Grade 2], Department of ECE, PSN College of Engineering & Technology, Tirunelveli, India
ABSTRACT-. Harmonic pollution is one of the major issue in the modern power system. The harmonic pollution affects the power stability of industries and consumers. As the power system network are expanding more and more, it necessitates responsive detection of harmonic source and accurate identification of harmonic disturbances in order that remedial measures can be taken for the improvement of power quality. This paper presents a new method based on discrete wavelet transform for the detection of harmonic source and identification of harmonic content. It is based on the analysis of detail active power measurement approach. The detail active powers at the lowest level along with the details pollution factor have been used to clearly identify the location of the harmonic source. The simulation results presented here show that the proposed method can effectively indicate the presence of nonlinear load under both sinusoidal and distorted supplies and can also detect the dominant source of harmonic pollution in power system network.
KEYWORDS-power uality,harmonics,wavelettransform Detection of harmonic sources.
I.INTRODUCTION
With the increased use of non linear loads like power electronic switches and computer controlled devices there has been an increase in voltage and current distortion in the distribution network. The presence of voltage and current distortion is harmful to the equipment connected in the power system network. Harmonics can be produced by the loads only, by the source only or by both the source and the load. The power component definitions contained in IEEE Standard 1459-2000 has been reformulated using discrete wavelet transform in both single phase [2] and three phase [3] systems. The measurement of power components using stationary
wavelet transform keeps all time characteristics of the nonstationary waveform while providing different frequency resolutions [4]. The time domain strategy [5]
for the detection of fundamental and harmonic components of voltages and currents is able to evaluate all the quantities of IEEE Standard 1459-2000.
Harmonic pollution source detection is the first step towards improving the power quality of the network. The total harmonic power method [13,14] is the method for the identification and measurement of harmonic pollution in radial and non radial systems. The signs of total and individual harmonic powers can provide detailed information about the harmonic pollution [15].
Wavelet packet transform can be used for power calculations of both fundamental and harmonics of signal
[16]. At each wavelet decomposition level the squared value of the detail information is calculated as their energy to construct the feature vector for analysis. Multiwavelet transform is a powerful tool for the recognition of power quality disturbances [18]. Accurate detection, classification and location of faults are of great importance for economic operation of power systems [19– 21]. Wavelet transform can also be of great assistance for digital differential protection [22] and voltage sag detection [23]. An approach to select the most suitable mother wavelet to achieve accurate measurement of steady state harmonic distortion has been presented in
[25].
Copyright to IJIRSET www.ijirset.com
406
M.R. Thansekhar and N. Balaji (Eds.): ICIET’14
discrete wavelet transform has been used to get the detail active power at different levels of resolution. It has been verified that signs of the detail powers can detect the location of the dominant source of harmonic pollution. This method can clearly identify whether the harmonic pollution is due to the source only, load only or both by the source and the load.
II.REFORMULATING OF POWER COMPONENTS DEFINITIONS IN WAVELET
DOMAIN
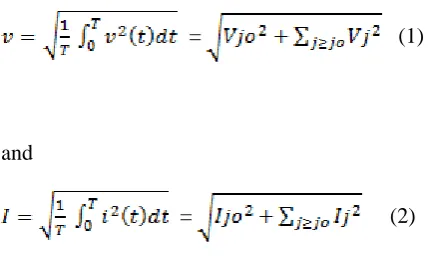
In nonsinusoidal situations, power components definitions are based on a frequency domain approach using Fourier Transform (FT). The frequency domain approach can provide amplitude–frequency spectrum information loosing time related information. To overcome these limitations time frequency based approaches are developed to define power quantities and quality factors through the use of wavelet transform. The rms values of voltage and current are:
=
(1)
and
=
(2)
The rms value of the voltage (Vj0) and current (Ij0) of the lowest frequency band j0 are also called approximated voltage (Vapp) and approximated current (Iapp), respectively. The sets of rms values of voltage (Vj) and current (Ij) of each frequency band or wavelet-level higher than or equal to the scaling level j0 are called detailed voltage (Vdet) and detailed current (Idet), respectively.
The approximation and detail active power are
Papp = 1/T
(3)
and
P
det = 1/T
(4)
Here C’jo,k and Cjo,k are the voltage and current discrete wavelet coefficients at the scaling level j0 and k while D’jo,k and Djo,k are the voltage and current discrete wavelet coefficients at any other level j than the scaling level j0 and sample k.
Total Power P=Papp+ Pdet (5)
Apparent power Sapp =Vapp Iapp
= VjoIjo (6)
Current distortion power
Di = VappIdet (7)
Voltage distortion power
Dv = Vdet Iapp (8)
Details apparent power
Sdet =Vdet Idet (9)
Details distortion power = Ddet
Ddet = (10)
Total apparent power S is (11)
= (12)
The details pollution DP is the ratio of the non-approximation apparent power SN to the approximation
apparent power Sapp, i.e
DP= SN/Sapp (13)
III.IDENTIFICATION OF HARMONIC CONTENT
Copyright to IJIRSET www.ijirset.com
407
M.R. Thansekhar and N. Balaji (Eds.): ICIET’14
Fig 2: Approx co-eff for db5
Fig 3:detail co-eff for db5
Fig 4: detail co-eff of level 5 for db5
Fig 5: Approx co-eff of level 5 for db5
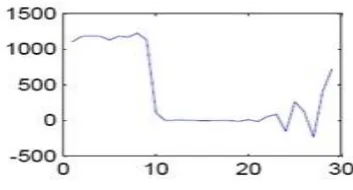
Consider the Fig 1,the first fig is the original harmonic signal. Next the signal is decomposed into detail signal and approximate signal with the help of wavelet transform. Again the detail signal is decomposed into 6 levels. By decomposing signal into 6 levels ,the exact harmonic content was identified. The decomposed signals will also give the accurate information about time and frequency information of harmonic content. The main difference between decomposing detail and approximate signal is getting information about low and high frequency harmonics. The decomposed detail signal will give information about low frequency harmonics. The decomposed approximate signal will give information about high frequency harmonics
.
VI.DETECTION OF HARMONIC SOURCE
The direction of harmonic power flow with respect to the direction of the flow of fundamental frequency power has been used to identify the location of the harmonic source in the literature. The total harmonic power method for identifying the source of harmonic pollution in radial system is presented in [15].The total harmonic power at a certain node is used for the indication of existence of a polluting load. If the total harmonic power is positive at a certain node in the system then a harmonic source exists upstream and the harmonic power is received from the source side. If the total harmonic power is negative then a harmonic source exists downstream of the node and the harmonic power is received from the load side. The signs of individual harmonic powers have been used to identify the dominant source of harmonic pollution at each harmonic order. The effect of nonsinusoidal supply has not been considered here. A single point strategy for the detection of harmonic sources developed from IEEE Standard 1459-2000 approach is presented in [10].
Copyright to IJIRSET www.ijirset.com
408
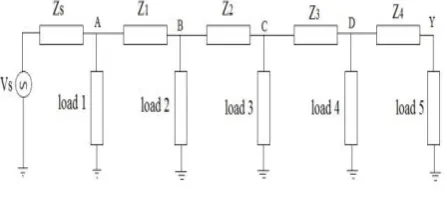
M.R. Thansekhar and N. Balaji (Eds.): ICIET’14 Fig. 6 shows a radial power system network with
five loads. This network is used to perform experimentation for the identification of a feature signature of harmonic source and also to validate the proposed method in a later section. The fundamental frequency internal impedance of the voltage source ZS is considered to be 1 + j 6.28 Ω and the line impedance is 1 + j 12.56 Ω. The fundamental frequency impedance of each load viz. Z1, Z2, Z3 and Z4 is 100 + j 62.8 Ω when all the loads are linear and thyrsitor controlled bridge rectifier is connected with each load to make it a nonlinear load. The nonlinearity of the load has been varied by varying the firing angles of the thyristor. EMTP simulation package has been used to capture the instantaneous voltage and current waveforms at the different nodes in the system. The voltages and currents are processed and analyzed using discrete wavelet transform in MATLAB.
Fig 6: Linear and nonlinear loads in a radial network.
CASE – I: supply non sinusoidal with linear loads
The supply voltage is assumed to be nonlinear as V = 230 sin 314t + 60 sin 942t + 15 sin 1570t + 4 sin 2198t. The loads are linear. The detail power analysis results are given in Table 1. Since the supply is the source for the harmonics and loads are linear, all detail powers are found to be positive i.e., direction of flowing is same as the fundamental frequency power
.
CASE – II (a): sinusoidal supply, load at node C is nonlinear, all other loads are linear
Here the supply is assumed to be pure sinusoidal with V=230 sin 314t .The nonlinear load at node C. Detail power and details pollution obtained from wavelet analysis are shown in Table 2. The detail powers Pdet5 are all negative up to point C and beyond point C all are positive.
At node C, DP is high i.e., amount of harmonic pollution is high.
Table 2: sinusoidal supply with nonlinear load at D
CASE – II (b): sinusoidal supply, load at node D is nonlinear, all other loads are linear
In this case also the supply is linear, but the load at D is made nonlinear. The detail power analysis results are given in Table 3. It is seen that detail powers at level 5 is negative up to node D where the nonlinear load is connected, and detail pollution at node D is high.
Table 3: sinusoidal supply with nonlinear load at D
Node Pdet5 DP
A 0.0125 0.2068
B 0.0047 0.2068
C 0.002 0.2067
D 8.635* 0.2067
Y 3.445* 0.206
Node Pdet5 DP
A -0.003 0.035
B -0.0039 0.052
C -0.0246 0.28
D 0.0166 0.09
Y 0.0059 0.08
Node Pdet5 DP
A -6.95* 0.031
B -0.0022 0.0387
C -0.0064 0.065
D -0.0189 0.14
Y 0.0106 0.13
Copyright to IJIRSET www.ijirset.com
409
M.R. Thansekhar and N. Balaji (Eds.): ICIET’14 CASE – III: nonsinusoidal supply, nonlinear load at
node C
Here supply is nonsinusoidal and the load at C is nonlinear. The detail power analysis is shown in
Table 4. The sign of the detail power Pdet1 at the node adjacent to the supply is positive indicating location of nonsinusoidal source in the upstream side. At nodes B and C the sign of Pdet5 is negative indicating location of nonlinear load at node C. As the nonlinear load is located at C, nodes D and Y receive harmonic power from the upstream side as indicated by the positive sign of Pde5 at D and Y.
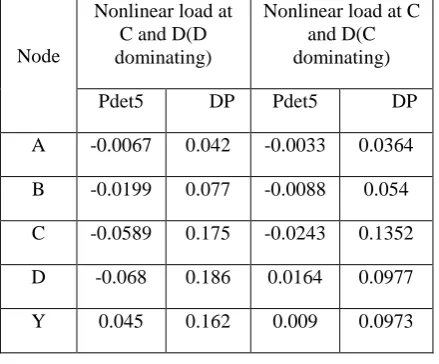
CASE – IV: sinusoidal supply with two adjacent nonlinear loads
In this case we consider the method of detection of harmonic source when more than one nonlinear load is present. We consider sinusoidal supply and two adjacent nonlinear loads at C and D as shown in
Table 5.Nonlinear load is present in C and D. As DP is higher at D than at C hence detail power Pdet5 is negative up to point D indicating that the nonlinear load at D is acting as the dominant source of harmonic pollution. The magnitude of detail power Pdet5 is maximum at D and decreases according to the decreasing order of DP. When DP at C is higher than DP at D then positive detail power at D indicates that the nonlinear load is located upstream with respect to point D.
Table 5: sinusoidal supply with two adjacent nonlinear loads
VI.CONCLUSION
In this paper a new method based on active detail power measurement has been proposed for the identification of the of harmonics and harmonic pollution source in power systems. This method is based on the comparison of signs of detail powers at lower level of decomposition. The location of the nonlinear load when a single nonlinear load is present and also location of the dominant source of harmonic pollution when more than one nonlinear load are present can be detected by observing the signs of the detail powers. The presence of harmonics in the source can be detected from the magnitude of details power at the highest level of decomposition.Simulation results show that the proposed method can give useful indications about the location of the dominant harmonic source, upstream or downstream the point of measurement.
REFERENCES
[1] Morsi WG, El-Hawary ME. Defining power components in nonsinusoidal unbalanced polyphase systems: the issues. IEEE Trans Power Deliv 2007;22(4): 2428–38.
[2] Morsi WG, El-Hawary ME. Reformulating power components definitions contained in the IEEE Standard 1459-2000 using discrete wavelet transform. IEEE Trans Power Deliv 2007;22(3):1910–6. [3] Morsi WG, El-Hawary ME. Reformulating three-phase power components definitions contained in the IEEE Standard 1459-2000 using discrete wavelet transform. IEEE Trans Power Deliv 2007;22(3):1917– 25.
[4] Morsi WG, El-Hawary ME. A new perspective for the IEEE Standard 1459-2000 via stationary wavelet transform in the presence of nonstationary power quality disturbance. IEEE Trans Power Deliv 2008;23(4):2356–65.
[5] Cataliotti A, Cosentino V. A time-domain strategy for the measurement of IEEE Standard 1459-2000 power quantities in nonsinusoidal three-phase and single-phase systems. IEEE Trans Power Deliv 2008;23(4):2113–23.
[6] Cristaldi L, Ferrero A, Salicone S. A. distributed system for
Node
Nonlinear load at C and D(D dominating)
Nonlinear load at C and D(C dominating)
Pdet5 DP Pdet5 DP
A -0.0067 0.042 -0.0033 0.0364
B -0.0199 0.077 -0.0088 0.054
C -0.0589 0.175 -0.0243 0.1352
D -0.068 0.186 0.0164 0.0977
Y 0.045 0.162 0.009 0.0973
Node Pdet5 DP
A 0.0103 0.229
B -0.0021 0.2275
C -0.0184 0.248
D 0.0145 0.237
Y 0.005 0.228
Copyright to IJIRSET www.ijirset.com
410
M.R. Thansekhar and N. Balaji (Eds.): ICIET’14
electric power quality measurement. IEEE Trans Instrum Measurement 2002;51(4):776–81.
[7] Barbaro PV, Cataliotti A, Cosentino V, Nuccio S. A novel approach based on nonactive power for the identification of distributing loads in power systems. IEEE Trans Power Deliv 2007;23(3):1782–9.
[8] Cataliotti A, Cosentino V, Nuccio S. Comparison of nonactive power for the detection of dominant harmonic sources in power systems. IEEE Trans Instrum Measurement 2008;57(8):1554–61.
[9] Cataliotti A, Cosentino V. Distributing load identification in power systems: a single-point time-domain method based on IEEE 1459-2000. IEEE Trans Instrum Measurement 2009;58(5):1436–45.
[10] Cataliotti A, Cosentino V. A new measurement for detection of harmonic source in power system based on the approach of IEEE Std. 1459-2000. IEEE Trans Power Deliv 2010;25(1):332–40.
[11] Aiello M, Cataliotti A, Cosentino V, Nuccio S. A self-synchronizing instrument for harmonic source detection in power systems. IEEE Trans Instrum Measurement 2005;54(1):15–23. [12] Cataliotti A, Cosentino V, Nuccio S. A. Virtual instrument for the measurement of IEEE Std. 1459-2000 power quantities. IEEE Trans Instrum Measurement 2008;57(1):85–94.
[13] Swart PH, Case MJ, Van Wyk JD. On techniques for localization of sources producing distortion in electric power networks. In: The 2nd international workshop on power definitions and measurements under nonsinusoidal conditions, Stresa, Italy; 8–10 September 1993.
[14] Tanaka T, Akagi H. A new method of harmonic power detection based on instantaneous active power in three phase circuits. IEEE Trans on Power Deliv 1995;10(4):1737–42.
[15] Omran WA, El-Goharey HSK, Kazerani M, Salama MMA. Identification and measurement of harmonic pollution for radial and nonradial systems. IEEE Trans Power Deliv 2009;24(3):1642– 50.
[16] Vatansever F, Ozdemir A. Power parameters calculations based on wavelet packet transform. Electr Power Energy Syst 2009;31:596–603. [17] He H, Shen X, Starzyk JA. Power quality disturbances analysis based on EDMRA method. Electr Power Energy Syst 2009;31:258–68. [18] Kaewarsa S, Attakitmongcol K, Kulworawanichpong T. Recognition of power quality events by using multiwavelet-based neural networks. Electr Power Energy Syst 2008;30:254–60.
[19] Eisa AA, Ramar K. Accurate one end fault location for overhead transmission lines in interconnected power systems. Electr Power Energy Syst 2010;32: 383–9.
[20] Bhowmik PS, Purkait P, Bhattacharya K. A novel wavelet transform aided neural network based transmission line fault analysis method. Electr Power Energy Syst 2009;31:213–9.
[21] Safty SE, Zonkoly AE. Applying wavelet entropy principle in fault classification. Electr Power Energy Syst 2009;31:604–7.
[22] Vahidi B, Ghaffarzadeh N, Hosseinian SH. A wavelet based method to discriminate internal faults from inrush currents using correlation coefficient. Electr Power Energy Syst 2010;32:788–93.
[23] Gencer O, Ozturk S, Erfidan T. A new approach to voltage sag detection based on wavelet transform. Electr Power Energy Syst 2010;32:133–40.
[24] Ghaemi A H, Abyaneh HA, Mazlumi K. Harmonic indices assessment by wavelet transform. Electr Power Energy Syst 2011;33:1399–409.