609
OPTIMAL SIZING AND PLACEMENT OF DISTRIBUTED
GENERATORS IN DISTORTED DISTRIBUTION SYSTEM BY
USING HYBRID GA-PSO
1D.KAVITHA, 2Dr.P.RENUGA, 3S.MUTHAMIL PRIYA
1
Assitant Professor, Department of Electrical Engineering, Thiagarajar College of Engg, Madurai, India
2
Associate Professor, Department of Electrical Engineering, Thiagarajar College of Engg, Madurai, India
3
Post Graduate Student, Department of Electrical Engineering, Thiagarajar College of Engg, Madurai, India E-mail: 1
ABSTRACT
In this paper, an approach using Hybrid Genetic Algorithm and Particle Swarm Optimization Search (HGAPSO) is presented for placing Distributed Generators (DGs) in distorted distribution system. The objective is to minimize the loss and average voltage total harmonic distortion (THDv) of the distorted
distribution system. A detailed performance analysis is carried out on IEEE 18 bus system to express the effectiveness of the proposed method.
Keywords: Distributed generation (DG), genetic algorithm (GA), multi objective optimization, harmonic
distortion, non linear programming.
1. INTRODUCTION
Distributed generation is the practice of locating small electrical power generation units close to the point of locating small electrical power generation units close to the point of end use. It is the ideal solution for many goals because smaller generation units are readily available, simple to install and operate, easy to relocate, modular and cost effective. The presence of Distributed Generations (DG) in power systems may lead to several advantages such as providing sensitive load protection, reducing transmission and distribution network congestion and expansion, and improving the overall system performance by reducing power losses and enhancing voltage profiles.
In terms of the DG interfacing, DGs can be classified into two types, namely, inverter based DG and non-inverter based DG. Examples of inverter based DG are photovoltaic systems, wind turbine generators, fuel cells, and micro turbines, which use power converters as interfacing devices to the grid. On the other hand, small hydro synchronous generators and induction generators are considered to be non-inverter based DG units. The X/R ratio for distribution levels is low compared to transmission levels, causing high power losses and a drop in voltage magnitude along radial distribution lines. Studies have indicated that approximately 13% of the total power generated is consumed as real power losses at the distribution level. Such non-negligible losses have a direct
impact on the financial issues and overall efficiency of distribution utilities. Traditionally, distribution power losses are minimized through proper dispatch of reactive power control devices, which can be done by deploying automatic voltage regulators (tap changing transformers) and shunt capacitors installed at low voltage buses.
The installation of Distributed Generation (DG) units is becoming more prominent in distribution systems due to their overall positive impacts on power networks. Some major advantages of integrated DGs include reducing power losses, improving voltage profiles, reducing emission impacts and improving power quality. Because of these benefits, utility companies have started to change their electric infrastructure to adapt to the introduction of DGs in their distribution systems. However, a large number of DG units in a distribution system may sometimes contribute to high levels of harmonic distortion even though the emission level of the individual DG units comply with the harmonic standards.
610 Moreover, installing DG units is not straightforward, and thus the placement and sizing of DG units should be carefully addressed. Investigating this optimization problem is the major motivation of this research.
Researchers focus on heuristic techniques that seek a good solution to a complex combinatorial problem within a reasonable time. Singh et al. [12] unlike other studies which dealt with the constant load models have studied on the effect of different load and sensitive to voltage and frequency. Authors of [13] have used an analytical method for optimal DG allocation, this method is based on the equivalent current injection that uses the bus-injection to current (BIBC) and branch-current to bus-voltage (BCBV) matrices which were developed based on the topological structure of the distribution systems and is widely implemented for the load flow analysis of the distribution systems, which causes reduction on the search space. However, this technique leads to more complex procedures. Hence researchers like: Khatod et al. [4] used an Evolutionary Programming for the placement of renewable distributed generators; Authors of [2], [5], [6] and [11] presented that the optimal sizing and placement of DG using PSO; Garcia et al. [7], Injeti et al. [10], Cheng et al. [14] and Moravej et al. [15] have proposed various heuristic algorithm techniques for the optimal placement of DG.
Most of the abovementioned DG sizing and placement problem requires harmonic analysis methods to study the impact of DGs on harmonic propagations in the distribution system. The optimal placement and sizing of DG using Gravitational Search Algorithm (GSA) [1] and sensitivity analysis was also studied in [1]. Here, the aim was to minimize the losses and THD and by improving the voltage profile. Another similar study was reported in [8] in which harmony search algorithm (HSA) was used for solving the optimal placement and sizing of DG. The objective function of this study was to improve the voltage profile and to minimize loss.
To improve computation efficiency, hybrid optimization algorithms have been increasingly used to achieve their individual advantages, simultaneously. GA has been combined with other meta-heuristics and heuristics to attain more efficiency from computational point of view. Moradi et al. [9] proposed that the combination of both GA and PSO. The objective of this paper is that reduces the losses and improves the power quality of the system. In this paper a hybrid GA– PSO approach is applied to benefit from advantages
of both genetic algorithm and particle swarm optimization.
The main goal of this paper is to solve the optimal Dg placement and sizing problem in distorted distribution network. The problem is solved using Hybrid Genetic Algorithm and Particle Swarm Optimization search (HGAPSO). The optimization problem aims to find the optimal place and size of DG by using the total real power losses and THDv are considered as the objectives
that should be minimized simultaneously.
The proposed methodology is then tested in an IEEE 18-bus distorted distribution system. The results show the efficiency of the proposed algorithm at minimizing the losses and THDv, as well as improving the voltage profile. The result of the proposed technique indicates the highest performance in getting the best fitness and the highest convergence rate. The results also demonstrate that the efficiency of the proposed technique for minimizing the total losses and average THDv.
2. PROBLEM FORMULATION
A single objective optimization technique, formulated as a constrained non-linear integer optimization problem, is proposed for DG placement and sizing in a distribution system. The objective is to minimize the total power loss and the THDv, as well as improve the voltage profile of the distribution system. Therefore, the objective function consists of two main terms: minimization of real power loss and minimization of total harmonic distortion voltage.
2.1 Minimization of Power Loss (F1)
The objective function F1 is given as,
F1 = min (PLOSS (x)) (1)
where PLOSS is the total real power loss, which can
be expressed in the following equation,
PLOSS = LOSS i ; i =1, 2, ... , n (2)
Then individual power loss can be calculated using the equation,
P LOSS i = I 2
R (3) where I is the branch current between two buses. R is the resistance of the line.
2.2 Minimization of Average THDv (F2)
The objective function F2 is given as,
611 THDV = × 100
(5)
The average THDv is defined by,
THDV = (6)
where m is the number of buses.
2.3 Fitness Evaluation
The fitness function FMIN is given by,
FMIN = F1 + F2 (7)
The total power loss and THDv must be minimized according to the network power flow equations at fundamental and harmonic frequencies.
2.4 Operational Constraints 2.4.1 Bus voltage limit
The bus voltage magnitudes are to be kept within acceptable operating limits throughout the optimization process, as follows:
Vmin ≤ │ViRMS│≤ Vmax (8)
where Vmin is the lower bound of bus voltage limits.
Vmax is the upper bound of the voltage limits.
│ViRMS│ is the root mean square (RMS)
value of the ith
bus voltage. where
ViRMS =
(9)
where i and k are the bus number and harmonic order, respectively.
2.4.2 THD voltage limit
The total harmonic level (THDV) at each bus is
to be less than or equal to the maximum allowable harmonic level, as expressed as follows:
THDV ≤ THDV max (20)
where THDV max is the maximum allowable level at
each bus (5%).
2.4.3 The DG capacities
The capacity of each DG (PDG i) should also be
varied around its nominal value. Hence each (PDG )
must also be maintained within a permissible band, specified as [PDG min, PDG max ) where PDG min is the
minimum permissible value of each DG capacity and PDG max is the maximum permissible value of
each DG capacity. This should be a mandatory requirement because e.g. if a DG capacity is less than the specified minimum value, then the type
and cost of the corresponding DG should also be varied. The DG capacity limit is given as,
PDG min ≤ PDG ≤ PDG max (31)
3. PROPOSED METHODOLOGY
This proposed method aims at determining optimal DG allocation and sizing. To do so, the heuristic optimization technique named Hybrid Genetic Algorithm and Particle Swarm Optimization Search (HGAPSO) is used as the solving tool to mininmize the real power losses and THDv. An improved version of DPSO is employed
in this work. The mutation and cross-over as two operators in GA are used to increase the diversity of the optimizing variables. Firstly a radial distribution power flow (PF) algorithm is executed by using Bus Injection to Branch Current matris (BIBC). Then, HGAPSO is used to calculate the objective function and to verify bus voltage limits. To include the presence of harmonics, HGAPSO was integrated with a Harmonic Power Flow (HPF) algorithm. The results were compared to GA approach.
3.1 Genetic Algorithm (GA)
In the process of Genetic Algorithm, the population has n chromosomes that represent
candidate solution; each chromosome is an m dimensional real value vector where m is the number of optimized parameters. Therefore each optimized parameter represents a dimension of the problem space. The following description shows that the steps involved in GA approach.
Step 1: Randomly generate initial population
strings.
Step 2: Calculate the fitness value for each string in
the population and select the fittest members of the population.
Step 3: Reproduce using a probabilistic method
(e.g., roulette wheel).
Step 4: Create the pool after selection.
Step 5: Create offsprings through crossover and
mutation operation.
Step 6:`Evaluate the offsprings and calculate the
fitness value for each solution.
Step 7: If the search goal is achieved, or an
allowable generation is attained, return the best chromosome as the solution; otherwise go to step 4.
3.2 Discrete Particle Swarm Optimization (DPSO)
In DPSO, the population has n particles that
612 problem space. The DPSO technique can be described in the following steps:
Step 1: Initialization-Randomly generate particles
with feasible discrete position vectors and initialize a velocity vector for each particle.
Step 2: Evaluate the fitness value of each particle’s
position (p)
Step 3: If fitness (p) is better than fitness (pbest),
then pbest= p
Step 4: Set best of pbests as gbest.
Step 5: Update particle’s position & velocity
vectors by the equations, Vi
k+1
= ω Vi k
+ c1 rand1 × (Pbesti k
- Xi k
) + c2 rand2 × (Gbesti
k
- Xi k
) (12)
where Vi k
is current velocity of individual i at iteration k Vi
k+1
is modified velocity of individual i at iteration k + 1, Xi
k
is current position of individual i at iteration k, ω is inertia weight parameter, c1 , c2 are acceleration factors, rand1,
rand2 are random numbers between 0 and 1, Pbesti k
is the best position of individual i until iteration k, Gbesti
k
is the best position of the group until iteration k. Each individual moves from the current position to the next one by the modified velocity in the equation (2) using the following equation,
Xi k+1
= Vi k+1
+ Xi k
(43) The parameters c1 and c2 are set to constant
values. Low values allow individual to roam far from the target regions before being tugged back. On the other hand, high values result in abrupt movement towards target regions. Hence the acceleration constants c1 and c2 are normally set as
2.0 whereas rand1 and rand2 are random values, and they are uniformly distributed between zero and one. These values are not the same for each iteration because they are generated randomly every time.If a particle violates is position limits in any dimension set its position at the proper limit.
Step 5: Discretize the position vector of each
particle
Step 6: If one of the stopping criteria is satisfied
then stop, else go to step 4.
3.3 Hybrid GA-PSO approach
In this work, the placement and size of DGs are optimally determined. The objective function is composed of power loss and THDv along with the
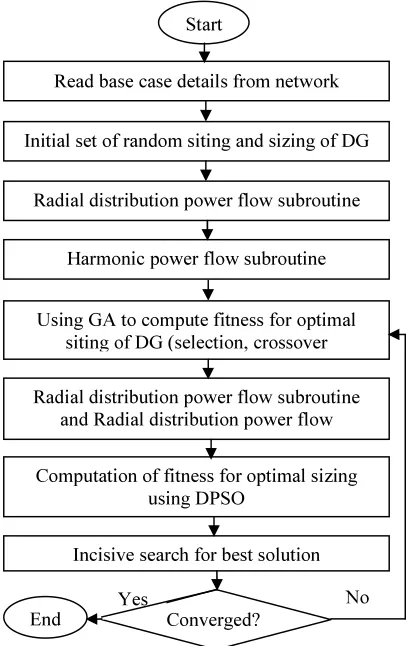
voltage profile. A DPSO, which is improved by applying the mutation and crossover to its optimizing variables, is employed as an optimization method. Interaction between the two algorithms as shown in figure 1goes as follows.
This is a searching technique developed for optimal sitting and sizing of DG. The problem consists of two parts. The first is the optimal location of DG and the second is the optimal sizing. Result for the first part is an integer which is either a bus number where DGs are suggested to be installed. This needs an integer-based optimization algorithm. GA has been chosen to play this role because of its attractive quality. The answer obtained from GA solution is used in PSO algorithm to optimize the sizing for DG. PSO has the fast convergence ability which is a great attractive property for a large iterative and time consuming problem.
[image:4.595.304.507.385.708.2]First the initial population for DG size and site are produced by random, and then the load flow and harmonic flow were run. In the next step the new site of DG is calculated by GA to optimize the objective function. The GA is run by the predetermined iteration and in each iteration for a candidate site, the size of DG is optimized by DPSO which this reduces the search area for the GA and gives better optimization in each iteration.
Figure 1: Flowchart for the proposed method Start
Read base case details from network
Initial set of random siting and sizing of DG
Radial distribution power flow subroutine
Harmonic power flow subroutine
Using GA to compute fitness for optimal siting of DG (selection, crossover
Radial distribution power flow subroutine and Radial distribution power flow
subroutine
Computation of fitness for optimal sizing using DPSO
Incisive search for best solution
Converged?
613 The algorithm for the proposed technique is explained briefly and given below:
• Initialization: Set the time counter t = 0 and generate randomly n chromosomes, this represent n initial candidates sitting of DG.
• Time updating: Update the time counter t = t + 1.
• New population: Create a new population of sitting of DG by repeating the following steps until the new population is completed:
- Selection - Crossover - Mutation
• Fitness using PSO: Evaluate each chromosome and optimal sizing of DG. ♣ Initialize particle population, modified
matrix and contain size of DG. ♣ Calculate the objective values which
are the total real power losses and THDv.
♣ Record objective function as the best candidate of particle and the minimum value as the current overall global best of the group.
♣ Update the velocity (v) and position. ♣ Check the stop criterion if it is
satisfied then stop.
• Check the stop criterion, if it is satisfied then stop, else go to time updating.
4. RESULTS AND DISCUSSIONS
Prior to DG placement, a load flow program based on Bus Injection to Branch Current matrix (BIBC) is calculated. Based on power flow results, Losses and voltage profile values are obtained. Bus location selection is based on the occurrences of minimum losses. These values are used to find the candidate buses i.e., DGs are placed at suitable bus positions.
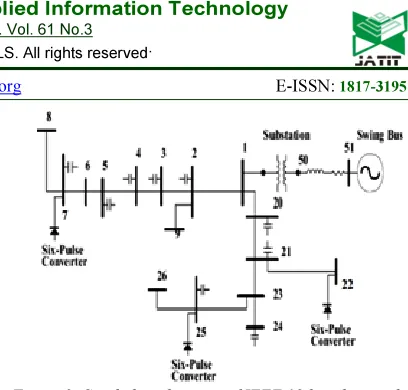
[image:5.595.304.508.72.267.2]The proposed method for optimal DG placement was tested in the presence of nonlinear loads on a 12.5 kV, 10 MVA, 18-bus, distorted IEEE distribution system (Figure 2), where bus-51 was considered a swing bus (reference bus). The system loads are considered as spot loads, with the total being 0.965 MW and 0.708 MVAR. The single line diagram of IEEE 18 bus distorted radial distribution system under study is given.
Figure 2: Single line diagram of IEEE 18 bus distorted distribution system
The optimal DG size and placement in the distribution systems of this work is coded in MATLAB® Version 7.12.0.635 (R2011a). MATLAB is a high-level language and interactive environment for numerical computation, visualization, and programming. Programmers and users of MATLAB can analyze data, develop algorithms, and create models and applications, using the language, tools, and built-in math functions to explore multiple approaches and solve technical computing problems faster. The maximum iteration for HGAPSO is chosen as100.
Two cases are considered with regards to the impact of DG installation as follows:
1) Without DG installed in the system. (i) Load flow analysis 2) Multiple DG units are installed in the
system.
The occurrence of the harmonics in the system can be incorporated with the harmonic producing loads, such as six pulse converter. These non linear loads are located at buses 7, 22 and 25. The typical harmonic spectrum of these non-linear loads is provided in table 1. In this work, DG is also considered as a harmonic producing device, i.e. Inverter based DG is used in the distribution system. In this paper, the number of DGs are assumed to be 2 and the range of the DG size is between 10 – 30% of total load.
For 18-bus distorted distribution system without installation of DG, load flow analysis using bus injection to branch current matrix, the voltage profile in the original system and the power losses are determined. The minimum and maximum voltage limits are set at 0.95 p.u and 1.05 p.u. The calculated real power losses and THDv are
614 pre and post installation of DG. Before installation of DG, voltage level of last bus was low. After installation; the voltage was improved.
Table 1: Harmonic spectrum of NL loads
Harmonic order Non linear loads at bus 7, 22 and 25 (%)
1 100
5 5.5
7 4.5
11 3.5
13 3.5
17 2.5
19 2
23 1
25 0.5
Figure 3: Voltage profile for 18 bus distorted distribution system with and without DG
Before applying HGAPSO, the parameters are tuned to enhance the performance of the proposed algorithm. The population size of 50 was selected for the HGAPSO approach. Then, the proposed technique has been compared with the GA technique. Table 2 depicts that the comparative results of both GA and HGAPSO. It shows that the optimal size and location of DG by using above two methods are equal i.e. the DGs are placed at the bus numbers of 7 and 25 with their corresponding sizes respectively.
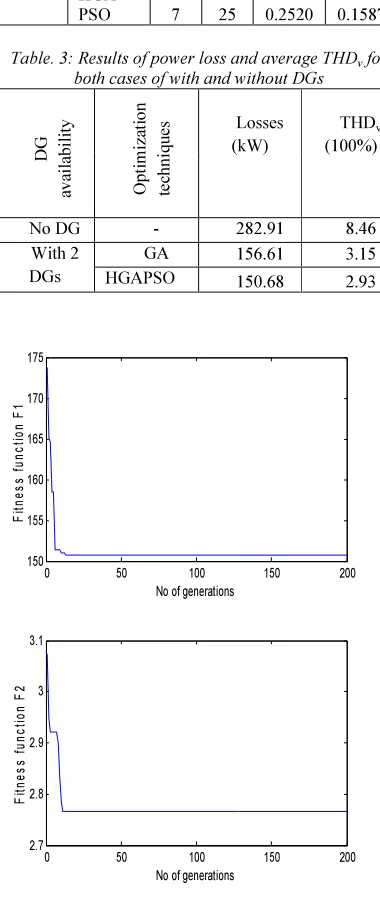
Table 3 reveals that the minimization of real power loss and average THDv. By using the proposed method HGAPSO, there is 53.26% of loss reduction. Also it clearly shows that the proposed method (HGAPSO) is better than the comparative method (GA). Figure 4 shows the convergence characteristics of power loss and THDv for
HGAPSO technique.
Table. 2: Results of optimal locations and sizes of DG
D G a v ai la b il it y O p ti m iz at io n te ch n iq u
es Location Size of the
DGs (MW) D G 1 D G 2 D G 1 D G 2 With 2 DGs
GA 7 25 0.2895 0.1791
[image:6.595.93.285.161.470.2]HGA-PSO 7 25 0.2520 0.1587
Table. 3: Results of power loss and average THDv for both cases of with and without DGs
D G av ai la b il it y O p ti mi za ti o n te ch n iq u
es Losses
(kW)
THDv
(100%)
No DG - 282.91 8.46
With 2 DGs
GA 156.61 3.15
HGAPSO 150.68 2.93
0 50 100 150 200
150 155 160 165 170 175
No of generations
F it n e s s f u n c ti o n F 1
0 50 100 150 200
2.7 2.8 2.9 3 3.1
No of generations
F it n e s s f u n c ti o n F 2
[image:6.595.307.497.243.694.2]615 From the results shown in the above tables, it can be distinguished that installing the DG with optimal placement and sizing has significant impacts on the reduction of total loss and average harmonic distortion in the distorted distribution system. The losses are decreased considerably when 2 DGs with optimal sizes are installed in the system. Table3 also evidently shows that the proposed technique gives the best solution in term of fitness and convergence rate for minimizing the losses and THDv compared to GA method.
5. CONCLUSION
This paper proposed a hybrid GA-PSO method for determining optimal placement and sizing of DG units. Here, Multiple DG installation cases were studied using IEEE 18 bus distorted distribution system. Two objectives to be minimized were considered in this approach: total real power loss and THDv. The multi objective
optimization problem attempted to determine a DG’s optimal place and size by using total real power losses and THDv as an objectives to be
minimized. The results were compared to GA approach. The results demonstrated and emphasized that multiple DG installations decreased total real power losses more than single DG installations. However, multiple DG installations may result in unnecessary additional costs.
REFERENCES
[1] Aida Fazliana ABDUL KADIR, Azah
MOHAMED, Hussain SHAREEF,
MohdZamri CHE WANIK,AhmadAsrul IBRAHIM, “Optimal Sizing and Placement of Distributed Generation in Distribution System Considering Losses and THDv using Gravitational Search
Algorithm”, PRZEGLAD
ELEKTROTECHNICZNY, ISSN
0033-209, R.89 NR 4/2013.
[2] AlRashidi, M.R.,AlHajri, “Optimal planning of multiple distributed generation sources in distribution networks: A new approach”, Energy Conversion and
Management 52 (2011) 3301–3308.
[3] A.R.R. de Souza, T.S.P. Fernandes , A.R. Aoki, M.R. Sans, A.P. Oening, D.C. Marcilio, J.S. Omori, “Sensitivity analysis to connect Distributed Generation”,
Electrical Power and Energy Systems 46
(2013) 145-152.
[4] Dheeraj K.Khatod, Vinay Pant, Jaydev Sharma, “Evolutionary programming based optimal placement of renewable distributed generators”, IEEE Transactions
on power systems, Volume 28, NO 2, May
2013.
[5] Eajal A., El-Hawary M.E., “Optimal capacitor placement and sizing in unbalanced distribution system with harmonic consideration using particle swarm optimization”, IEEE Trans. Power
Delivery, 25(2010), No. 1, 1734-1741.
[6] El-Zonkoly A.M, “Optimal placement of multi-distributed generation units including different load models using particle swarm optimization”, Swarm and
Evoutionary Computation 1 (2011) 50-59.
[7] Juan Andres Martin Garcia, Antonio Jose Gil Mena, “Optimal distributed generation location and size using a modified teaching-learning based optimization algorithm”, Electrical Power and Energy
Systems 50 (2013) 65-75.
[8] Komail Nekooei, Malihe M.Farsangi, Hossein Nezamabadi-Pour, and Kwang Y.Lee, “ An improved multi-objective harmony search for optimal placement of DGs in distribution systems”, IEEE
Transactions on smart grid, Vol.4, No. 1,
March 2013.
[9] M.H. Moradi, M. Abedini, “A combination of genetic algorithm and particle swarm optimization for optimal DG location and sizing in distribution systems”, Electrical Power and Energy
Systems 34 (2012) 66–74.
[10]Satish Kumar Injeti , N. Prema Kumar, “A novel approach to identify optimal access point and capacity of multiple DGs in a small, medium and large scale radial distribution systems”, Electrical Power
and Energy Systems 45 (2013) 142–151.
[11]SatishKansal, Vishal Kumar, BarjeevTyagi, “Optimal placement of different type of DG sources in distribution networks”, Electrical Power
and Energy Systems 53 (2013) 752–760.
[12]Singh RK, Goswami SK., “Optimum allocation of distributed generations basedon nodal pricing for profit, loss reduction, and voltage improvement including voltage rise issue”, Electrical
Power Energy System 2010;32:637–44.
616 of distributed generators in radial distorted systems”, Electric Power Systems
Research 79 (2009) 912–918.
[14]Wu Ouyang, Haozhong Cheng, Xiubin Zhang, Liangzhong Yao, “Distribution network planning method considering distributed generation for peak cutting”,
Energy Conversion and Management 51
(2010) 2394–2401.
[15]Zahra Moravej, Amir Akhlaghi, “A novel approach based on cuckoo search for DG allocation in distribution network”,
Electrical Power and Energy Systems 44