Open Journal of Metal, 2018, 8, 15-33 http://www.scirp.org/journal/ojmetal ISSN Online: 2164-277X ISSN Print: 2164-2761
DOI: 10.4236/ojmetal.2018.82002 Jun. 28, 2018 15 Open Journal of Metal
Effect of Deformation during Stamping on
Structure and Property Evolution in 3
rd
Generation AHSS
Daniel Branagan
1,
Craig Parsons
2, Tad Machrowicz
2, Jonathon Cischke
2, Andrew Frerichs
1,
Brian Meacham
1, Sheng Cheng
1, Grant Justice
1, Alla Sergueeva
11The NanoSteel Company, Idaho Falls, ID, USA 2The NanoSteel Company, Troy, MI, USA
Abstract
Over the past decade extensive development of advanced high strength steel (AHSS) was driven by the demand from the automotive industry for stronger materials that can enable lightweighting to meet increasing fuel efficiency re-quirements. However, achievement of higher strength in many AHSS grades comes with reductions in ductility, leading to geometric constraints on for-mability and limiting their application. In this paper, a 3rd Generation AHSS with a compelling property combination of high tensile strength of ~1200 MPa and total elongation > 40% was used for laboratory and stamping stu-dies. Various auto related laboratory tests were done including tensile testing, 180 degree bending, bulge testing, and cup drawing to estimate the steel’s formability under different applied conditions. Additionally, since laboratory testing provides only an estimation of the potential stamping response, the 3rd Generation AHSS sheet was stamped into B-pillars under industrial stamping conditions. Non-destructive and destructive analysis of the resulting stamp-ings were done to evaluate the microstructural and property changes occur-ring duoccur-ring stamping. Significant strengthening of material in the stamped part is attributed to the structural changes through the complex Nanophase Refinement and Strengthening mechanism.
Keywords
Steel, Advanced High Strength Steel, Cold Formability, Stamping, Structure, Properties
1. Introduction
With current market trends and governmental regulations pushing towards How to cite this paper: Branagan, D.,
Parsons, C., Machrowicz, T., Cischke, J., Frerichs, A., Meacham, B., Cheng, S., Justice, G. and Sergueeva, A. (2018) Effect of De-formation during Stamping on Structure and Property Evolution in 3rd Generation AHSS. Open Journal of Metal, 8, 15-33. https://doi.org/10.4236/ojmetal.2018.82002
Received: May 9, 2018 Accepted: June 25, 2018 Published: June 28, 2018
Copyright © 2018 by authors and Scientific Research Publishing Inc. This work is licensed under the Creative Commons Attribution International License (CC BY 4.0).
http://creativecommons.org/licenses/by/4.0/
DOI: 10.4236/ojmetal.2018.82002 16 Open Journal of Metal higher efficiency in vehicles, AHSS are increasingly being pursued for their abil-ity to provide reductions in gauge thickness compensated by higher strength [1] [2][3][4][5]. One of the biggest obstacles to using high strength steel sheets for automobile body components, to reduce weight and improve safety, are the is-sues related to limited formability. Different aspects of AHSS cold formability and related issues are widely discussed in various publications [6] [7] [8] [9]. Thus, improved formability of steel is enabling the design of more complex part geometries facilitating the desired weight reduction for automotive appli-cations.
Formability may be broken into two distinct forms: local formability and bulk formability [9]. Local formability provides the ability for an edge (or tight ra-dius) to be formed into a certain shape. Edges, which may occur in internal holes or external free surfaces may have reduced ductility due to the presence of de-fects such as cracks or structural changes resulting from the creation of the sheet edge. Edge formability is often measured using hole expansion ratio testing with holes put into the material by various methods including punching, laser cutting, milling, and wire-EDM. Bulk formability is dominated by the intrinsic ductility under both simple and complex stress states and may be affected by deformation pathway and the strain rate occurring during deformation. Bulk formability can be measured by a variety of methods under specific stress states with results of-ten summarized in a forming limit diagram.
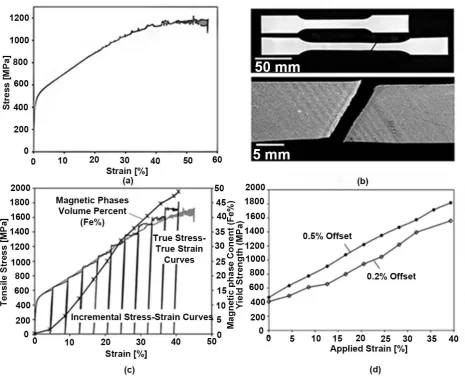
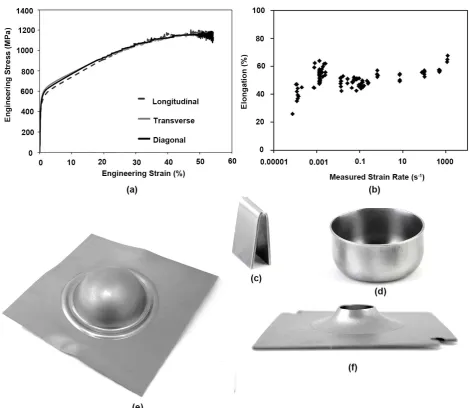
The World Auto Steel “banana plot” represents the trends of new steel devel-opment and the resulting paradox of strength and ductility [10]. The general trends are that increases in strength results in a reduction of ductility, which in turn is expected to lead to limited formability of sheet material during stamping operations. In March 2016, NanoSteel commercially launched a non-stainless 3rd Generation AHSS and in this paper, industrial produced blanks of NXG™ 1200 will be utilized for laboratory testing and industrial stamping [11][12][13][14] [15]. An example of the engineering tensile stress-strain curve for the sheet ma-terial tested in accordance with ASTM E8 standard [16] is shown in Figure 1(a). At the top of Figure 1(b), the tensile specimen corresponding to the engineering stress-strain curve in Figure 1(a) is shown before and after testing. A close-up view of the break area of the tensile specimen is provided at the bottom of Fig-ure 1(b). As can be seen, the sample failure occurred with a typical ~45˚ brea-kage and deformation bands parallel and perpendicular to the breabrea-kage are visi-ble on the sample surface. In the sample shown, dynamic strain aging (DSA) is found to occur commensurate with the serrations on the stress-strain curve (Figure 1(a)). The nature of the deformation bands, their dependence on strain rate and stress state has been described in detail previously [17].
D. Branagan et al.
[image:3.595.64.530.69.445.2]DOI: 10.4236/ojmetal.2018.82002 17 Open Journal of Metal
Figure 1. (a) Engineering stress-strain tensile curve of NXG™ 1200, (b) corresponding ASTM E8 tensile specimen before and after
testing (top image) and close-up view of the break in the tensile specimen illustrating presence of deformation bands (bottom image), (c) true stress–true strain tensile curve, incremental tensile testing curves, and magnetic phases volume percent (Fe%) at each strain increment, and (d) yield strength as a function of applied strain.
DOI: 10.4236/ojmetal.2018.82002 18 Open Journal of Metal In this paper, the focus will be on structure and property changes occurring in NanoSteel 3rd Generation AHSS when cold deformed. Results will include stu-dies on laboratory tensile specimens, incremental tensile testing for property evaluation as a function of strain and data from tests commonly used to estimate metal sheet formability including 180 degree bending, bulge testing, and cup drawing. Additionally, results will be included on non-destructive and destruc-tive testing of stampings from industrial produced blanks of NXG™ 1200 and the results will be compared to those generated from laboratory samples.
2. Background
2.1. Structural Changes during Deformation
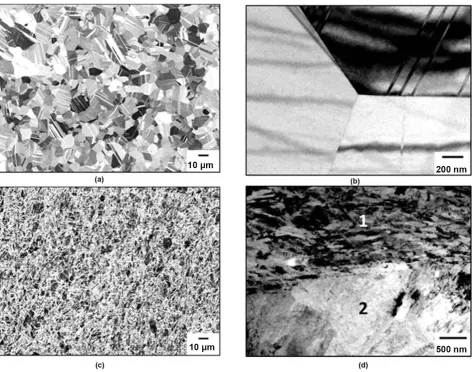
As shown in the previous section, NXG™ 1200 demonstrates a combination of high strength and ductility reaching 69,400 MPa% in the case of the example tensile curve in Figure 2(a). The microstructure in the 3rd Generation NanoSteel sheet before deformation (i.e. 3GNS-BD) corresponding to that in an industrial coil is illustrated by SEM and TEM micrographs in Figure 2(a) and Figure 2(b), respectively. The microstructure consists primarily of recrystallized mi-cron-sized austenite grains which can be seen as distinct grains at both magnifi-cations. Additional features on the micrographs are identified as annealing twins and stacking faults. Annealing twins, for example, can be readily seen in the up-per right grain of Figure 2(b). Detailed analysis of the structure (not presented here) also reveals a small fraction of ferrite (<1%) and the presence of isolated nanoprecipitates typically in the 5 to 100 nm size range. Note that the nanopre-cipitates, which are a strengthening component, were identified as separate phases: structurally, based on electron diffraction analysis, and chemically, based on energy dispersive spectroscopy scans.
During tensile testing to failure, the initial structure (3GNS-BD) undergoes Nanophase Refinement and Strengthening (NR&S) leading to formation of the final structure (3GNS-AD). The NR&S mechanism leading to structural evolu-tion during cold deformaevolu-tion described above involves complex interacevolu-tion of dislocation dominated deformation mechanisms along with phase transforma-tion, nanoscale phase formatransforma-tion, nanoprecipitatransforma-tion, and dynamic strain aging effects. In-depth information related to the details of this mechanism has been presented recently [17] [18]. In this paper, related to the analysis of metal stampings, the focus will be on the structural changes during forming operations and their correlation with that previously observed during tensile testing, which are described below.
D. Branagan et al.
[image:5.595.64.539.70.442.2]DOI: 10.4236/ojmetal.2018.82002 19 Open Journal of Metal
Figure 2. Microstructure in the NXG™ 1200 sheet before and after deformation; (a) SEM back-scattered micrograph of the initial
structure before deformation (3GNS-BD), (b) TEM bright-field micrograph of the same initial structure before deformation (3GNS-BD), (c) SEM back-scattered micrograph of the final structure after deformation (3GNS-AD), and (d) TEM bright-field micrograph of the same final structure after deformation (3GNS-AD) showing areas with ferrite (Microconstituent 1) and auste-nite (Microconstituent 2).
DOI: 10.4236/ojmetal.2018.82002 20 Open Journal of Metal
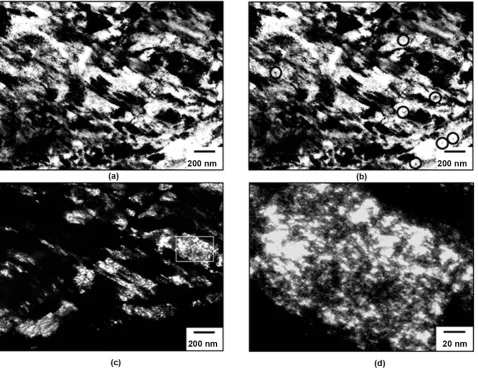
Figure 3. Microconstituent 1 in NXG™ 1200 structure after deformation; (a) TEM bright-field micrograph of Microconstituent 1
area of microstructure represented by ferrite grains and nanoprecipitates, (b) TEM bright-field micrograph with highlighted ex-amples of nanoprecipitates (see black circles), (c) TEM dark-field micrograph showing nanoscale size of the ferrite grains in Mi-croconstituent 1, and (d) high magnification TEM dark-field micrograph showing a selected nanoscale ferrite grain (marked by box in 3c) containing a high density of dislocation tangles.
In Figure 3(c), a TEM dark-field micrograph of the Microconstituent 1 area illustrates the nanoscale size of the ferrite grains that are typically from 150 to 300 nm in size and formed as a result of transformation from austenite during the deformation process. Newly formed nanoscale ferrite grains are also found to participate in the deformation process through dislocation mechanisms. In
Figure 3(d), a TEM dark-field micrograph shows a selected nanoscale ferrite grain at higher magnification. As it can be seen, this grain contains a high den-sity of dislocation tangles indicating that after formation, this grain continued to deform and contribute to global plasticity and is an enabling component in achieving the observed ductility (i.e. >40% total elongation).
D. Branagan et al.
[image:7.595.58.543.68.454.2]DOI: 10.4236/ojmetal.2018.82002 21 Open Journal of Metal
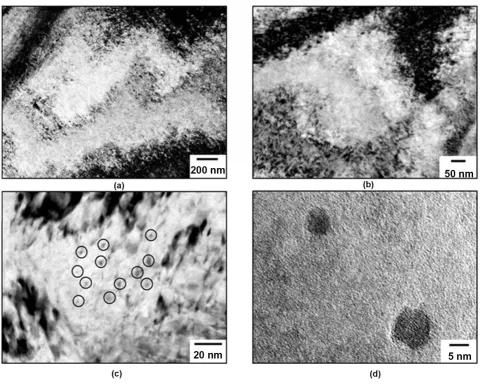
Figure 4. Microconstituent 2 in NXG™ 1200 structure after deformation; (a) TEM bright-field micrograph of Microconstituent 2
area of microstructure represented by micron-sized austenite grains and nanoprecipitates, (b) TEM bright-field micrograph of the deformed austenite grain at higher magnification showing a dislocation cell structure, (c) TEM micrograph highlighting examples of nanoprecipitates (see black circles), and (d) high resolution TEM micrograph illustrating two nanoprecipitates under 10 nm in size.
DOI: 10.4236/ojmetal.2018.82002 22 Open Journal of Metal
2.2. Cold Formability during Laboratory Tests
Various laboratory tests can be used to gain an understanding of a material’s potential performance upon stamping. A summary of various test results for commercially produced NXG™ 1200 sheet with thickness of 1.4 mm is presented below.
Tensile testing is one of the tests sometimes utilized for cold formability eval-uation. Uniaxial tensile testing was performed in accordance with the ASTM E8 standard [16]. Figure 5(a) shows typical tensile engineering stress vs. engineer-ing strain curves for samples cut in three different orientations with respect to rolling direction: longitudinal, transverse, and 45˚ diagonal. As it can be seen, similar properties were recorded independently from sample orientation. Un-iformity of the properties in different directions with respect to rolling is very important for the material performance at stamping operations, in order to avoid unexpected failures in a part with a complex geometry. In Figure 5(b), a total tensile elongation is plotted as a function of strain rate in a range from 0.0008 s−1 to 1200 s−1 at tensile testing. As shown, the total elongation until fail-ure remained constant up to 100 s−1 strain rate and increases, with at least 8 per-cent higher, between 100 s−1 and 1200 s−1. In recent publication by Kuhlman et
al.[19] more details provided on strain rate dependence. It was also shown that ductile fracture was observed in all samples tested in the utilized strain rate range [19].
Bendability was evaluated by ISO 7438 guided bend test method with a range of nose diameters down to approximately 0.5 mm. In this method, the specimen is set across two supports and lubricated. The forming nose is pushed downward in the middle of the supports and into the specimen until 180˚ bending occurs or until the sample fails. No cracking was observed in any bend samples down to R/t ratio of 0.34 at a 180° bend and in many samples as low R/t ratio as 0.23 (Figure 5(c)).
Drawability was evaluated by drawing full cups from circular blanks with a range of diameters into a die using a cylindrical ram having a 1.9” diameter. During the testing, a blank was centered in the hole of the die and the cylindrical ram was advanced into the die, thereby drawing in the blank. Drawing of the blank progressed until the material had either fully drawn into the die to form a cup, or ruptured. Using this method, the ability of the 1.4 mm gauge sheet to be drawn with draw ratio up to 1.9 without rupture or cracking was demonstrated (Figure 5(d)). More details on drawability and resistance to delayed cracking were provided in [20][21].
D. Branagan et al.
[image:9.595.63.533.70.478.2]DOI: 10.4236/ojmetal.2018.82002 23 Open Journal of Metal
Figure 5. NXG™ 1200 sheet material; (a) example of the directional tensile properties, (b) tensile elongation at a range of strain
rates, (c) example of the sample bent to 180 degree with R/t ratio of 0.39, (d) example of the drawn cup with draw ratio of 1.9, (e) example of the sample after bulge testing with dome height of 44.1 mm, and (f) example of the sample after hole expansion with ratio of 46.0%.
Hole expansion testing was used to evaluate edge stretchability of the material. Using samples with punched holes of 10 mm in diameter with punching speed of 228 mm/sec, hole expansion was performed at quasi static ram speed of 50 mm/min. An average hole expansion ratio of 45% was demonstrated (Figure 5(f)). By varying the method of hole preparation, punch speed, expansion speed, and/or reversing structural transformation at hole edge, a substantial increase in HER values with up to ≥140% can be achieved [22][23][24].
3. Results
3.1. Cold Formability during Commercial Stamping
DOI: 10.4236/ojmetal.2018.82002 24 Open Journal of Metal tensile testing, 180 degree bending, bulge testing, and cup drawing indicated that NanoSteel 3rd Generation AHSS should exhibit good cold formability during cold stamping. To test this assumption, samples of sheet from commercially produced coil with tensile properties provided in Figure 5(a) were used for B-pillar stamping trial at a commercial stamping facility with stamping speed es-timated at 290 mm/s. Using an existing die, NXG™ 1200 sheet was stamped into a B-pillar progressively through 4 stages without issues. Note that the blank was put into the die while cold and no external heating was applied. Die temperature and temperature rise from the adiabatic heating during deformation was not measured in this study. Signs of localized thinning/necking even in areas be-tween the expanded holes were not observed (see Figure 6(c)). The structure and properties of the material in the stamped part were examined in detail.
3.2. Non-Destructive Evaluation of Stamped Part
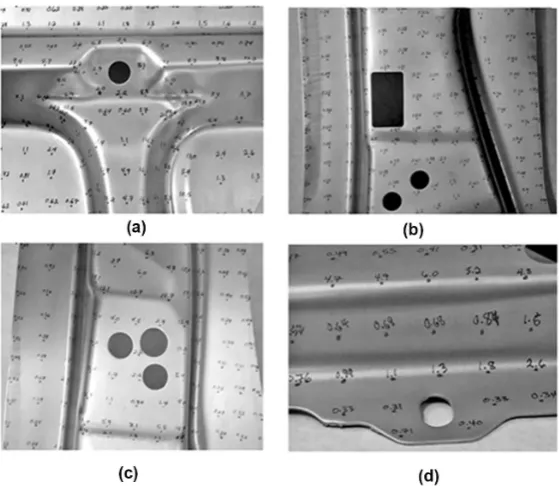
[image:10.595.234.514.450.693.2]Feritscope measurements provide an indication of the structural changes occur-ring duoccur-ring deformation from stamping. As shown previously, in the NXG™ 1200 sheet the initial 3GNS-BD structure changes from paramagnetic austenite to the ferromagnetic ferrite in the 3GNS-AD structure during cold deformation through the NR&S mechanism. Increase in the volume fraction of Microconsti-tuent 1 after deformation results in higher Fe% measured due to the formation of alpha-Fe. Measurements were taken by using a Fisher Feritscope from the stamped B-pillar surface with an ~20 mm grid pattern shown in Figure 6. Grid adjustments were made to hit specific features such as bent surfaces and corners. More than 1500 measurements were taken to essentially scan the entire B-pillar
Figure 6. B-pillar surface with ~20 mm grid pattern; (a) top section, (b)
D. Branagan et al.
DOI: 10.4236/ojmetal.2018.82002 25 Open Journal of Metal
to allow a correlation of non-destructive measurements with the destructive measurements in the next section. Note that the Feritscope uses a small 1.5 mm probe that allows data to be measured even in areas where destructive tensile testing is not possible due to a non-planar geometry. From the Feritscope mea-surements, Fe% varied in a range from 0.1% to 0.4% Fe% in most flat areas of the B-pillar (same as in the initial sheet before stamping) and up to 31 Fe% in the most deformed areas.
Rockwell C (HRc) hardness measurements were also used as a non-destructive method to evaluate the deformation effect during stamping operation on ma-terial structure and properties. However, in contrast to Feritscope measure-ments, this method is limited to flat surfaces for measurements and cannot pro-vide information on the most deformed curved areas of the B-pillar. The hard-ness of the sheet before stamping was ~20 HRc. Hardhard-ness in a range from 20 to 47 HRc was recorded for the stamped part confirming the strengthening effect from the NR&S mechanism activation during stamping.
3.3. Destructive Evaluation of Stamped Part
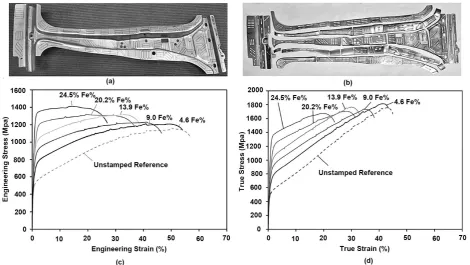
For destructive analysis, tensile specimens were cut along the entire length of the B-pillar as shown in Figure 7(a) and Figure 7(b). Tensile specimens with a re-duced size (i.e. 12.5 mm gauge) were used to evaluate material properties in the stamped part [25]. In total, 213 tensile specimens were tested. Tensile testing was done on an Instron mechanical testing frame (Model 5984), utilizing Instron’s Bluehill control and analysis software. All tests were run at ambient temperature in displacement control. Samples were tested at a displacement rate of 0.025 mm/s during initial loading to 2% strain and 0.125 mm/s for the remaining du-ration of the test. Rockwell C hardness and Feritscope measurements were taken from each tensile specimen. Tensile property data for selected specimens are listed in Table 1.
Examples of the stress – strain curves for specimens cut from the B-pillar with various levels of magnetic phases volume percent (Fe%) are presented in Figure 7(c). Corresponding true stress-true strain curves in Figure 7(d) show extensive strain hardening in the material indicating the effect of NR&S on the sheet structure during stamping. Each specimen showed a rapid decrease in strength after achieving ultimate tensile strength corresponding to necking behavior.
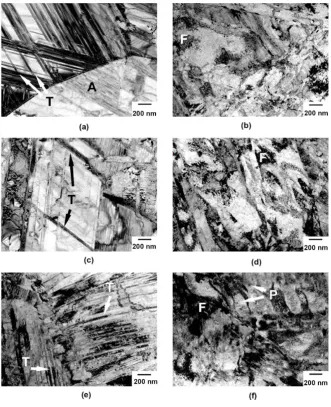
Detailed TEM analysis was done on the samples cut from different locations of the stamped part to demonstrate the structural response to the deformation during stamping. Figure 8 shows the bright-field TEM images of the micro-structure in the selected samples cut from the stamped B-pillar before and after tensile testing.
DOI: 10.4236/ojmetal.2018.82002 26 Open Journal of Metal
Figure 7. Tensile testing of specimens cut from the stamped B-pillar; (a) a view of the B-pillar with marked specimen positions,
(b) a view of the B-pillar after specimen cutting, (c) stress-strain curve examples for specimens cut from the B-pillar with various level of magnetic phases volume percent (Fe%), and (d) corresponding true stress-true strain curve examples for specimens cut from the B-pillar with various level of magnetic phases volume percent (Fe%).
Table 1. Tensile properties of selected specimens.
Fe% 0.2% Yield Strength
(MPa)
0.5% Yield Strength
(MPa)
Ultimate Tensile Strength (MPa)
Tensile Elongation
(%)
Unstamped (<1%) 463 496 1188 56.6
1.3 591 664 1215 59.0
4.4 588 743 1253 51.2
4.6 503 652 1212 54.2
9.0 621 774 1231 46.7
13.9 716 896 1326 39.1
20.2 787 1007 1320 37.0
24.5 954 1229 1410 27.0
studying multiple locations of the stamped part, a clear correlation is found with increases of Fe% in the samples and the amount of activated NR&S occurring during stamping.
[image:12.595.56.540.423.593.2]D. Branagan et al.
[image:13.595.209.541.70.478.2]DOI: 10.4236/ojmetal.2018.82002 27 Open Journal of Metal
Figure 8. Bright-field TEM micrographs of the microstructure in specimens cut from the
stamped B-pillar; (a) 4.6 Fe% sample before tensile deformation, (b) 4.6 Fe% sample after tensile deformation, (c) 13.9 Fe% sample before tensile deformation, (d) 13.9 Fe% sample after tensile deformation, (e) 24.5 Fe% sample before tensile deformation, (f) 24.5 Fe% sample after tensile deformation. On the micrograps, “T” represents twin, “P” represents precipitates, “A” represents austenite phase, and “F” represents ferrite phase.
measurements showing 13.9 and 24.5 Fe%, respectively. Higher dislocation den-sity can be noted within the grains with increasing Fe% values. Twins are present in all three microstructures.
DOI: 10.4236/ojmetal.2018.82002 28 Open Journal of Metal The structural analysis of the samples cut from the stamped part confirms that the NR&S mechanism observed in laboratory samples during tensile testing as described in the Background section is also occurring during stamping opera-tions. The NR&S mechanism is complex in nature [17] and specific structural changes will depend on the deformation pathway, localized strain state (i.e. un-iaxial, bun-iaxial, triaxial etc.), and strain rate. The destructive tensile testing was done to provide a holistic picture of the localized structure and property changes occurring during the stamping of the B-pillar. The measured tensile properties were correlated to structural changes during stamping depicted by Feritscope and HRc measurements of the tensile samples after cutting from the B-pillar prior to testing.
3.4. Non-Destructive/Destructive Property Correlations
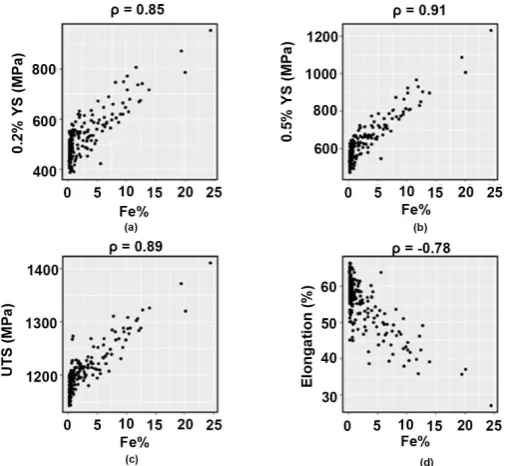
Using the dataset of tensile properties measured from the destructive testing of the B-pillar, correlations of the measured tensile data can be made with both Rockwell C hardness and Feritscope measurements. With increasing hardness and magnetic phases volume percent (Fe%), both the yield and ultimate tensile strength are found to increase commensurate with reductions in elongationw-hich is related to phase changes in the material during stamping. These phase changes depend on the level of straining leading to variable values of measured properties. The Pearson correlation coefficient (ρ) was calculated for yield strength (0.2% and 0.5% offset), ultimate tensile strength, and elongation, re-spectively, as a function of both hardness and magnetic phases volume percent (Fe%). Plots are provided in Figure 9 for hardness and Figure 10 for magnetic phases volume percent (Fe%). The calculated Pearson correlation between the compared measurements is noted above each subfigure.
For hardness the absolute value of the Pearson correlation coefficient (|ρ|) va-ries from 0.72 to 0.87, indicating moderate to strong linear correlations between these measurements. The absolute value of the Pearson correlation coefficient (|ρ|) for magnetic phases volume percent (Fe%) ranges from 0.78 to 0.91, indi-cating a moderate to strong linear correlation and one that is slightly stronger than for the hardness measurements. Based on the strength of these correlations, a linear model for predicting yield strength, ultimate tensile strength, and elon-gation can be created using hardness or magnetic phases volume percent.
3.5. Estimation of Properties in B-Pillar Stamping
D. Branagan et al.
[image:15.595.245.495.73.303.2]DOI: 10.4236/ojmetal.2018.82002 29 Open Journal of Metal
Figure 9. Linear correlation between hardness and (a) 0.2% offset
yield strength, (b) 0.5% offset yield strength, (c) ultimate tensile strength, and (d) tensile elongation for the NXG™ 1200 B-pillar.
Figure 10. Linear correlation between magnetic phases volume
per-cent (Fe%) and (a) 0.2% offset yield strength, (b) 0.5% offset yield strength, (c) ultimate tensile strength, and (d) tensile elongation for the NXG™ 1200 B-pillar.
[image:15.595.246.501.363.596.2]DOI: 10.4236/ojmetal.2018.82002 30 Open Journal of Metal
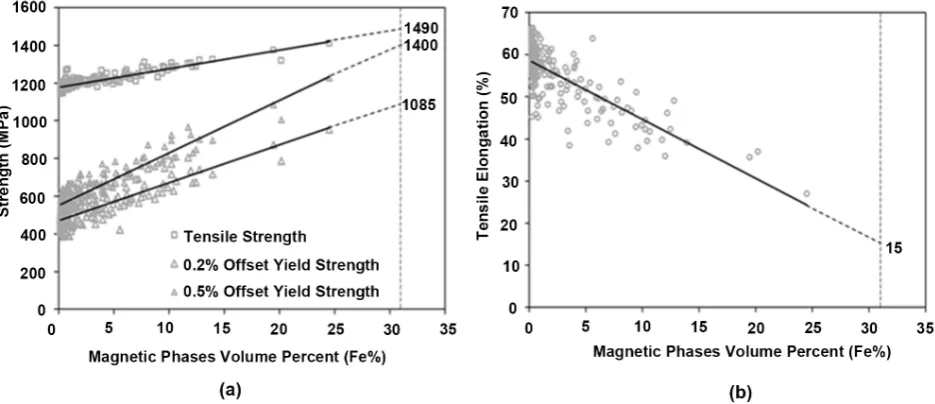
Figure 11. Extrapolation of tensile properties based on correlation with Feritscope; (a) strength properties extended to the
maxi-mum 31 Fe% found from non-destructive Feritscope measurements prior to cutting, (b) elongation extended to the maximaxi-mum 31 Fe%.
ductility in the most deformed areas of the B-pillar after stamping is similar to other grades of AHSS in their respective undeformed, pre-stamped conditions. In addition to showing the level of strengthening achieved in the stamping, these results indicate that the material has a potential for applications requiring stamping of even more complex geometries and the resulting stamped parts re-tain capability for high energy absorption.
As shown above, a detailed analysis of property changes in the NanoSteel alloy sheet after stamping was performed on the B-pillar. The correlations of the ten-sile properties with the Feritscope measurements were found to be good with coefficient of determination or R2 from 60.2% to 83.7% as shown in Figure 10. This agrees well with the microstructural analysis whereby samples cut from the B-pillar with different amounts of localized strain developed structures similar to those found in tensile specimen gauges after testing. As understanding grows, the goal would be to develop predictive models of the material behavior in stamped parts through non-destructive testing. Ultimately, this will provide auto designers freedom to design complex geometries to take advantage of the unique NR&S deformation and strengthening mechanisms in metal stampings.
4. Conclusions
defor-D. Branagan et al.
DOI: 10.4236/ojmetal.2018.82002 31 Open Journal of Metal
mation applied in relation to the part geometry. The effect of the NR&S me-chanism occurring in the areas of the B-pillar during forming has been quanti-fied by using magnetic phases volume percent measurement coupled with tensile testing of the specimens cut from the stamped part.
The measured magnetic phases volume percent, yield strength, and ultimate tensile strength are shown to increase with increasing deformation level during forming especially in the areas of extensive bending and stretching with correla-tion to microstructural changes from the NR&S mechanism. Yield strengths (0.2% offset) up to 1085 MPa and tensile strengths up to 1490 MPa were esti-mated to be achieved in the stamped B-pillar while retaining a minimum of 15% estimated elongation. Initial correlation studies have demonstrated a capability to relate non-destructive evaluation methods with actual measured properties to develop a holistic picture of the structure and properties produced during stamping allowing for subsequent more detailed modeling and analysis. The de-veloped correlations allowed estimation of properties in the areas where direct measurement are not available showing, in some locations, even higher streng-thening effect from the NR&S mechanism. In the future, work will continue to understand the details of this 3rd Generation AHSS performance during indus-trial stamping operations as well as to correlate resulting properties in the stamped part with specific localized deformation conditions.
References
[1] Steel Market Development Institute (2014) Steel Is the Solution to Achieve 54.5 MPG by 2025. http://www.autosteel.org/research/growth-of-ahss.aspx
[2] Schaeffler, D.J. (2004) Introduction to Advanced High-Strength Steels—Part I, Grade Overview. Stamping Journal. https://www.thefabricator.com/
[3] Galán, J., Samek, L., Verleysen, P., Verbeken, K. and Houbaert, Y. (2012) Advanced High Strength Steels for Automotive Industry. Revista de Metalurgia, 48, 118-131. https://doi.org/10.3989/revmetalm.1158
[4] Demeri, M.Y. (2013) Advanced High-Strength Steels—Science, Technology, and Application. ASM International.
[5] Baluch, N., Udin, Z.M. and Abdullah, C.S. (2014) Advanced High Strength Steel in Auto Industry: An Overview. Engineering, Technology & Applied Science Research, 4, 686-689.
[6] Billur, E and Altan, T. (2010) Challenges in Forming Advanced High Strength Steels, Engineering Research Center for Net Shape Manufacturing (ERC/NSM), 285-334. http://www.ercnsm.org/
[7] Irie, T., Satoh, S. and Hashiguchi, K. (1981) Metallurgical Factors Affecting the Formability of Cold-Rolled High Strength Steel Sheets. Transactions ISIJ, 21, 793-801. [8] Schaeffler, D.J. (2005) Introduction to Advanced High-Strength Steels—Part II.
Processing Considerations, September 13.
https://www.thefabricator.com/article/metalsmaterials/introduction-to-advanced-hi gh-strength-steels---part-i
DOI: 10.4236/ojmetal.2018.82002 32 Open Journal of Metal https://www.thefabricator.com/article/stamping/the-importance-of-local-formabilit y-when-working-with-ahss
[10] Advanced High Strength Steel (AHSS) Applications Guidelines V6.0 (2017), World Auto Steel, April 2017.
[11] Branagan, D.J., Sergueeva, A.V., Cheng, S., et al. (2013) Strategies For Developing Bulk Materials NanoTechnology (BMN) Into Industrial Products. Material Science and Technology, 29, 1193-1199.https://doi.org/10.1179/1743284712Y.0000000161 [12] Branagan, D.J., Frerichs, A.E., Meacham, B.E., Ma, L., Yakubtsov, I.A., Cheng, S.
and Sergueeva, A.V. (2014) New Mechanisms, Enabling Structures, and Advanced Properties Resulting in a New Class of 3rd Generation AHSS Sheet. SAE Technical Paper 2014-01-0989.
[13] Branagan, D.J., Frerichs, A.E., Meacham, B.E., Cheng, S. and Sergueeva, A.V. (2016) Overcoming the Paradox of Strength and Ductility. SAE Technical Paper, 2016-01-0357.
[14] Branagan, D.J. (2016) Designing Third Generation Advanced High-Strength Steel For Demanding Automotive Applications. Advanced Materials & Processes, 22-24. [15] Branagan, D.J., Parsons, C.S., Machrowicz, T.V., Frerichs, A.E., Meacham, B.E.,
Cheng, S. and Sergueeva, A.V. (2016) Launch of A New Class of 3rd Generation Cold Formable AHSS, Great Design in Steel 2016, Laurel Manor Conference Center; Livonia, MI, 11 May 2016.
[16] ASTM E8/E8M-16a (2016) Standard Test Methods for Tension Testing of Metallic Materials. ASTM International, West Conshohocken. http://www.astm.org [17] Branagan, D.J., Frerichs, A.E., Meacham, B.E., Cheng, S. and Sergueeva, A.V. (2017)
3rd Generation AHSS: Nanophase Refinement and Strengthening during Cold De-formation. AIST International Symposium on New Developments in Advanced High-Strength Sheet Steels, Keystone, 30 May-2 June 2017, 281-291.
[18] Branagan, D.J., Frerichs, A.E., Meacham, B.E., Cheng, S. and Sergueeva, A.V. (2016) 3rd Generation AHSS: Mechanisms Enabling High Cold Formability, Invited Talk. MS&T 2016, Salt Lake City, 24-27 October 2016.
[19] Kuhlman, S.J.H., Machrowicz, T.V., Parsons, C.S., Sergueeva, A.V., Frerichs, A.E., Meacham, B.E., Cheng, S. and Branagan, D.J. (2017) 3rd Generation AHSS High Strain Rate Tensile Testing. MS&T 2017, Pittsburg, 11 October 2017.
[20] Sergueeva, A.V., Frerichs, A.E., Meacham, B.E., Cheng, S. and Branagan, D.J. (2016) 3rd Generation AHSS: Pathway to Delayed Cracking Resistance. MS&T 2016, Salt Lake City, 24-27 October 2016.
[21] Machrowicz, T., Sergueeva, A., Bossert, E., Peterson, A. and Branagan, D. (2014) Understanding the Challenges and Uses of the 3rd Generation of Advanced High Strength Steels. http://bodyandassembly.com
[22] Frerichs, A.E., Meacham, B.E., Cheng, S., Sergueeva, A.V. and Branagan, D.J. (2016) 3rd Generation AHSS: Global vs. Local Formability. MS&T 2016, Salt Lake City, 24-27 October.
[23] Branagan, D.J., Frerichs, A.E., Meacham, B.E., Cheng, S. and Sergueeva, A.V. (2017) New Mechanisms Governing Local Formability in 3rd Generation AHSS. SAE Technical Paper.https://doi.org/10.4271/2017-01-1704
D. Branagan et al.
DOI: 10.4236/ojmetal.2018.82002 33 Open Journal of Metal