Original Paper
Developing Machine Learning Algorithms for the Prediction of
Early Death in Elderly Cancer Patients: Usability Study
Gabrielle Ribeiro Sena1*, MSc; Tiago Pessoa Ferreira Lima1,2*, PhD; Maria Julia Gonçalves Mello1*, PhD; Luiz Claudio Santos Thuler3*, PhD; Jurema Telles Oliveira Lima1*, PhD
1Department of Geriatric Oncology, Instituto de Medicina Integral Prof Fernando Figueira, Recife, Brazil
2Instituto Federal de Pernambuco - IFPE, Department os Computational Science, Recife, Brazil
3Research Center, Instituto Nacional do Cancer - INCA, Rio de Janeiro, Brazil
*all authors contributed equally
Corresponding Author: Gabrielle Ribeiro Sena, MSc Department of Geriatric Oncology
Instituto de Medicina Integral Prof Fernando Figueira Rua dos Coelhos 300
Recife, 50070-902 Brazil
Phone: 55 81 21224100
Email: [email protected]
Abstract
Background: The importance of classifying cancer patients into high- or low-risk groups has led many research teams, from the biomedical and bioinformatics fields, to study the application of machine learning (ML) algorithms. The International Society of Geriatric Oncology recommends the use of the comprehensive geriatric assessment (CGA), a multidisciplinary tool to evaluate health domains, for the follow-up of elderly cancer patients. However, no applications of ML have been proposed using CGA to classify elderly cancer patients.
Objective: The aim of this study was to propose and develop predictive models, using ML and CGA, to estimate the risk of early death in elderly cancer patients.
Methods: The ability of ML algorithms to predict early mortality in a cohort involving 608 elderly cancer patients was evaluated. The CGA was conducted during admission by a multidisciplinary team and included the following questionnaires: mini-mental state examination (MMSE), geriatric depression scale-short form, international physical activity questionnaire-short form, timed up and go, Katz index of independence in activities of daily living, Charlson comorbidity index, Karnofsky performance scale (KPS), polypharmacy, and mini nutritional assessment-short form (MNA-SF). The 10-fold cross-validation algorithm was used to evaluate all possible combinations of these questionnaires to estimate the risk of early death, considered when occurring within 6 months of diagnosis, in a variety of ML classifiers, including Naive Bayes (NB), decision tree algorithm J48 (J48), and multilayer perceptron (MLP). On each fold of evaluation, tiebreaking is handled by choosing the smallest set of questionnaires.
Results: It was possible to select CGA questionnaire subsets with high predictive capacity for early death, which were either statistically similar (NB) or higher (J48 and MLP) when compared with the use of all questionnaires investigated. These results show that CGA questionnaire selection can improve accuracy rates and decrease the time spent to evaluate elderly cancer patients. Conclusions: A simplified predictive model aiming to estimate the risk of early death in elderly cancer patients is proposed herein, minimally composed by the MNA-SF and KPS. We strongly recommend that these questionnaires be incorporated into regular geriatric assessment of older patients with cancer.
(JMIR Cancer 2019;5(2):e12163) doi: 10.2196/12163
Introduction
Background
Aging is a complex and personal, cumulative, and irreversible phenomenon that goes well beyond chronological age [1]. It involves several biological events associated with a great variety of molecular and cellular damage, leading to the gradual loss of physiological and immunological reserves and a greater risk for neoplasia-related death [1,2]. Assuming that the elderly population is heterogeneous, this population must be considered not only concerning their chronological age. Thus, an objective analysis of their living conditions as well as aspects related to oncological disease and its therapy is also required [3].
The International Society of Geriatric Oncology has recommended the use of the Comprehensive Geriatric Assessment (CGA) for the evaluation and follow-up of elderly cancer patients [4]. The CGA is a multidisciplinary tool that uses validated instruments to evaluate several elderly health condition domains, such as functional, cognitive, psychological, social, clinical, and nutritional aspects, as well as comorbidities and the use of medication, among others [5,6]. It is also strongly recommended by the geriatrics and gerontology fields in general because it is, in a complex and heterogeneous context, an objective, measurable, and reproducible form of evaluation, adding possibilities to standard clinical laboratory evaluations [7,8]. However, there is no consensus about what and how many instruments should be used. Employing CGA in practice, however, has become a huge challenge, and owing to its complexity and time spent in its application, it is often underutilized by oncologists and not judged as a completely satisfactory solution in practice, which has served as a stimulus for the construction of simpler tools that have the power to predict outcomes and guide clinical decisions [5,9].
The accurate prediction of a disease outcome is one of the most interesting and challenging tasks for physicians. As a result, a growing trend was noted in the studies published during the past years that applied machine learning (ML) algorithms for modeling cancer survival. This type of algorithms can discover and identify patterns and relationships between them, from
complex databases, while they are able to effectively predict future outcomes of a cancer type [10]. On the basis of the study by Kourou et al [11], the accuracy of cancer prediction outcome has significantly improved by 15% to 20% in the previous years, with the application of ML techniques.
A study combining data from 4 cohorts involving the elderly, 1 including elderly people with neoplasms, proposed to explore the performance of various ML classifiers (Naive Bayes [NB], k-nearest neighbors, artificial neural networks, random forest, and logistic regression) regarding death prediction in 6 months [12]. Another study used ML to predict mortality of patients in 3 to 12 months and to identify patients who could benefit from palliative care [13]. However, no ML application has been proposed using CGA to classify elderly cancer patients.
Objectives
Thus, the primary aim of this study was to propose and develop predictive models, using ML and CGA, to estimate the risk of early death in elderly cancer patients. The secondary aims were to optimize the CGA through the selection of the most appropriate instruments.
Methods
Comprehensive Geriatric Assessment
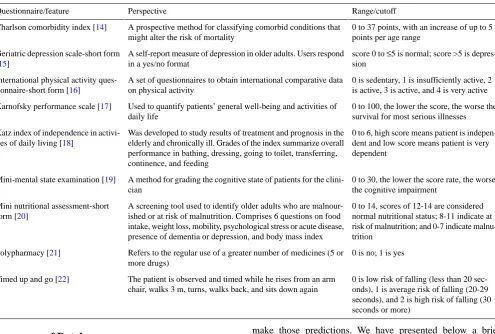
Table 1. Questionnaires/features to evaluate elderly health condition domains in Comprehensive Geriatric Assessment.
Range/cutoff Perspective
Questionnaire/feature
0 to 37 points, with an increase of up to 5 points per age range
A prospective method for classifying comorbid conditions that might alter the risk of mortality
Charlson comorbidity index [14]
score 0 to ≤5 is normal; score >5 is depres-sion
A self-report measure of depression in older adults. Users respond in a yes/no format
Geriatric depression scale-short form [15]
0 is sedentary, 1 is insufficiently active, 2 is active, 3 is active, and 4 is very active A set of questionnaires to obtain international comparative data
on physical activity International physical activity
ques-tionnaire-short form [16]
0 to 100, the lower the score, the worse the survival for most serious illnesses Used to quantify patients’ general well-being and activities of
daily life Karnofsky performance scale [17]
0 to 6, high score means patient is indepen-dent and low score means patient is very dependent
Was developed to study results of treatment and prognosis in the elderly and chronically ill. Grades of the index summarize overall performance in bathing, dressing, going to toilet, transferring, continence, and feeding
Katz index of independence in activi-ties of daily living [18]
0 to 30, the lower the score rate, the worse the cognitive impairment
A method for grading the cognitive state of patients for the clini-cian
Mini-mental state examination [19]
0 to 14, scores of 12-14 are considered normal nutritional status; 8-11 indicate at risk of malnutrition; and 0-7 indicate malnu-trition
A screening tool used to identify older adults who are malnour-ished or at risk of malnutrition. Comprises 6 questions on food intake, weight loss, mobility, psychological stress or acute disease, presence of dementia or depression, and body mass index Mini nutritional assessment-short
form [20]
0 is no; 1 is yes Refers to the regular use of a greater number of medicines (5 or
more drugs) Polypharmacy [21]
0 is low risk of falling (less than 20 sec-onds), 1 is average risk of falling (20-29 seconds), and 2 is high risk of falling (30 seconds or more)
The patient is observed and timed while he rises from an arm chair, walks 3 m, turns, walks back, and sits down again Timed up and go [22]
Preprocess of Database
The first step was to remove patients presenting redundancies and/or incomplete questionnaires/features. A total of 543 patients remained after that. Data normalization technique for equalizing the range of features, usually employed in the database before feature selection and learning phase, is of important concern in pattern recognition and computer-aided diagnosis [23]. The most common normalization method used during data transformation is the min-max (where the features are mapped into a predefined range, varying from 0 or −1 to 1). The main advantage of min-max normalization is that it preserves the relationships among the original data values [24]. In this work, all features were normalized in a (0,1) interval, calculated as in equation, where v′ is the value normalized, v is the original value, vmin is the minimum value of corresponding
feature, and vmax is the maximum value of corresponding feature:
v’=(v−vmin)/(vmax−vmin).
Predictive Models
Predictive modeling is the general concept of building a model that can make predictions. Typically, such a model includes an ML algorithm that learns certain properties from a database to
make those predictions. We have presented below a brief summary of the commonly used supervised learning algorithms: • Decision tree J48 (J48) [25]: They are tree-like graphs, where the nodes in the graph test certain conditions on a set of features and the branches split the decision toward the leaf nodes. The leaves represent the lowest level in the graph and determine the class labels.
• Multilayer perceptron (MLP) [26]: They are graph-like classifiers that mimic the structure of a human or animal brain where the interconnected nodes represent the neurons. • Naïve Bayes (NB) [27]: They are based on a statistical model (ie, Bayes theorem, calculating posterior probabilities based on the prior probability and the so-called likelihood).
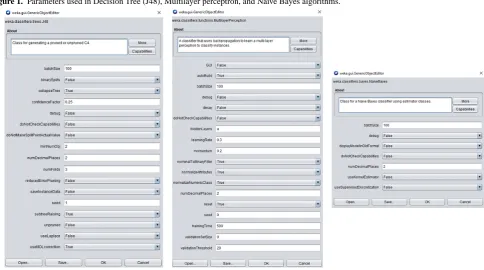
Figure 1. Parameters used in Decision Tree (J48), Multilayer perceptron, and Naive Bayes algorithms.
K-Fold Cross-Validation
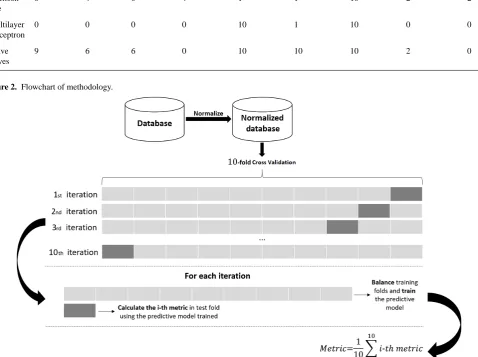
Cross-validation (CV) [28] is one of the most widely used methods to assess the generalizability of predictive models [29] and is subject to ongoing active research [30]. K-fold CV comprises dividing the database into K parts (folds) of equal sizes. For this study, a 10-fold CV is used, and each part is held out in turn and the predictive model (J48, MLP, or NB) is trained on the remaining nine-tenths; then, its error rate is calculated on the holdout set. Thus, the learning procedure is executed a total of K times on different training sets (each of which have much in common). Finally, the K error estimates are averaged to yield an overall error estimate. In this work, the folds are made by preserving the percentage of samples for each class.
Imbalanced Learn
The learning procedure and the subsequent prediction of predictive models can be affected by the problem of imbalanced database [31]. The balancing issue corresponds to the difference in the number of samples in the different classes. The resulting database presented 92 deaths within 6 months of admission to the service and 451 patients alive at the end of that period. All deaths were attributed to cancer (treatment complications or disease progression). With a greater imbalanced ratio, the decision function favors the class with the largest number of samples, usually referred as the majority class. The way to fight this issue was to generate new training sets on 10-fold CV by random sampling so that the proportion between classes remained at one-to-one.
Metrics
an alternative single-number measure for evaluating the generalization of learning algorithms [32]. This measure is far better than classification accuracies when the 2 classes are unbalanced and the cost of misclassification is unspecified [33]. An area of 1.0 represents a model that made all predictions perfectly, and an area of 0.5 represents a model as good as random. AUC can be broken down into sensitivity and specificity:
• Sensitivity is the true positive rate, and for this study, it is the percentage of patients with early death that are predicted correctly.
• Specificity is also called the true negative rate, for example, the percentage of patients without early death that are predicted correctly.
Results
Evaluating All Possible Combinations of
Comprehensive Geriatric Assessment Questionnaires
Table 2. Occurrence of the Comprehensive Geriatric Assessment questionnaires in the 10-folds using decision tree (J48), multilayer perceptron, and Naive Bayes.
Timed up and go Polypharmacy Mini
nutrition-al assessment-short form Mini-mental
state examina-tion
Karnofsky performance scale Katz index of independence in activities of daily living International
physical ac-tivity ques-tion naire-short form Geriatric
depression scale-short form Charlson co-morbidity In-dex Model
2 2
10 1
1 4
0 4
6 Decision tree
0 0
10 1
10 0
0 0
0 Multilayer perceptron
0 2
10 10
10 0
6 6
9 Naive Bayes
Figure 2. Flowchart of methodology.
Evaluating combinations of occurrences
Tables 3-5 show the sensibility, specificity, and AUC values expressed as mean (SD) on the 10-fold CV for the NB, J48, and MLP. The subsets of CGA questionnaires, presented in these tables, consider the occurrences of Table 2. The subset of questionnaires with occurrence ≥0, for example, uses all set of CGA questionnaires, as it considers all occurrences greater than or equal to 0. The other subsets use the same logic and are detailed in the footnotes under the tables. In each metric, according to the paired t test, the P value is calculated
Table 3. Metrics considering Comprehensive Geriatric Assessment questionnaire subsets on Naive Bayes classifier.
Subsets of questionnaires with occurrence Metric
10 occurrencesd
≥9 occurrencesc
≥6 occurrencesb
≥0 occurrencesa
P value Mean (SD) P value Mean (SD) P value Mean (SD) Mean (SD) .003 78.51 (5.00) .22 80.28 (6.79) .02 78.50 (6.3) 81.61 (4.62) Sensibility .01 72.56 (12.31) .03 71.45 (13.35) .002 76.89 (12.48) 65.89 (14.72) Specificity .37 82.82 (6.78) .17 83.31 (6.8) .16 83.35 (6.9) 82.43 (6.35) AUCe
a≥0 occurrences: All comprehensive geriatric assessments (Charlson comorbidity index, geriatric depression scale-short form, international physical
activity questionnaire-short form, Katz index of independence in activities of daily living, Karnofsky performance scale, mini-mental state examination, mini nutritional assessment-short form, polypharmacy, and timed up and go).
b≥6 occurrences: Charlson comorbidity index, geriatric depression scale-short form, international physical activity questionnaire-short form, Karnofsky
performance scale, mini-mental state examination, and mini nutritional assessment-short form.
c≥9 occurrences: Charlson comorbidity index, Karnofsky performance scale, mini-mental state examination, and mini nutritional assessment-short form.
d10 occurrences: Karnofsky performance scale, mini-mental state examination, and mini nutritional assessment-short form.
eAUC: area under curve.
Table 4. Metrics considering comprehensive geriatric assessment questionnaire subsets on decision tree (J48) classifier.
Subsets of questionnaires with occurrence Metric
10 occurrencesd
≥6 occurrencesc
≥4 occurrencesb
≥0 occurrencesa
P value Mean (SD) P value Mean (SD) P value Mean (SD) Mean (SD) .04 62.12 (7.25) .47 69.80 (12.13) .13 75.16 (6.38) 70.34 (16.79) Sensibility .001 84.56 (13.09) .11 75.78 (26.22) .07 71.67 (16.77) 62.89 (15.11) Specificity .02 76.97 (10.12) .006 78.08 (8.74) .003 78.79 (8.41) 67.55 (10.27) AUCe
a≥0 occurrences: all comprehensive geriatric assessments (Charlson comorbidity index, geriatric depression scale-short form, international physical
activity questionnaire-short form, Katz index of independence in activities of daily living, Karnofsky performance scale, mini-mental state examination, mini nutritional assessment-short form, polypharmacy, and timed up and go).
b≥4 occurrences: Charlson comorbidity index, geriatric depression scale-short form, Katz index of independence in activities of daily living, and mini
nutritional assessment-short form.
c≥6 occurrences: Charlson comorbidity index and mini nutritional assessment-short form.
d10 occurrences: mini nutritional assessment-short form.
eAUC: area under curve.
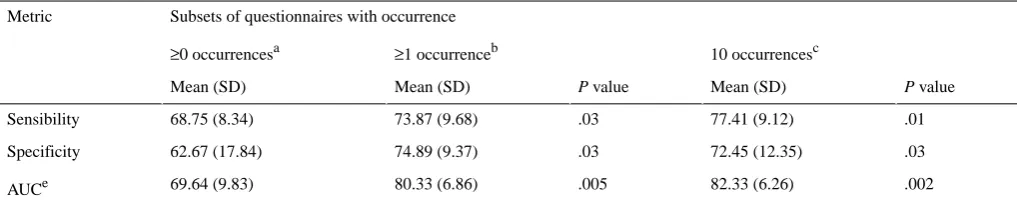
Table 5. Metrics considering comprehensive geriatric assessment questionnaires subsets on multilayer perceptron classifier.
Subsets of questionnaires with occurrence Metric
10 occurrencesc
≥1 occurrenceb
≥0 occurrencesa
P value Mean (SD) P value Mean (SD) Mean (SD) .01 77.41 (9.12) .03 73.87 (9.68) 68.75 (8.34) Sensibility .03 72.45 (12.35) .03 74.89 (9.37) 62.67 (17.84) Specificity .002 82.33 (6.26) .005 80.33 (6.86) 69.64 (9.83) AUCe
a≥0 occurrences: all comprehensive geriatric assessments (Charlson comorbidity index, geriatric depression scale-short form, international physical
activity questionnaire-short form, Katz index of independence in activities of daily living, Karnofsky performance scale, mini-mental state examination, mini nutritional assessment-short form, polypharmacy, and timed up and go).
Discussion
Principal Findings
Results indicate that the MNA-SF has greater predictive power to estimate the risk of early death in elderly cancer patients as it was selected on the 10-folds. MNA-SF is a rapid test validated for screening for nutritional risk and malnutrition in the elderly population. The predictive value of MNA-SF for early death may be related to the fact that the 6 MNA-SF questions cover areas other than just nutrition, which are frequently included in the CGA, such as mobility, neuropsychological disorders, and self-reported health, in addition to nutrition aspects, including weight loss, reduced food intake, and body mass index. In fact, low MNA-SF may reveal the effects of advanced disease in the overall health of patients, which also affects cancer-related mortality. A Brazilian study showed that abnormal nutritional status was an independent factor associated with hospital death among older patients with various chronic diseases, including cancer [34]. A similar association was also demonstrated in elderly Asian cancer patients who would receive first-line chemotherapy [35]. Finally, a French multicenter study with 348 elderly cancer patients aged 70 years and above also found that low MNA scores were associated with increased risk of premature death [36].
The results also indicated that KPS questionnaire has proven itself a valuable tool to estimate the risk of early death in elderly cancer patients. In the past decades, various studies have demonstrated the prognostic value of the KPS not only primarily for various cancers [37-40] but also for other disease entities [41]. It can also be considered as a significant indicator of hospitalization and survival time, in addition to identifying risk
groups to assist in the orientation of patients to geriatric outpatients [42].
Limitations
The efforts of this paper are a starting point. They provide solid evidences and some clinical recommendations. We proposed and developed simple ML models for the prediction of early death in elderly cancer patients. These models are accurate and precise and could be possibly used by clinicians to make proper treatment plans. However, additional research is needed to continue to strengthen the evidence base.
Conclusions
The results showed that the MNA-SF and KPS have the highest predictive power to identify elderly patients at risk for early death. We strongly recommend that these questionnaires be incorporated into regular geriatric assessment of older patients with cancer.
The MNA-SF and the KPS requires only a few minutes to be completed. In addition, both can be easily managed by any member of the multidisciplinary team to help in the early identification of patients at risk, providing information that assists in the planning of interventions and improving the adherence to CGA in daily clinical oncology practice.
This study also has limitations that should be considered. This is a nonrandomized, single-center, exploratory study of a heterogeneous patient population similar to a real-life population of older patients with cancer. Conversely, some of its weaknesses could be considered the main strengths of the study: this is one of the few studies in Brazil that, in the clinical practice context of a Unified Health System oncology unit, investigated the use of ML algorithms in the prediction of early death in elderly cancer patients.
Conflicts of Interest
None declared.
References
1. Falandry C, Bonnefoy M, Freyer G, Gilson E. Biology of cancer and aging: a complex association with cellular senescence. J Clin Oncol 2014 Aug 20;32(24):2604-2610. [doi: 10.1200/JCO.2014.55.1432] [Medline: 25071126]
2. Hurria A, Togawa K, Mohile SG, Owusu C, Klepin HD, Gross CP, et al. Predicting chemotherapy toxicity in older adults with cancer: a prospective multicenter study. J Clin Oncol 2011 Sep 1;29(25):3457-3465 [FREE Full text] [doi:
10.1200/JCO.2011.34.7625] [Medline: 21810685]
3. Wildiers H, Heeren P, Puts M, Topinkova E, Janssen-Heijnen ML, Extermann M, et al. International Society of Geriatric Oncology consensus on geriatric assessment in older patients with cancer. J Clin Oncol 2014 Aug 20;32(24):2595-2603 [FREE Full text] [doi: 10.1200/JCO.2013.54.8347] [Medline: 25071125]
4. Extermann M, Aapro M, Bernabei R, Cohen HJ, Droz JP, Lichtman S, Task Force on CGA of the International Society of Geriatric Oncology. Use of comprehensive geriatric assessment in older cancer patients: recommendations from the task force on CGA of the International Society of Geriatric Oncology (SIOG). Crit Rev Oncol Hematol 2005 Sep;55(3):241-252. [doi: 10.1016/j.critrevonc.2005.06.003] [Medline: 16084735]
5. Decoster L, van Puyvelde K, Mohile S, Wedding U, Basso U, Colloca G, et al. Screening tools for multidimensional health problems warranting a geriatric assessment in older cancer patients: an update on SIOG recommendations. Ann Oncol 2015 Feb;26(2):288-300. [doi: 10.1093/annonc/mdu210] [Medline: 24936581]
7. Ellis G, Whitehead MA, Robinson D, O'Neill D, Langhorne P. Comprehensive geriatric assessment for older adults admitted to hospital: meta-analysis of randomised controlled trials. Br Med J 2011 Oct 27;343:d6553 [FREE Full text] [doi: 10.1136/bmj.d6553] [Medline: 22034146]
8. Viganò A, Morais JA. The elderly patient with cancer: a holistic view. Nutrition 2015 Apr;31(4):587-589. [doi: 10.1016/j.nut.2015.01.001] [Medline: 25770322]
9. Luciani A, Biganzoli L, Colloca G, Falci C, Castagneto B, Floriani I, et al. Estimating the risk of chemotherapy toxicity in older patients with cancer: the role of the vulnerable elders survey-13 (VES-13). J Geriatr Oncol 2015 Jul;6(4):272-279. [doi: 10.1016/j.jgo.2015.02.005] [Medline: 26088748]
10. Kourou K, Exarchos TP, Exarchos KP, Karamouzis MV, Fotiadis DI. Machine learning applications in cancer prognosis and prediction. Comput Struct Biotechnol J 2015;13:8-17 [FREE Full text] [doi: 10.1016/j.csbj.2014.11.005] [Medline: 25750696]
11. Kourou K, Exarchos TP, Exarchos KP, Karamouzis MV, Fotiadis DI. Machine learning applications in cancer prognosis and prediction. Comput Struct Biotechnol J 2015;13:8-17 [FREE Full text] [doi: 10.1016/j.csbj.2014.11.005] [Medline: 25750696]
12. Makar M, Ghassemi M, Cutler DM, Obermeyer Z. Short-term mortality prediction for elderly patients using medicare claims data. Int J Mach Learn Comput 2015 Jun;5(3):192-197 [FREE Full text] [doi: 10.7763/IJMLC.2015.V5.506] [Medline: 28018571]
13. Avati A, Jung K, Harman S, Downing L, Andrew N, Ng A, et al. Improving Palliative Care With Deep Learning. In: Proceedings of the International Conference on Bioinformatics and Biomedicine. 2017 Presented at: BIBM'17; November 13-16, 2017; Kansas City, MO, USA. [doi: 10.1109/BIBM.2017.8217669]
14. Charlson ME, Pompei P, Ales KL, MacKenzie C. A new method of classifying prognostic comorbidity in longitudinal studies: development and validation. J Chronic Dis 1987;40(5):373-383. [doi: 10.1016/0021-9681(87)90171-8] [Medline: 3558716]
15. Yesavage JA, Brink T, Rose TL, Lum O, Huang V, Adey M, et al. Development and validation of a geriatric depression screening scale: a preliminary report. J Psychiatr Res 1982;17(1):37-49. [doi: 10.1016/0022-3956(82)90033-4] [Medline: 7183759]
16. Craig CL, Marshall AL, Sjöström M, Bauman AE, Booth ML, Ainsworth BE, et al. International physical activity questionnaire: 12-country reliability and validity. Med Sci Sports Exerc 2003 Aug;35(8):1381-1395. [doi: 10.1249/01.MSS.0000078924.61453.FB] [Medline: 12900694]
17. Karnofsky DA. CiNii Articles. 1949. The Clinical Evaluation of Chemotherapeutic Agents in CancerURL:https://ci.nii.ac.jp/ naid/10005058071/en/ [accessed 2019-08-27]
18. Katz S, Ford AB, Moskowitz RW, Jackson BA, Jaffe MW. Studies of illness in the aged. The index of ADL: a standardized measure of biological and psychosocial function. J Am Med Assoc 1963 Sep 21;185:914-919. [doi:
10.1001/jama.1963.03060120024016] [Medline: 14044222]
19. Folstein MF, Folstein SE, McHugh PR. 'Mini-mental state'. A practical method for grading the cognitive state of patients for the clinician. J Psychiatr Res 1975 Nov;12(3):189-198. [doi: 10.1016/0022-3956(75)90026-6] [Medline: 1202204] 20. Rubenstein LZ, Harker JO, Salvà A, Guigoz Y, Vellas B. Screening for undernutrition in geriatric practice: developing the
short-form mini-nutritional assessment (MNA-SF). J Gerontol A Biol Sci Med Sci 2001 Jun;56(6):M366-M372. [doi: 10.1093/gerona/56.6.m366] [Medline: 11382797]
21. Gnjidic D, Hilmer SN, Blyth FM, Naganathan V, Waite L, Seibel MJ, et al. Polypharmacy cutoff and outcomes: five or more medicines were used to identify community-dwelling older men at risk of different adverse outcomes. J Clin Epidemiol 2012 Sep;65(9):989-995. [doi: 10.1016/j.jclinepi.2012.02.018] [Medline: 22742913]
22. Podsiadlo D, Richardson S. The timed 'Up & Go': a test of basic functional mobility for frail elderly persons. J Am Geriatr Soc 1991 Feb;39(2):142-148. [doi: 10.1111/j.1532-5415.1991.tb01616.x] [Medline: 1991946]
23. KumarSingh B, Verma K, Thoke AS. Investigations on impact of feature normalization techniques on classifier's performance in breast tumor classification. Int J Comput Appl 2015 Apr 22;116(19):11-15. [doi: 10.5120/20443-2793]
24. Manikandan G, Sairam N, Sharmili S, Venkatakrishnan S. Achieving privacy in data mining using normalization. Indian J Sci Technol 2013;6(4):4268-4272 [FREE Full text]
25. Salzberg SL. C4.5: programs for machine learning by J Ross Quinlan Morgan Kaufmann Publishers, Inc, 1993. Mach Learn 1994 Sep;16(3):235-240 [FREE Full text] [doi: 10.1007/BF00993309]
26. Haykin S. Neural Networks: A Comprehensive Foundation. Second Edition. Upper Saddle River, NJ, USA: Prentice Hall PTR; 1998.
30. Bergmeir C, Hyndman RJ, Koo B. A note on the validity of cross-validation for evaluating autoregressive time series prediction. Comput Stat Data An 2018 Apr;120:70-83. [doi: 10.1016/j.csda.2017.11.003]
31. Lemaître G, Nogueira F, Aridas CK. Imbalanced-learn: a python toolbox to tackle the curse of imbalanced datasets in machine learning. J Mach Learn Res 2017;18(1):559-563 [FREE Full text]
32. Huang J, Ling CX. Using AUC and accuracy in evaluating learning algorithms. IEEE Trans Knowl Data Eng 2005 Mar;17(3):299-310. [doi: 10.1109/TKDE.2005.50]
33. Scott MJ, Niranjan M, Melvin DG, Prager RW. CiteSeerX. 1998. Maximum Realisable Performance: A Principled Method for Enhancing Performance By Using Multiple Classifiers in Variable Cost Problem DomainsURL:http://citeseerx.ist.psu.edu/ viewdoc/summary?doi=10.1.1.28.6957 [accessed 2019-08-27]
34. Ferreira LS, Nascimento LF, Marucci MF. Use of the mini nutritional assessment tool in elderly people from long-term institutions of southeast of Brazil. J Nutr Health Aging 2008 Mar;12(3):213-217. [doi: 10.1007/BF02982623] [Medline: 18309445]
35. Kanesvaran R, Li H, Koo K, Poon D. Analysis of prognostic factors of comprehensive geriatric assessment and development of a clinical scoring system in elderly Asian patients with cancer. J Clin Oncol 2011 Sep 20;29(27):3620-3627. [doi: 10.1200/JCO.2010.32.0796] [Medline: 21859998]
36. Soubeyran P, Fonck M, Blanc-Bisson C, Blanc J, Ceccaldi J, Mertens C, et al. Predictors of early death risk in older patients treated with first-line chemotherapy for cancer. J Clin Oncol 2012 May 20;30(15):1829-1834. [doi:
10.1200/JCO.2011.35.7442] [Medline: 22508806]
37. Buccheri G, Ferrigno D, Tamburini M. Karnofsky and ECOG performance status scoring in lung cancer: a prospective, longitudinal study of 536 patients from a single institution. Eur J Cancer 1996 Jun;32A(7):1135-1141. [doi:
10.1016/0959-8049(95)00664-8] [Medline: 8758243]
38. Maréchal R, Demols A, Gay F, de Maertelaere V, Arvanitaki M, Hendlisz A, et al. Prognostic factors and prognostic index for chemonaïve and gemcitabine-refractory patients with advanced pancreatic cancer. Oncology 2007;73(1-2):41-51. [doi: 10.1159/000120627] [Medline: 18334830]
39. Carson KA, Grossman SA, Fisher JD, Shaw EG. Prognostic factors for survival in adult patients with recurrent glioma enrolled onto the new approaches to brain tumor therapy CNS consortium phase I and II clinical trials. J Clin Oncol 2007 Jun 20;25(18):2601-2606 [FREE Full text] [doi: 10.1200/JCO.2006.08.1661] [Medline: 17577040]
40. Sperduto PW, Kased N, Roberge D, Xu Z, Shanley R, Luo X, et al. Summary report on the graded prognostic assessment: an accurate and facile diagnosis-specific tool to estimate survival for patients with brain metastases. J Clin Oncol 2012 Feb 1;30(4):419-425 [FREE Full text] [doi: 10.1200/JCO.2011.38.0527] [Medline: 22203767]
41. Sorror M, Storer B, Sandmaier BM, Maloney DG, Chauncey TR, Langston A, et al. Hematopoietic cell
transplantation-comorbidity index and Karnofsky performance status are independent predictors of morbidity and mortality after allogeneic nonmyeloablative hematopoietic cell transplantation. Cancer 2008 May 1;112(9):1992-2001 [FREE Full text] [doi: 10.1002/cncr.23375] [Medline: 18311781]
42. Crooks V, Waller S, Smith T, Hahn TJ. The use of the Karnofsky performance scale in determining outcomes and risk in geriatric outpatients. J Gerontol 1991 Jul;46(4):M139-M144. [doi: 10.1093/geronj/46.4.m139] [Medline: 2071835]
Abbreviations
AUC: area under curve
CGA: Comprehensive Geriatric Assessment CV: cross-validation
J48: Decision Tree
KPS: Karnofsky performance scale ML: machine learning
MLP: multilayer perceptron
MNA-SF: Mini Nutritional Assessment-Short Form NB: Naive Bayes
Edited by H Wu; submitted 10.09.18; peer-reviewed by W Tian, J Li, C Gao, H Liu; comments to author 02.11.18; revised version received 14.02.19; accepted 31.07.19; published 16.09.19
Please cite as:
Sena GR, Lima TPF, Mello MJG, Thuler LCS, Lima JTO