in the population sciences published by the Max Planck Institute for Demographic Research Konrad-Zuse Str. 1, D-18057 Rostock · GERMANY www.demographic-research.org
DEMOGRAPHIC RESEARCH
VOLUME 21, ARTICLE 4 PAGES 75-108
PUBLISHED 31 JULY 2009
http://www.demographic-research.org/Volumes/Vol21/4/ DOI: 10.4054/DemRes.2009.21.4
Research Article
Neither single, nor in a couple:
A study of living apart together in France
Arnaud Régnier-Loilier
Éva Beaujouan
Catherine Villeneuve-Gokalp
© 2009 Régnier-Loilier, Beaujouan & Villeneuve-Gokalp.
This open-access work is published under the terms of the Creative Commons Attribution NonCommercial License 2.0 Germany, which permits use, reproduction & distribution in any medium for non-commercial purposes, provided the original author(s) and source are given credit.
1 Introduction 76
2 Data and method 78
2.1 Data 78
2.2 Method 79
3 Neither single, nor in a couple: Trends in LAT and features of LAT individuals
83
3.1 Stability or increase in the proportion of LAT individuals? 83
3.2 Partners' characteristics 85
3.2.1 Descriptive analysis 85
3.2.2 Multilevel analysis 88
3.3 Reasons for living apart 90
4 A typology of LAT relationships 93
4.1 Four profiles of “noncohabitants” 93
4.2 Distance between homes, frequency of meetings, and union duration
97
4.3 Living apart: Voluntary or involuntary, temporary or lasting 99
4.4 Obstacles to cohabitation 102
5 Discussion 105
6 Acknowledgments 106
Neither single, nor in a couple:
A study of living apart together in France
Arnaud Régnier-Loilier1 Éva Beaujouan2 Catherine Villeneuve-Gokalp3
Abstract
Among living arrangements, living apart together relationships arouse curiosity on the part of sociologists, demographers and even the media. From a scientific point of view, how have noncohabiting relationships evolved in recent decades? How can we recognise these relationships, and who are the populations concerned? The present study provides an overall view into noncohabiting relationships in France, shedding light on the characteristics of both the individuals concerned and their relationships. There has been no recent increase in the prevalence of this living arrangement. It competes with cohabiting relationships both among students and among people with cohabiting children. Four main groups of living apart relationships are described: “Young adults,” “Out of a family”, “Single parents”, and “Seniors.” The reasons for living apart as well as future intentions vary considerably across these groups.
1 Institut National d’Études Démographiques (INED), Paris, France. 2
Institut National d’Études Démographiques (INED), Paris, France.
1. Introduction
In Europe, new forms of cohabitation have emerged over the past forty years (Sobotka and Toulemon 2008). In France the most widespread change came after 1972, with the increase in the number of couples living together outside marriage, first as a premarital “trial period,” and then as a stable form of union (Toulemon 1997). In the early 1990s, nine out of ten couples began their union without marrying and ten years later half of all first births were out of wedlock. In 1999, a civil union was created, the “Pacte civil de solidarité” (civil solidarity pact, known as Pacs) in order to establish an institutional framework for cohabiting couples who do not wish to marry, or for homosexual ones who cannot (Rault 2009). The success of Pacs continues to grow and in 2008 nearly 140,000 such unions were celebrated (Pla 2009). In the past twenty years, French sociologists and demographers have been observing trends in another type of union: noncohabiting partnerships. This may include individuals who have not entered into any contractual obligation as well as married couples.
Studies on living apart together (LAT) carried out in other Western countries have had the same objectives: to evaluate the number of these relationships, their development and the reasons behind them. They are based on surveys that ask respondents if they have a noncohabiting partner but without asking them if they considered themselves to be in a “couple.” Consequently these studies face a problem of definition. Most of the surveys contain a series of questions that combine objective and subjective criteria: the existence of a shared residence, the duration of the relationship, whether the separation was by choice or necessity, etc. The main drawback to this method is that it requires far too many questions. Levin and Trost (1999) defined an LAT relationship as one in which “a couple does not share a household, each of the two individuals lives in his or her own household in which other persons also might live; they define themselves as a couple and they perceive that their close surroundings also do so”. Haskey (2005) suggested describing an LAT relationship in a few sentences (according to criteria that have yet to be defined) and then asking respondents to situate their own circumstances on a cohabitation scale.
Employment Survey” (ESFE 1994), carried out by INED and INSEE on 20-49 year olds, focused once again on these noncohabiting, or semi noncohabiting relationships (each partner having his/her own dwelling while, in some cases, sharing the other partner's dwelling for a part of the time). It was found that such relationships had not become more frequent since 1986. Couples frequently had separate homes at the start of a union but rarely for long because separation was often perceived as a necessity rather than a choice, as much by respondents who considered themselves to be “in a couple” as persons in an intimate relationship who described themselves as “alone” (Villeneuve-Gokalp 1997).
Prolonged further education, the spread of individualistic values (de Singly 2000; Kaufmann 1999), a greater number of relationship dissolutions, as well as the abundance of media reports about couples in LAT relationships, may have contributed to the rise of a more independent form of relationship. Yet childlessness has tended to decrease through the generations and women generally do not want a child outside of a well established couple relationship (Régnier-Loilier 2007). This is why we have undertaken to provide an update on the situation a decade after the FFS.
The "Étude des Relations Familiales et Intergénérationnelles" survey (ERFI), the French version of the 2005 "Generations and Gender Survey" (GGS) (Vikat et al. 2007), also included questions on LAT relationships (see Section 2). No questions were asked, however, about whether the partners saw themselves as a “couple”4. The comparison of all LAT relationships in the ESFE and GGS-ERFI surveys is made possible by merging the noncohabiting couples with the stable intimate relationships in ESFE. This will enable us first to confirm or refute the hypothesis that LAT relationships are developing.
We will then seek to understand why two individuals who consider themselves in a stable love relationship do not live together. Is this a temporary or a long-lasting decision? A recent study suggests that, in Spain, LAT relationships among women aged 20-34 are a preliminary stage of the courtship process, potentially leading to cohabitation (Castro-Martín et al. 2008). To what extent do persons in an LAT relationship intend to cohabit with their partner at a later date? Using the GGS-ERFI survey data, we will identify the characteristics of persons involved in this type of relationship in France in order to observe the diversity of their situations. Then, rather than trying to define LAT (a difficult task given its multiple connotations) we will suggest a typology of the persons concerned before studying the way such relationships
4 This will change in the second part of the GGS survey scheduled for autumn 2008 on the same respondents
function (frequency of meeting, travel time between partners' homes), their duration, as well as the motives and cohabitation intentions of the various subpopulations obtained.
2. Data and method
2.1 Data
The "Generations and Gender Survey," known in French as “Étude des relations familiales et intergénérationnelles” (GGS-ERFI) has been conducted in around twenty industrialized countries. It was carried out in France by INED and INSEE in the autumn of 2005 on a sample of 10,079 men and women aged 18-79. Respondents were asked about their work, their health, their family, their children, and their parents (for more details see Sebille and Régnier-Loilier 2007). The same sample will be re-interviewed in 2008.
The GGS-ERFI survey focuses on “noncohabiting relationships.” First, the household composition table (HCT) indicates whether the respondent lived alone or with a partner. When partners were absent for fewer than three days a week or were absent for work or study-related reasons, they would be considered as living in the household. Conversely, spouses living in separate residences for more than half of the week without being obliged to for occupational reasons were not placed in the HCT and respondents were deemed to be living alone. In this case respondents could state whether or not they were in a “stable intimate relationship.” In the present article, we focus on the answers to these specific questions: "Are you currently having a stable, intimate relationship with someone you're not living with?," "Are you living apart because you and/or your partner want to, or because circumstances prevent you from living together?," "Why do you / does your partner want to live apart?" or "Under which circumstances?," and "Do you intend to start living with your partner during the next three years?"
Additional details were provided in GGS-ERFI. For example, respondents were asked to state whether their residential separation was voluntary or involuntary and to provide the reasons in both cases. When separation was voluntary they were asked to state if it was their own choice or their partner’s, or a joint decision taken by both (see Box 1). Other questions were asked on distance between homes, frequency of meetings and union duration.
union, even if their partner was not permanently coresident. We grouped together the persons who reported living as a couple but whose partner was not listed in the HCT, with individuals living alone but who had a “stable, intimate relationship.” In both studies, individuals in a relationship for less than three months were grouped with those who were “alone but in a stable intimate relationship.” This decision was taken in accordance with the definition of “cohabitation” for couples, i.e. living together for a minimum of three months. Even ignoring relationships less than three months old, some were still too short to be considered “stable” but the partners were doubtless anticipating that they would last.
2.2 Method
We first make a brief comparison of individuals living apart in ESFE and GGS-ERFI between 1994 and 2005. Given that the coverage of these two surveys is not identical (ages 21-49 for ESFE and 18-79 for GGS-ERFI), the prevalence of LAT can only be compared for the populations covered by both surveys, i.e. ages 21-49.
In a second stage, we use simple descriptive results to ascertain the main characteristics of the individuals aged 18-79 in a stable LAT relationship (gender, age, work situation, as well as marital and reproductive history) and endeavour to find out why they live apart. We use logistic regression to disentangle the factors of age, conjugal history, and family history in LAT relationships. We estimate the probability of partnered individuals living or not living with their partners according to their social and demographic characteristics, and by sex. In interpreting this model it is necessary to bear in mind that a cross-sectional approach to these relationships leads to under-representation of the shortest lasting ones, namely the noncohabiting relationships. These end faster than cohabiting unions (44% of ongoing noncohabiting unions were under two years old) either because they are dissolved more quickly or because they are transformed into cohabiting unions (Villeneuve-Gokalp 1997)5. We are unable to introduce simultaneously age, occupational status, and living with parents, into this model, because of the colinearity between age and the two other variables; for instance most students are under 25 and so are most individuals still living with their parents. However, the percentage of individuals in a cohabiting couple and living with a parent
5 It was not possible to control for time since the start of relationship to limit this problem, since in the survey,
Box 1: Stable, intimate noncohabiting relationships: Between choice and circumstance
Q1. Do you live separately by choice or because circumstances preventyou fromliving together?
1. I want to live alone
2. My partner and I decided to live separately 3. My partner wants us to live separately 4. We are obliged to by circumstance 5. Other reasons
Q2. (If 1 or 2 in Q1) Why do you want to live separately?
1. For financial reasons 2. To remain independent 3. Because of the children
4. I’m not yet ready to live with someone 5. Other reasons
Q3. (If 2 or 3 in Q1) Why did your partner choose to live separately?
1. For financial reasons 2. To remain independent 3. Because of the children
4. He’s not yet ready to live with someone 5. Other reasons
6. Don’t know
Q4. (If 4 in Q1) What are the reasons?
1. Occupational 2. Financial 3. Housing
4. The partner’s state of health 5. Legal problems
is practically zero whereas it is quite considerable (37%) in the case of noncohabiting couples. To avoid this manifest heterogeneity in the sample that might have distorted the regression analysis, we prefer to exclude individuals living with their parents from the model. The variables used in the logistical regression are age, nationality (since coming to work in France may be a reason for noncohabitation for foreigners), conjugal and reproductive history, as well as an overall variable that includes employment and the sociooccupational status of the respondent and his/her partner. This variable indicates the respondent’s occupational status when s/he is employed, or unemployed status if applicable, and combines all other economically inactive categories such as students, retired people, homemakers, or employees on parental leave. For the previously mentioned reasons of colinearity governing age, no distinction is possible between students and retired people. In the results table, we present both the estimated parameters (β ) and the significance thresholds ( ) along with the estimated probabilities
P>z
6
(in %), recalculated from the β parameters as follows:
- for the reference situation :
intercept
1
*100
1 e β
−
+
- for each factor:
intercept factor
1
*100
1 e β β
− −
+
It is these estimated probabilities which are discussed in the text.
Last, using multiple correspondence analysis (MCA) and classification “by factors” we establish a number of standard profiles for these respondents in order to study the characteristics of their relationships and their future intentions. This analysis is done using SPAD software.
MCA is an effective tool for establishing comparisons between individuals having similar life experiences based on similar characteristics. Since we cannot determine the typology from variables such as reason for LAT (choice or constraint), plans to live together, or the duration of the union — precisely those aspects of the relationship we wanted to study — we use respondents’ individual characteristics (e.g. sex, age, and partners' employment status7). We also take the situation at the outset of the relationship, such as the number of previous unions, legal conjugal status, and the distance between the two partners’ homes. However, we are unable to introduce some of those characteristics as active variables in the analysis; for instance, legal conjugal status, which is both too closely correlated to the number of previous unions and
6 For each factor, all other variables were held constant in the reference situation. 7
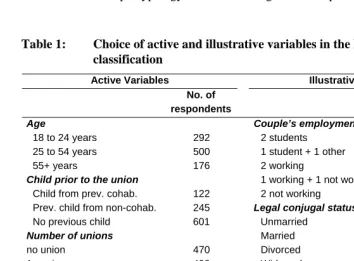
sometimes dependent on the present relationship (some noncohabiting couples were married), employment status, which is too closely related to age. The MCA is therefore based on the respondent’s sex, age, the number of previous unions, previous children, and the distance between the partners’ homes (Table 1). Only these “active” variables were included in the calculations to determine the position on the axes or the participation of modalities in the construction of categories. The other, so-called "illustrative" variables, merely round out the observation by positioning themselves in relation to the divisions already defined.
Classification “by factor”, using the factorial coordinates resulting from the MCA, allows us to draw up a typology of noncohabiting relationships, net of structural effects.
Table 1: Choice of active and illustrative variables in the MCA and classification
Active Variables Illustrative Variables No. of
respondents
No. of respondents Age Couple’s employment status
18 to 24 years 292 2 students 103
25 to 54 years 500 1 student + 1 other 133
55+ years 176 2 working 398
Child prior to the union 1 working + 1 not working 201 Child from prev. cohab. 122 2 not working 133 Prev. child from non-cohab. 245 Legal conjugal status
No previous child 601 Unmarried 680
Number of unions Married 62
no union 470 Divorced 167
1+ union 498 Widowed 59
Sex Reason for LAT
Female 575 Independence 202
Male 393 Not ready 113
Distance from partner in min. Other partner’s choice 79 under 30 min. 531 Financial/housing constraint 126
+ 30 min. 437 Work reasons 196
Other obligation 191
Not a choice, not an
3. Neither single, nor in a couple: Trends in LAT and features of
LAT individuals
3.1 Stability or increase in the proportion of LAT individuals?
The ESFE survey showed that the way the relationship is defined depends very much on the age and past history of the partners. Those who had already cohabited, as well as those who were older and had already experienced love relationships, were more likely to view themselves as part of a couple than younger individuals, and their relationships lasted longer. From respondents’ life event histories we established that two-thirds of the people aged 21-49 who reported being in an intimate relationship were in fact under 30, versus only 40% of respondents in noncohabiting unions.
It is impossible to compare noncohabiting couples on the one hand, and stable intimate relationships on the other, using the 1994 and 2005 survey data, but the global proportion of persons in an LAT relationship did not increase in any age group (Figure 1). The slight increase among young men at young ages is not significant.
Table 2: Comparison of stable, intimate relationships in 1994 and 2005 by duration of relationships, frequency of meeting, and reasons for living apart
% 1994 ESFE 2005 GGS-ERFI
Time since start of relationship
< 1 year 27 29
1 year 19 18
2 years 18 17
3 or 4 years 19 16
>4 years 17 20
Total 100 100
Frequency of meeting
Daily 27 31
Weekly 59 52
Less often 14 17
Total 100 100
Reason for LAT
A constraint 61 58
Other reason (choice, not ready, …) 39 42
Total 100 100
Figure 1: Proportions of persons in cohabiting and noncohabiting relationships in 1994 and 2005, by age
0 10 20 30 40 50 60 70 80 90
21-24 25-29 30-34 35-39 40-44 45-49
MALE
Cohabiting relationship
Non cohabiting relationship (%)
2005
1994
2005
1994
0 10 20 30 40 50 60 70 80 90
21-24 25-29 30-34 35-39 40-44 45-49
FEMALE
Cohabiting relationship
Non cohabiting relationship (%)
2005
1994
2005
1994
Moreover, the duration of the relationships was identical in the two surveys. The absence of any change in the frequency of meeting and in their perception of the reason for living apart (choice or constraint) confirms the stability of this living arrangement over the last ten years (Table 2). In the case of young adults, their desire for independence rarely withstands the demands of a pregnancy and the financial burden of two homes. With few exceptions, noncohabitation only lasts in the case of couples who meet after a separation or widowhood, and who do not want any (more) children
3.2 Partners' characteristics
3.2.1 Descriptive analysis
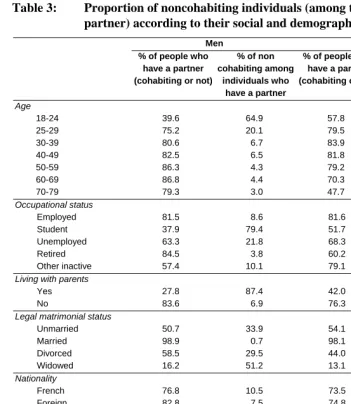
The percentage of 18-79 year-olds living in a stable noncohabiting relationship (among those who have a partner) is very similar for men (10%) and for women (11%). In France, just over 3.8 million individuals are concerned, though the proportion of LAT varies greatly by age, marital status, conjugal, and birth history.
While the average age of the first union has risen slightly from an average 23.3 years for men, and 22.2 years for women in the 1946-50 cohorts, to 25.2 years and 23 years respectively for the 1976-80 cohorts, young adults do not leave the family home any later than they did thirty years ago (Régnier-Loilier 2006). When they do leave, they are less likely to do so for the purpose of moving in with a partner (Régnier-Loilier and Vivas 2009). Thus there is an “in-between” period during which young adults have the possibility to experiment with their love-lives until they meet the first person with whom they want to share a home. Living apart together is first and foremost a young persons’ relationship, concerning 65% of men and 54% of women aged 18-24 who have a partner, and 20% and 15% respectively of those aged 25-29, compared with 11% of the total population of 18-79 year olds (Table 3). Individuals in LAT relationships are therefore younger than people living in a cohabiting couple.
For instance, 21% of young adult respondents lived in one room compared with less than 5% of total respondents, and only 80% had a washing machine compared with 96% of total respondents (results not shown here). Moreover, while one of the partners may be living independently, the other might still be living at the parental home8.
The temporary nature of the relationship is also reflected in the greater proportion of students who have an LAT partner (79% of men and 67% of women) (Table 3). It is also among students that the proportions with a partner are smallest (38% of men and 52% of women), and among those who do have a partner, they rarely live together as a couple. Precarious situations such as unemployment also appear to prevent couples from living together and there are more unemployed men (22%) and women (17%) in LAT relationships. Unemployment also reflects the difficulties young adults have in finding work after they have left the educational system. Lastly, and still age-related, there is a higher proportion of noncohabiting relationships among unmarried men and women who have a partner (34% for both sexes) (Table 3). An LAT relationship could thus be defined as a temporary form of partnership that mainly concerns young adults. But this type of relationship does not concern young adults alone and is not just synonymous with gradual entry into a first conjugal relationship. One third of respondents in an intimate relationship were aged 40 and over (29% of men and 33% of women), nearly half were employed and just under 10% were retired (results not shown here).
Individuals who have experienced a previous union form another group of noncohabiting couples. They maintain their residential independence for longer than those with no "conjugal history." Among the latter group, only 8% of men and women who have a partner are in an LAT relationship, compared with 19% who have already experienced separation but do not have children from a previous union, 19% of men and 25% of women who have already experienced separation and who have noncohabiting children from a previous union, and 26% of men and 30% of women who have already experienced separation and have cohabiting children from a previous union (Table 3). The proportion of divorcees in LAT relationships is even higher than that of persons who have experienced a previous non-marital union.
When there are no children from a previous relationship, the conjugal situations of men and women are thus the same: 7 in 10 have a partner and among them, 19% are in an LAT relationship. These proportions are similar for men who have children but do not live with them, but women who do not live with their children are more often alone (60%). This is less a sex difference than an age difference: the women concerned are older on average than the men, since most separated young mothers live with their children.
Table 3: Proportion of noncohabiting individuals (among those who have a partner) according to their social and demographic characteristics
Men Women
% of people who
have a partner (cohabiting or not)
% of non cohabiting among
individuals who have a partner
% of people who have a partner (cohabiting or not)
% of non cohabiting among
individuals who have a partner
Age
18-24 39.6 64.9 57.8 53.8
25-29 75.2 20.1 79.5 15.4
30-39 80.6 6.7 83.9 6.0
40-49 82.5 6.5 81.8 6.2
50-59 86.3 4.3 79.2 7.1
60-69 86.8 4.4 70.3 6.8
70-79 79.3 3.0 47.7 3.1
Occupational status
Employed 81.5 8.6 81.6 9.5
Student 37.9 79.4 51.7 66.9
Unemployed 63.3 21.8 68.3 16.5
Retired 84.5 3.8 60.2 5.6
Other inactive 57.4 10.1 79.1 3.7
Living with parents
Yes 27.8 87.4 42.0 92.6
No 83.6 6.9 76.3 7.5
Legal matrimonial status
Unmarried 50.7 33.9 54.1 33.9
Married 98.9 0.7 98.1 1.0
Divorced 58.5 29.5 44.0 37.3
Widowed 16.2 51.2 13.1 58.0
Nationality
French 76.8 10.5 73.5 11.4
Foreign 82.8 7.5 74.8 7.8
Conjugal and reproductive history
No previous union 81.7 7.8 84.7 8.3
Union(s), but no children
67.5 19.1 65.1 18.7
Union(s) + cohabiting children
51.9 26.0 41.9 29.8
Union(s) + non cohabiting children
62.2 19.3 40.5 24.9
All 77.2 10.2 73.6 11.4
3.2.2 Multilevel analysis
The results of the logistic regression (Table 4, second column) give the estimated probability for men and women in a couple of living independently, or “going it alone”, rather than living in the same dwelling. For respondents whose situation would exactly match the reference situation, namely: being French, aged 30-39, clerical or sale worker, with a clerical or sale worker partner, having already lived as a couple and without children, this probability is 12% for men and 13% for women.
For both sexes, the effect of youth on the propensity not to cohabit with a partner was clearly confirmed. For those under 25 year-olds, the estimated probability for men was 72% and 68% for women, all other characteristics being equal. It was still 38% for men and 33% for women in the 25-29 age group, but after the age of 40 the estimated probability of not cohabiting decreases significantly in the case of men (it falls to 6% for the 50-59 age group, then 4% for the 60-69 age group and 3% for the 70-79 age group) but not for women: the estimated probability of being in an LAT relationship remains between 10-13% for women at ages 40-69. LAT relationships therefore seem less likely for older men, partly because widowhood is less frequent for men9 and partly because in the event of a separation, men are more likely to cohabit with a new partner than women. This effect doesn’t appear for women, because their probability of living in a noncohabiting relationship remains stable at all ages after 30. Since women usually live with their children after a separation they are also less likely to cohabit than men (Cassan, Mazuy and Clanché 2005).
All other things being equal, the probability of being in an LAT rather than cohabiting relationship is higher for men and women who have already experienced a union, notably if children were born in the previous union(s), and even more so if the children live with the respondent at the time of the survey. Hence, the estimated probability of living apart is 12% for men and 13% for women who have already cohabited but never had children, and rises to 24% and 27% respectively if the previous union(s) were fertile but the children do not (or no longer) live with the respondent. This estimated probability reaches 31% and 34% for men and women living with children from a previous union (Table 4). A significant difference emerges between cohabiting or not cohabiting with children of a previous union, which was not visible for men in the descriptive analysis (Table 3).
9
Table 4: Probability for individuals of living apart versus living with the partner (logit model)
Men Women
Estimated probability Estimated probability
ß (%) P>z ß (%) P>z
Intercept -2.00 11.9 *** -1.91 12.9 ***
Nationality
French 0.00 11.9 ref 0.00 12.9 ref
foreign 0.48 17.9 * 0.19 15.2 -
Age
18-24 2.96 72.3 *** 2.68 68.4 ***
25-29 1.52 38.2 *** 1.18 32.5 ***
30-39 0.00 11.9 ref 0.00 12.9 ref
40-49 -0.17 10.2 - -0.33 9.6 -
50-59 -0.80 5.7 *** -0.14 11.4 -
60-69 -1.20 3.9 *** 0.04 13.4 -
70-79 -1.50 2.9 *** -0.78 6.4 *
Socio-occupational status of respondent
farmer, self-employed -0.12 10.7 - -0.58 7.7 - higher level occupation -0.22 9.8 - 0.32 16.9 - intermediate occupation -0.25 9.6 - 0.30 16.7 - clerical/ sales worker 0.00 11.9 ref 0.00 12.9 ref
manual worker -0.29 9.2 - 0.09 13.9 -
unemployed 0.19 14.1 - 0.30 16.6 -
inactive 0.74 22.0 ** -0.18 11.0 -
Socio-occupational status of partner
farmer, self-employed 0.33 15.8 - -0.20 10.8 - higher level occupation 0.54 18.9 - 0.00 12.8 - intermediate occupation 0.40 16.8 * 0.20 15.3 - clerical/ sales worker 0.00 11.9 ref 0.00 12.9 ref
manual worker 0.22 14.4 - -0.78 6.4 ***
unemployed, inactive 0.18 13.9 - 0.46 18.9 - Conjugal and reproductive history
no previous union -1.69 2.4 *** -1.96 2.0 *** union(s) but no children 0.00 11.9 ref 0.00 12.9 ref
union(s) and cohabiting children 1.18 30.6 *** 1.24 33.7 *** union(s) and noncohabiting children 0.86 24.2 *** 0.94 27.4 ***
Source: INED-INSEE, GGS-ERFI, 2005
Population: persons aged 18-79, with a partner (cohabiting or not) and no longer living with their parents.
Interpretation: a β coefficient which is positive (resp. negative) and statistically significant indicates a factor which increases (resp. decreases) the probability of not cohabiting with one's partner.
Employment status has relatively little influence on whether or not a couple cohabits. Only “economically inactive” men were more likely to live apart from their partners, probably because this category, which covers a variety of situations (retired people, students and inactive) includes a majority of students. There are, though, a few differences according to the partner’s socio-occupational status. In particular, women whose partners are manual workers are more likely to cohabit. Previous sociological studies have already demonstrated that forming a couple provides material security for the working classes (de Singly 1987, Schwartz 1990).
Lastly, foreign men are far more likely than French men to live apart from their spouses (18% vs. 12%). This difference is clearly the consequence of labour immigration, since it is not observed among women, for whom the probability of living apart from their spouse is independent of nationality.
3.3 Reasons for living apart
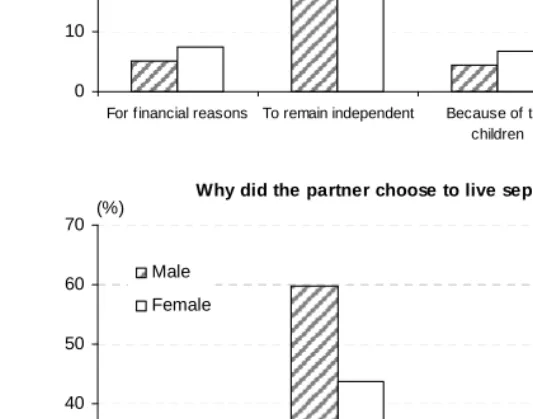
Most noncohabitants stated that they were obliged to live separately because of circumstances (Figure 2), with no major difference between men and women (64% of men and 61% of women). Occupational reasons were most frequently cited (around 4 respondents out of 10), usually due to the geographic distance of the workplace of one of the partners. Women mentioned financial or housing issues slightly more frequently than men, while men mentioned work or personal reasons more frequently. Men were twice as likely as women to say that their partner had “another family” (13% vs. 7%). Although the question was ambiguous (a respondent could have another family because they had another partner, or because they were raising their children, or because they were living with an elderly relative10), we presumed that the discrepancy between men and women was because, in the majority of cases, separated women with children had custody of those children.
While 18% of men and 23% of women perceived separation as a joint decision, 17% of men and 15% of women viewed their separation as a personal choice, not shared by their partner. Logically we would expect similar proportions for the “I want to live alone” and “my partner wants us to live separately” categories, but only 1% of men and women gave the second reply. This paradox reveals the difficulty couples have in acknowledging that their partner is the only one who wants to live separately.
10 Levin and Trost (1999) for Sweden and Milan and Peters (2003) for Canada, have stated that one of the
Figure 2: Reasons for living apart (Men, Women, %)
0 10 20 30 40 50 60 70
I w ant to live alone My partner and I decided to live
separately
My partner w ants us to live separately
We are obliged to by circumstance
Male
Female
Choice or circumstance ?
(%)
0 10 20 30 40 50 60 70
Occupational Financial Housing The partner's state of health
Legal problem Your partner has another
family
Male
Female
What are the circumstances?
Figure 2: (Continued)
0 10 20 30 40 50 60 70
For financial reasons To remain independent Because of the children
I'm not yet ready to live w ith someone
Male
Female
Why did the respondant choose to live separately?
(%)
0 10 20 30 40 50 60 70
For financial reasons To remain independent Because of the children
He's not yet ready to live w ith someone Male
Female
Why did the partner choose to live separately?
(%)
Source: INED-INSEE, GGS-ERFI, 2005
The reasons for the “choice” are largely due to a desire to remain independent or a feeling of not being ready to cohabit. There are two different rationales behind this. The desire to remain independent indicates a refusal to cohabit but translates into a more stable relationship in duration (these relationships had already lasted an average of 6.7 years) whereas the feeling of not being ready acknowledges a transitory, less long-lasting situation (the relationship had lasted an average 2.4 years). The desire to remain independent was stronger in men (60%) than women (46%) while “not being ready” was more prevalent in women (40% vs. 31%). Conversely financial reasons or the presence of children appears to have little bearing on the decision. The male/female discrepancy was quite marked when we asked respondents about their partner’s reasons: 60% of men stated that their partner wanted to remain independent and 29% said that their partners did not feel ready. Women were split between those who thought their partners wanted to remain independent (44%) and those who thought they did not feel ready (43%).
These results might reflect the different expectations of men and women, and people’s propensity to attribute their own expectations to their partner: 60% of men pursue their desire for independence and 60% believe their partners share that desire; 46% of women want to remain independent and 44% attribute the same aspiration to their partners. Among male respondents, 31% chose: “I don’t feel ready to cohabit” and 29% believed their partners felt the same. Among the women, 40% agreed with that choice for themselves and 43% attributed it to their partners. The discrepancies only emerge when delving into the reasons given by the respondents for themselves and for their partners when they stated that LAT was a shared decision (in their personal view): 44% of men reported that both partners wished to remain independent, compared with 33% of women; conversely, men were less likely than women to state that neither of them were ready to cohabit (20% vs. 30%).
4. A typology of LAT relationships
4.1 Four profiles of “noncohabitants”
Several types of LAT relationships emerge from the preceding descriptions, but it must be supposed that the operational logic and the intentions to cohabit among respondents differ. We therefore decided to classify “noncohabiting” individuals in order to study their motivations and plans while taking into account their very heterogeneous characteristics.
absence in the home of children born prior to the union. Using factor classification, each respondent was attached to the group with which s/he shared the most characteristics. The model fixed an optimum number of four groups11. The modalities which contributed most to the formation of a group are those with the highest test values. These are shown in Table 5 together with, for each modality, the proportion of individuals of this modality included in the group. For instance, 65% of persons in a stable intimate noncohabiting relationship without a previous union were found in the “Young adults” group (see below for the group names).
Given the limited number of active variables and modalities, there was a high risk that certain modalities would be preponderant when forming the groups. Nevertheless, the resulting classification, however perfunctory, served our purpose, which was to find the distribution net of structural effects that was best suited to the study. Although variables such as sex, the fact of having lived as a couple or not, and travel time between the two residences contributed to the factor calculations, they were dominated in the classification process by the variables of age and presence of children.
• The first group was composed solely of “Young adults” under 25 years old, without children, single (99%), who had never lived as a couple (except 9%). Women were slightly more predominant than men in this group because they begin their conjugal life slightly earlier. Due to their youth, in three cases out of four at least one of the partners was a student (Table 5).
• A second group, named “Out of a family,” included people who were no longer dependent on their parents and who did not (yet) have any children (74%) or did not live with them (26%). Apart from a few exceptions, practically all were between 25 and 54 years old. This is the only group where men outnumbered women (57%). More than three-quarters of the “Out of a family” group were single, 14% were divorced, 2% were still married to a separated spouse and 6% were married to their current partner. Of this latter subgroup, two-thirds were foreigners living away from their family.
• The third group, mostly female (77%), consisted of “Single parents” families. Like the second group, almost all were between 25 and 54 years old, except 3% who were younger. There were many divorcees in this group (41%) and only 4% were married, three out of four to their present partner. Most of them had an out of family partner.
• The fourth group included all respondents aged 55 and over. This is an age when individuals are freed from the daily tasks related to raising children or may no longer be working. If they have children (and 70% do), they are adults and no longer live at home, or they may live with their other parent. Lastly, in 9 cases out of 10, both partners are no longer working. Respondents in this group were older so we called them “Seniors.” Although this is a coherent group in terms of employment, minimum age, and absence of children at home, it nevertheless covers a wide range of conjugal histories: 20% of Seniors never cohabited with a partner whereas 22% lived in several cohabiting relationships, 26% were widowed (which rarely occurs in the younger groups), 3% had not divorced from their previous spouses and 12% were married to their present spouses.
Table 5: Typologies based on classification by factors.
Test values and percentage of modality in each group
Young adults Out of a family
Characteristic modalities Test value
% of the group
in the modality Characteristic modalities Test value
% of the group in the modality
Aged 18 to 24 32.7 99.1 Aged 25 to 54 26.0 79.7
No previous child 17.6 58.3 1 union or + 4.6 44.2
No union 17.2 65.3 Male 4.2 42.4
Distance under 30 min. 2.7 45.9 Previous child, non-cohab. 3.9 48.6
Single parents Seniors
Characteristic modalities Test value
% of the group
in the modality Characteristic modalities Test value
% of the group in the modality
Child in previous cohab. 22.3 100.0 + 55 years 22.3 98.5
Aged 25 to 54 10.0 20.3 Previous child, non-cohab. 9.1 51.4
1 union or + 9.1 20.3 1 union or + 4.5 26.8
Female 4.4 13.7
Source: INED-INSEE, GGS-ERFI, 2005
of Young adults, though the older respondents had already passed the major milestones in their personal and professional lives, while the others were still at the beginning or midway through theirs.
Table 6: Main characteristics of individuals in noncohabiting relationships (%)
Young adults
Out of a family
Single
parents Seniors All
Nonweighted numbers 287 385 122 174 968
Distribution (after weighting) 42.1 34.8 9.3 13.8 100.0
Respondent’s characteristics
Sex
Male 45.4 57.5 22.9 43.6 47.3
Female 54.6 42.5 77.1 56.4 52.7
Age
18-24 years 100.0 0.3 3.1 0.0 42.2
25-34 years 0.0 54.4 19.5 0.0 20.8
35-44 years 0.0 23.5 43.1 0.0 12.3
45-54 years 0.0 21.8 32.0 0.0 11.6
55 -79 0.0 0.0 2.3 100.0 14.1
Children
Without 100.0 73.6 0.0 30.0 71.7
Noncohabiting children 0.0 26.4 0.0 70.0 18.9
Cohabiting children 0.0 0.0 100.0 0.0 9.4
Conjugal experience
No previous union 91.4 47.4 10.0 20.1 58.5
One 7.8 42.3 74.0 58.2 33.1
Several 0.8 10.3 16.0 21.7 8.4
Legal matrimonial situation
Unmarried 98.7 77.0 52.7 27.3 76.9
Married 1.3 7.9 4.1 14.9 5.8
Divorced 0.0 13.8 41.0 31.5 13.1
Widowed 0.0 1.3 2.2 26.3 4.2
Partner’s characteristics
Partner’s occupation
One or both students 75.3 10.2 2.5 0.0 35.3
Both working 15.9 60.7 59.4 11.6 35.0
One or both is unemployed, inactive, or retired
8.8 29.1 38.1 88.4 29.7
Among individuals in an LAT relationship, 42% were Young adults, 35% were Out of a family, 14% Seniors and 9% Single parents (Table 6). LAT relationships were indeed most frequent among young people: 28% of the 18-25 age group. However, in the 25-54 age group, respondents living with a child from a previous union more often adopted this type of relationship (14%) than those who had no children or did not live with them (6%). Only 4% of the 55-79 age group lived in a noncohabiting relationship.
4.2 Distance between homes, frequency of meetings, and union duration
Half the couples covered the distance between their two homes in under 25 minutes. In 4 cases out of 10, travel time was under 15 minutes but in one out of three it took over one hour, which implies the use of a motor vehicle, or even a plane in the case of the furthest distances. We used the journey time separating LAT couples’ homes to define the four groups but this did not contribute greatly since geographic distance did not distinguish LAT couples when all the other characteristics were taken into account (Table 7). The young adults and the single parents generally lived 10 minutes closer to their partners (difference between medians) than the Out of a family and the Seniors. The Young adults, mostly students, often lived less than 15 minutes apart (47%). Conversely, 23% of the Out of a family category had more than two hours of travel time, with the greatest distances being work-related.
Nearly half the couples saw each other at least three times a week and only 17% did not meet once a week. The closer proximity of Young adults enabled one third of them to see each other every day. However, travel time is not the only determinant in the frequency of LAT couples visits. When both partners lived less than half an hour away from each other, half the Young adults saw each other six times a week compared with four or five times (4.6 times) in the case of Single parents and five times for the Out of a family and Seniors groups. Studying at the same institution may explain the near-daily meetings of the young people.
Table 7: Travel time between homes and frequency of meeting (median and distribution)
Young adults
Out of a family
Single
parents Seniors All
Travel time between homes
Median in minutes 20 30 20 30 25
< 15 minutes 47.1 36.2 43.6 33.2 41.1
15-59 minutes 26.3 25.3 25.7 29.9 26.4
1 hour 11.5 15.2 14.9 23.6 14.7
2+ hours 15.1 23.3 15.8 13.2 17.8
Total 100 100 100.0 100.0 100
Frequency of meeting
Median: times/week 3.0 2.6 2.6 2.7 2.8
Daily 33.3 20.2 26.0 36.0 28.4
4 to 6. 15.9 22.3 17.4 10.9 17.6
1 to 3. 36.0 39.6 42.6 32.7 37.4
<1 time 14.8 17.9 14.0 20.4 16.6
Total 100.0 100.0 100.0 100.0 100.0
If travel time is less than 30 minutes maximum
Median 6.0 5.0 4.6 5.2 5.0
Source: INED-INSEE, GGS-ERFI, 2005
Figure 3: Relationship duration (distribution)
0% 10% 20% 30% 40% 50% 60% 70% 80% 90% 100%
Young adults Out of a family
Single parents
Seniors
>9 years
5-9 years
3-4 years
1-2 years
<1 year
Source: INED-INSEE, GGS-ERFI, 2005
4.3 Living apart: Voluntary or involuntary, temporary or lasting
The different reasons for LAT relationships may be interpreted both by the way the couples perceive the reasons for their residential separation and, by their plans for living together, or not. Six couples out of ten perceived their separation as a constraint (Table 8) and seven out of ten intended to live together within three years (Table 9). Couples’ intentions and reasons for living separately depend very much on each other but not to the extent one might have thought: 81% of those who perceived their separation as an imposition did intend to cohabit within a few years, as did 62% of those who felt they were not ready. This was also the case for one respondent in three who reported having chosen separation. So how should one interpret this apparent contradiction? Not all the work-related separations were imposed, some were “chosen” to advance a career. In such cases geographic distance was not perceived as a constraint but a choice and the couple intended to live together in the future.
also more likely to intend to live together within three years (84%) (Table 9). This high frequency of “involuntary” separation was explained by their studies (in three out of four cases at least one partner was a student) or by unemployment (one in ten cases for at least one partner). The other groups less frequently reported involuntary separation but it was never totally absent. It is rare for young people who have never lived as a couple to want an LAT relationship (6%) and only one in ten reported not feeling ready. Conversely, six Seniors out of ten elected to maintain separate households (Table 8) and nearly seven out of ten did not intend to live together in the next few years (Table 9). For 40% of respondents in this category the decision corresponded to a desire for lasting independence, and in the case of 11% meant temporary independence until they were ready. In one out of two cases, the union had lasted 10 years, confirming that the Seniors did not plan to live with their present partners. Widows were more likely to choose LAT relationships (26%), than separated or divorced individuals, doubtless out of respect for their dead partner or for their children, or to hold on to their assets, their house in particular (Caradec 1996)12. Three-quarters of widows lived separately by choice. However, Seniors who had never lived as a couple (20%) were not necessarily “confirmed” singles, who refused to change their habits. On the contrary, half perceived their residential separation as imposed by circumstance, compared with only 34% of those who had already lived as a couple.
The Out of a family and Single parent groups were midway between the two positions. The former perceived LAT more as a constraint (55%) and 72% of these respondents intended to live together within three years. An important segment of the Out of a family category who chose separation only did so for a limited period of time, but two out of ten did not intend to cohabit in the future.
In the case of Single parents, separation was as often a choice (47%) as a constraint (46%). Their desire to live alone was no greater than the Out of a family category, but 11% of the Single parents wanted to live alone because of their children. This decision may be interpreted as being made in the interest of the children or because Single parents find it more suitable. Like the other groups, some of the Single parents who stated that separation was a choice did perceive it to be temporary.
12 French survey results concord with findings from abroad concerning the voluntary or involuntary nature of
Table 8: Reasons for LAT
Young adults
Out of a family
Single parents
Seniors All
A choice
Overall 20.8 36.6 47.4 61.9 34.4
Remain independent 5.9 20.4 18.3 40.8 16.9 Wait until ready 9.5 9.1 15.6 10.7 10.1
Children 0 0.9 10.8 2.4 1.7
Other reason 5.4 6.2 2.7 8.0 5.8
A constraint
Overall 71.7 55.3 46.0 34.5 58.5
Occupational 18.5 23.9 11.4 7.8 18.3
Financial, housing 29.5 13.9 9.2 6.0 18.3
Other reason 23.7 17.5 25.4 20.6 21.3
Both a choice and a constraint 7.5 8.1 6.6 3.6 7.1
Total 100.0 100.0 100.0 100.0 100.0
Source: INED-INSEE, GGS-ERFI, 2005
Table 9: Intend to live together within three years
Profiles Yes (probably) No (probably)
Doesn’t apply
or don’t know Total
Overall 70.0 25.0 5.0 100.0
Young adults 84.1 12.5 3.4 100.0
Out of a family 71.7 22.2 6.1 100.0
Single parents 60.8 28.4 10.8 100.0
Seniors 28.4 67.8 3.8 100.0
Perception of LAT
A constraint 80.8 15.7 3.5 100.0
“Not ready” 61.6 29.8 8.6 100.0
A choice 49.2 43.1 7.7 100.0
4.4 Obstacles to cohabitation
Respondents were asked what the outcome of living with their partners might be. The main attractions cited were the pleasure and satisfaction of communal life, as well as the influence on the couple’s sex life. This view was shared by all individuals in a stable relationship. But future plans depended on external factors quite independent of the couple’s love or their desire to share their day-to-day lives or to remain independent.
The following series of questions was designed to gauge precisely the factors influencing the cohabitation decision: “To what extent does your decision to live with your partner in the next three years depend on the following factors: Your personal financial situation? Your work? Your housing? Your health? Your love relationship? Your children?” In the case of the Seniors, the work question should be understood as anticipation of retirement. Very few respondents replied that their plans depended on their health, so we excluded this factor for reasons of brevity. Five answers were suggested for each question, ranging from “not concerned” and “not at all” to “enormously.” To interpret the answers we observe the proportion of persons who replied “enormously” or “a great deal” to each question,” distinguishing respondents by profile and their plans for the next three years (Figure 4).
Figure 4: Decisive factors in the decision to cohabit or not to cohabit in the next three years
A _ Decisive factors in the decision to cohabit Young adults
0 10 20 30 40 50 60
Yes No
INTENTIONS ALL
(%)
B _ Decisive factors in the decision to cohabit Out of a family
0 10 20 30 40 50 60
Yes No
INTENTIONS ALL
Your relationship Your work Your financal situation Your housing
Figure 4: (Continued)
C _ Decisive factors in the decision to cohabit Single parents
0 10 20 30 40 50 60
Yes No
INTENTIONS ALL
(%)
D _ Decisive factors in the decision to cohabit Seniors
0 10 20 30 40 50 60
Yes No
INTENTIONS ALL
Your relationship Your work Your financal situation Your housing
(%)
It comes as no surprise that developments in the love relationship are the main factors affecting couples’ decisions to cohabit. Only Young adults attach as much importance to their working career as they attach to their love relationship if they intend to cohabit (respectively 46% and 48%), and even more if they do not intend to cohabit (53% versus 39%) (Figure 4A).
After developments in the love relationship, the decision to live together depends mainly on employment for the Out of a family (33%), and not on housing (28%). If they intend to cohabit, their financial situation over the next three years does not worry them. It is doubtless their conviction that at least one of them will have a job which enables them to make this decision (except for 12%) (Figure 4B). Housing is decisive for 21% of Single parents wishing to cohabit, and is never so for those not wishing to (Figure 4C). Family recomposition creates a need for increased living space and limits location choice (close to other parent's home for example), especially if one of the partners has children from a previous union.
Among the factors cited, the love relationship is also the most important for Seniors, although only 12% base their decision upon it. This somewhat surprising result may be explained by the duration of their relationships in that the longer they last, the less the soundness of the relationship is questioned and the less likely respondents are to reply that their plans depend upon them. Changes in the seniors’ life styles are less likely to be a result of occupational, financial or residential changes, so reasons for LAT must be found elsewhere.
The decision for parents to live as a couple may depend on their children. All the Single parent group, and part of the Out of a family and Seniors were asked about this. Only the single parent group stated that this decision depended on their children, with whom they lived, and only if they wanted to live with their partners.
5. Discussion
cohabitation; today, among those in LAT relationships six people out of ten intend to live together within the next three years. Additionally the age at which people marry has risen since 1972, whereas the age at which people first form couples has remained stable during some time and cohabitation has become a lasting way of life. More recently, people have started living together at a later age as well, which could make way for LAT relationships.
So what will become of LAT, and does it help defining a couple? Desire to have children and the birth of a child is, and will remain, the decisive factor of living together for Young adults and a part of the Out of a family category. However, the characteristics and expectations of people in LAT relationships also correspond to other stages in life: young adult women living alone with their children after separation, or older persons, often widowed, wishing to maintain their independence. For many years, marriage was sufficient to define a couple. Then as informal unions became widespread, this was replaced by “sharing a home.” So what criterion or criteria can we use to define a couple when they live separately? This study of LAT relationships does not provide a definition of a couple; nor does it provide a means for counting them. Perhaps we should abandon, at least temporarily, the idea that an indicator must be “verified” or should be “objective” and allow the individuals concerned to report themselves as “noncohabiting couples,” “engaged in a serious unmarried intimate relationship” or in a “relationship without ties.”
6. Acknowledgments
References
Caradec, V. (1996). Les formes de la vie conjugale des ‘jeunes’ couples ‘âgés’. Population 51(4-5): 897-927. doi:10.2307/1534359.
Cassan, F., Mazuy, M., and Clanché, F. (2005). Refaire sa vie de couple est plus fréquent pour les homes. In: Lefèvre, C. and Filhon, A. (eds.). Histoires de familles, histoires familiales: les résultats de l'enquête Famille de 1999. Paris, Institut national d’études démographiques. Coll. «Les Cahiers de l'Ined»: 223-231.
Castro-Martín, T., Dominguez-Folgueras, M., and Martin-Garcia, T. (2008). Not truly partnerless: Non-residential partnerships and retreat from marriage in Spain. Demographic Research 18(16): 443-468. doi:10.4054/DemRes.2008.18.16.
de Jong Gierveld, J. (2004). Remarriage, unmarried cohabitation, living apart together: partner relationships following bereavement or divorce. Journal of marriage and family 66(1): 236-243. doi:10.1111/j.0022-2445.2004.00017.x.
de Singly, F. (1987). Fortune et infortune de la femme mariée: sociologie de la vie conjugale. Paris: Presses Universitaires de France.
de Singly, F. (2000). Libres ensemble. L’individualisme dans la vie commune. Paris: Nathan, Essais et Recherches collection.
Haskey, J. (2005). Living arrangements in contemporary Britain: having a partner who usually lives elsewhere and living apart together (LAT). Population Trends 122: 35-45.
Kaufmann, J.C. (1999). La femme seule et le prince charmant, enquête sur la vie en solo. Paris: Nathan, Pocket.
Leridon, H. and Villeneuve-Gokalp, C. (1988). Les nouveaux couples: Nombre, caractéristiques et attitudes. Population 43(2): 331-374. doi:10.2307/1532834. Levin, I. and Trost, J. (1999).Living apart together. Community, Work & Family 2(3):
279-294. doi:10.1080/13668809908412186.
Milan, A. and Peters, A. (2003). Couples living apart. Canadian Social Trends 11-008: 2-6.
Rault, W. (2009). L’invention du Pacs. Pratiques et symboliques d’une nouvelle forme d’union. Paris: Sciences Po. Les Presses.
Régnier-Loilier, A. (2006). How often do adult children see their parents? Population & Societies 427. http://www.ined.fr/fichier/t_publication/1211/publi_pdf2_pop. and.soc.english.427.pdf.
Régnier-Loilier, A. (2007). Avoir des enfants en France. Désirs et réalités. Paris: Institut national d’études démographiques. Coll. «Les Cahiers de l’Ined».
Régnier-Loilier, A. and Vivas, É. (2009). Les déterminants de la fréquence des rencontres entre enfants et parents. In: Régnier-Loilier, A. (ed.). Photos de familles. Étude des relations familiales et intergénérationnelles. Paris: Institut national d’études démographiques. Coll. «Grandes Enquêtes».
Robert-Bobée, I. (2002). Les étudiants sont les plus aidés par leurs parents. Insee Première 826.
Schwartz, O. (1990). Le monde privé des ouvriers : hommes et femmes du Nord. Paris: Presses Universitaires de France.
Sebille, P. and Régnier-Loilier, A. (2007). Modifications to the Generations and Gender Surveys Questionnaire in France (Wave 1). L’Étude des relations familiales et intergénérationnelles (Érfi)/Documents de travail. N. 144. Paris: Institut national d’études démographiques: 200 pages. http://www.ined.fr/fichier/t_publication/
1302/publi_pdf2_144._english.pdf.
Sobotka, T. and Toulemon, L. (2008). Changing family and partnership behaviour: Common trends and persistent diversity across Europe. Demographic Research 19(6): 85-138 (Special Collection 7: Fertility trends and policies in Europe). doi:10.4054/DemRes.2008.19.6.
Toulemon, L. (1997). Cohabitation is here to stay. Population, an English selection 9: 11-46.
Vikat, A., Spéder, Z., Beets, G., Billari, F.C., Bühler, C., Désesquelles, A., Fokkema, T., Hoem, J.M., MacDonald, A., Neyer, G., Pailhé, A., Pinnelli, A., and Solaz, A. (2007). Generation and Gender Survey (GGS): Towards a better understanding of relationships and processes in the life course. Demographic Research 17(14): 389-440. doi:10.4054/DemRes.2007.17.14.