www.wjpr.net Vol 3, Issue 6, 2014. 1616
DEVELOPMENT AND VALIDATION OF HPLC-UV METHOD FOR
THE DETERMINATION OF E AND Z GUGGLESTERONE IN RAT
PLASMA: APPLICATION TO PLASMA PROTEIN BINDING STUDY
Shriyans Jain1*, Vikas Kumar2, Aina3 and Rajvir Singh4 1
Department of Ayurveda, Shri Venkateswaray University Gajraula, Amroha, (U. P.) India 2
Department of Microbiology, Shri Venkateswaray University Gajraula, Amroha (U. P.) India
3
Department of Biotechnology, Shri Venkateswaray University Gajraula, Amroha (U. P.)
India 4
Department of Botany, K. K. Degree college, Etawah (U.P) India
ABSTRACT
A simple, sensitive, precise and accurate reversed phase liquid chromatographic method has been developed for the estimation of E and Z guggulsterone in rat plasma. The method was developed using a Phenomenex C-18 Column (150 x 4.6mm, 5µ) with a mobile phase
consisting of Methanol : TDW (0.5% Formic Acid) – 75 : 25, at a flow rate of 1.0 mL min-1. With prednisone as internal standard, plasma samples were extracted by manual solid-phase extraction method using C-18 SPE cartridges. Detection was performed by HPLC-UV detector. The UV detection was achieved at 240 nm, over a wide dynamic range of 0.62 to 20 µg mL-1. The retention time of E & Z guggulsterone and internal standard was 7.2, 9.2 and 11 minute respectively. The method was successfully validated in accordance to FDA guidelines acceptance criteria for specificity, linearity, accuracy, precision,. Calibration curve was linear over the concentration
range of 0.62 to 20 µg mL-1 (r2 0.998) for both analytes. The intra- and inter-day accuracy
and precision method were within -4.05 to 5.92 (% bias) and 3.97 to 12.98 (% RSD) respectively. The analytes were stable after three freeze-thaw cycles. The method was successfully applied to protein binding study of E and Z guggulsterone in rat plasma.
KEY WORDS: Guggulstrone, HPLC, Rat Plasma.
Volume 3, Issue 6, 1616-1627. Research Article ISSN 2277 – 7105
Article Received on 30 June 2014,
Revised on 25 July 2014, Accepted on 20 August 2014
*Correspondence for
Author
Dr. Shriyans Jain
Department of Ayurveda, Shri
Venkateswaray University
www.wjpr.net Vol 3, Issue 6, 2014. 1617 INTRODUCTION
Gum resin of Commiphora mukul is used in Ayurveda for various ailments such as atherosclerosis, hyperlipidemic, obesity and other lipid disorders [1-4]. The standardized ethyl acetate extract of this gum resin (Guggul) was reported to have marked antihyperlipidemic activity [5-7]. In 1986, with proven efficacy and safety, Guggul was approved for marketing in India as hyperlipidemic drug and currently in United State and western world it is marketed as dietary supplement [5, 8, 9].
Guggulsterone, characterized as cis (E)- and trans (Z)- stereo isomers of 4,17(20)-pregnadiene-3,16-dione (Fig-1). It was reported to act by FXR antagonism and inhibition of platelets aggregation [10-12]. These two isomers also exhibited potential antioxidant, anti-arthritic, anti-inflammatory, memory enhancer and anti-cancer activities [8, 9, 13-16]. The pharmacokinetic profiles of two active isomers guggulsterone have not been fully explored.
Method validation is the process of proving that an analytical method is accepted for its intended purpose. For pharmaceutical methods, guidelines from the Unites States of Pharmacoepia (USP), International Conference on Harmonization (ICH) and the Food and Drug Administration (FDA) provides a frame work for performing such validations [17, 18]. Therefore aim of the present work was to develop simple, precise and accurate RP- HPLC method for determination of E and Z guggulsterone in rat plasma. The established method was validated with respect to specificity, linearity, precision, accuracy and stabilities. The method was applied to determine the concentration of E- and Z- guggulsterone in rat plasma protein binding study.
Experimental
Chemicals and Materials
Premixed E- and Z-Guggulsterone at 1:1 ratio was kindly given from Sami Lab Limited (Bangalore, India). Prednisone (Internal Standard) was purchased from HiMedia Laboratories Pvt. Ltd. (Mumbai, India) HPLC grade acetonitrile and methanol were from Sigma Aldrich Chemicals Pvt Ltd (Mumbai, India). Sodium acetate AR, glacial acetic acid AR, and ammonia solution (25%) were purchased from E Merck Pvt Ltd (Mumbai, India). Heparin sodium injection IP. (1000 IU/ml) was procured from local medical shop. Dextran-coated
www.wjpr.net Vol 3, Issue 6, 2014. 1618 E & Z guggulsterone in Shudha guggule Batch by Himalaya Ltd, (India) were purchased from local pharmacy within their shelf-life period. For calibration standards and quality control, drug-free heparinised plasma was obtained from different healthy male rats housed in the Laboratory Animal Services Division of the institute. All animal experiments were carried out as per the guidance and approval of the institutional ethical committee on animal experimentation
Instrumentation and Chromatographic Conditions
The method was developed using a Waters HPLC system consisted of a binary pump , auto sampler and UV detector. The separation was achieved on phenomenex C18 (150 x 4.6mm, 5µ) column with a mobile phase consisting of Methanol : TDW (0.5% Formic Acid) – 75 :
25) at a flow rate of 1.0 mL/min. Detection was carried out with ultra-violet detector at 240 nm. The total run time was 12 min. The volume of injection was 50 µL, prior to injection of analyte, the column was equilibrated for 30-40 min with mobile phase. The analysis was performed at ambient temperature.
Preparation of Standard Stock Solution and Calibration Curves
Standard stock solutions (1mg/ml) of guggulsterone (comprising of both E- and Z- isomers in equal amounts) and IS (prednisone) were prepared in methanol. Calibration standards and quality control (QC) samples were prepared by spiking 190 µl of blank rabbit plasma with 10
µl of corresponding working stock solution to get a concentration range of 0.62 to 20 µg/ml.
QC samples of five replicates at each concentration level of 0.62 µg/ml (lower limit of quantitation, LLOQ), 2.5 µg/ml (medium QC, MQC) and 20 µg/ml (high QC, HQC) were prepared by spiking 10 µl of working stocks in 190 µl blank plasma respectively. To each 100 µl of CS, QC and plasma samples, 10 µl of IS working stock (100 µg/ml) was spiked and
vortexes for 15 second before sample extraction. The calibration standards and quality control samples were prepared on each day of validation.
Sample preparation
A simple solid phase extraction method (SPE) was followed for extraction of E- and Z- guggulsterone [19] and IS from rat plasma. After little bit modification solid phase extraction was carried out using 1cc, C-18 (DSC-18, Supelco) cartridge in mannual SPE assembly
www.wjpr.net Vol 3, Issue 6, 2014. 1619 were eluted with 3 ml of methanol. Eluents were collected in glass tubes and evaporated to
dryness under nitrogen in water bath set at 40 C. The dry residues were finally reconstituted
in 200 µl methanol. Reconstituted samples were than 50 µl were injected onto the HPLC system.
Method Validation
The method was validated in terms of, specificity linearity, LOD and LLOQ, accuracy, recovery, precision, freeze-thaw, long-term, auto injector and dry residue stability as per FDA guidelines (2001)[20].
The selectivity of the method towards endogenous plasma matrix components was assessed in six individual batches of control drug-free rat plasma samples. This was done to estimate the extent to which endogenous plasma components contribute towards interference at the retention time of analytes and IS.
The linearity of the method was determined by analysis of five linear curves containing six non-zero concentrations. The ratio of area response for isomers to IS was used for regression analysis. Each calibration curve was analyzed individually by using least square linear regression. The lowest standard in the calibration curve was accepted as the lower limit of quantitation (LLOQ), if the signal to noise ratio is greater than five and accuracy and precision within ± 20%.
For determining the intra-day accuracy and precision, replicate analysis of plasma samples of E- and Z-isomers was performed on the same day. The run consisted of a calibration curve and five replicates of LLOQ, MQC and HQC samples. The precision was assesed by one-way ANOVA as within and between % R.S.D [21]. The accuracy was expressed as % bias . The inter-day accuracy and precision were determined by analysis of five precision and accuracy batches on five consecutive validation days. The criteria for acceptability of the data included accuracy within ± 15% standard deviation (SD) from nominal values and precision of within ±15% relative standard deviation (RSD), except for LLOQ, where accuracy and precision should not exceed ± 20%.
www.wjpr.net Vol 3, Issue 6, 2014. 1620 response of extracted samples (spiked before extraction) to that of analytical standard at same concentration level. The recovery of IS was similarly estimated. Absolute matrix effect (ME) was assessed by comparing the mean area response of unextracted samples (spiked after extraction) with mean area of neat standard solutions.
All stability studies were carried out at two concentration level i.e QC low (0.62 µg/ml) and QC high (20 µg/ml), using three replicates at each concentration level. The freeze-thaw
stability was determined after three freeze-thaw cycles. Post preparation stability was estimated by analyzing QC samples at 0 and 24 hr in the auto-sampler at 4 ºC. Post extracted
dry residue stability was determined for 48 hr, stored at -60 5 ºC to access permissible time
lag between extracted sample and instrumental analysis. The stability in rat plasma during 6
hr exposure (bench-top) was determined at room temperature (25 2 ºC). Long-term
stability was Carried out by analyzing QC samples stored at -60 5 ºC for 30 days. Samples
were considered to be stable if assay values were within the acceptable limits of accuracy
(i.e., ± 15%) and precision (i.e., ± 15% R.S.D).
Application to plasma protein binding study
Protein binding was estimated using the modified charcoal adsorption method. [22]
Preparation of dextran-coated charcoal suspension
The dextran-coated charcoal (0.66 g) was transferred to a 250 ml reagent bottle containing 100 ml of DPBS and the mixture was stirred with a magnetic stirrer at room temperature until the charcoal was suspended. This suspension was prepared at least 18 h before use and stored at 5–10°C for not longer than 30 days. The stored charcoal mixture was resuspended before use.
Charcoal adsorption assay
www.wjpr.net Vol 3, Issue 6, 2014. 1621 The supernatant was separated and was immediately transferred into a 5 ml glass tube and stored at -60°C until analysed.
RESULTS AND DISCUSSION Liquid chromatography
The chromatographic conditions were optimized with respect to specificity, resolution, and time of analysis. Hence we started the development activity with C18 stationary phase of various manufacturers such as Zorbax, ODS (250 × 4.6 mm, 5 µm), Spherisorb ODS (250 × 4.6 mm, 5 µm) Symmetry shield C18 (250 mm × 4.6 mm, 5.0 µ), and Phenomenex Luna C18
(250 ×4.6 mm, 5 µm). The last two columns were found to be suitable. However, phenominex C18 (150 mm × 4.6 mm, 5.0 µ, column was used as a good resolution and minimum elution time were obtained. But the stationary phase is not only the parameter which can give better resolution. Mobile phase, pH and organic modifies also plays very important role which leads the best separation.
Different mobile phases containing acetonitrile, methanol, water and buffer were examined. Initially the methanol was used as an organic modifier which gives the poor baseline with baseline drift. Hence the response for the E & Z guggulsterone was reduced. To improve the resolution and response, acetonitrile was tried as an organic modifier. The base line was found good and response E & Z guggulsterone was improved. The effect of buffer concentration on the retention of E & Z guggulsterone was also studied. The mobile phase containing Methanol: TDW contain 0.5% formic acid (75 : 25), was selected as optimal for obtaining well-resolved peaks with acceptable system suitability parameters. Flow rates from 0.8 to 1 ml/min were tested. Low flow rates led to an increase in retention times increasing the time of analysis for the studied analyte. High flow rates led to a remarkable increase in
column pressure and decrease in resolution. It was found that 1.0 ml/ min was optimal as it compromised between resolution and run time.
Effect of the wavelength on the response factor was observed over the wavelength range 303– nm. The detection wavelength, 240 nm was found optimal due to the high absorbtivity at this wavelength for E & Z guggulsterone. Complete separation was achieved in 12 min at ambient temperature. The average retention times ± RSD % for E & Z guggulsterone was
www.wjpr.net Vol 3, Issue 6, 2014. 1622 Specificity and selectivity
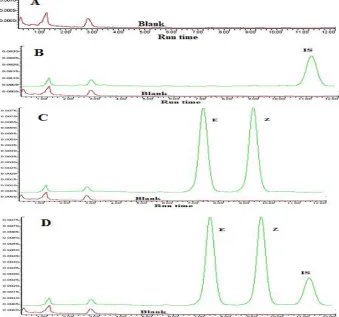
Representative chromatograms of extracted blank plasma, blank plasma fortified with guggulsterone, and IS are shown in Fig. 2. Chromatogram of six batches of control drug-free plasma contained no eluting peaks with > 5% of analyte area at LOQ level and no co-eluting peaks with > 5% of the area of IS. There was no cross interference at the retention time of both isomers of guggulsterone or IS was shown in Fig 3. The retention times of all the analytes and IS exhibited less variability with a relative standard deviation (R.S.D.) well
within the acceptable limit of 5% (2001).
Accuracy and precision
Accuracy and precision (intra- and inter-day) were calculated at three different concentration levels of LLOQ, medium and high QC samples for all analytes on 5 days are presented in table 1. The results exhibited that the analytical method was accurate, as the bias was within the acceptance limits of ± 20% of the theoretical value at LLOQ and ± 15% at all other
concentration levels. The precision around the mean value was never greater than 15% at
any of the concentrations studied.
Matrix effect
The results indicated that there was no significant difference (< 2.5%) in peak areas of both isomers of guggulsterone and IS between six different drug-free rat plasma samples and the mobile phase.
Calibration curve and recovery
The plasma calibration curve was constructed in the range of 0.62 µg/ml to 20 µg/ml. The calibration curve had a reliable reproducibility over the standard concentration across the calibration range. The average correlation coefficient (r2) (n = 5) of calibration curve was found to be 0.999 ± 0.0005 and 0.998 ± 0.0011 for E- and Z- guggulsterone respectively. The
absolute mean recovery for E- isomer were 89.56 6.92 and 86.9 11.2% at concentration
of 0.62, and 20 µg/ml respectively. In case of Z-isomer recovery was 88.6 9.6, 99.4 6. for
0.62and 20 µg /ml respectively.
Stability
www.wjpr.net Vol 3, Issue 6, 2014. 1623 residue for 48 hr, plasma sample stored at room temperature for 6 hr and plasma sample stored at -60 °C for 30 days.
Application to plasma protein binding study
The percentage binding is then estimated from the decline of percentage of the drug remaining in the supernatant after the addition of charcoal. Figure 3 depicts the percentage of E and Z guggulsterone remaining (mean . SEM, n = 3) versus time after the addition of male rat plasma containing 5 mg/ml of E and Z guggulsterone onto the charcoal pellet. The percentage protein binding in rats of E and Z guggulsterone was found to be 12.26 ± 0.5% and 11.35 ± 0.35%, respectively.
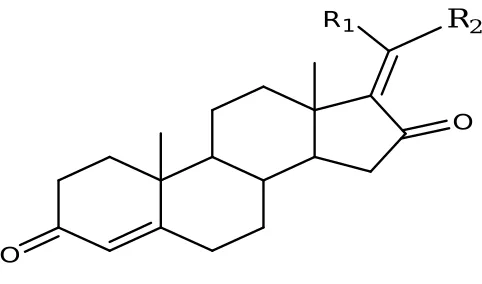
[image:8.595.190.431.289.431.2]1a. R1 = CH3, R = H E-Guggulsterone 1b. R1 = H, R2 = CH3 Z-Guggulsterone
Fig. 1. The chemical structure of guggulsterone (1) guggulsterone (Z-isomer (1a) and E-isomer (1b))
Fig-3. Decline of E and Z guggulesterone in male plasma rat plasma at 5 mg/ml spiked concentration using charcoal adsorption method shown as mean . SEM, n = 3.
R1
O
O
[image:8.595.95.496.532.704.2]www.wjpr.net Vol 3, Issue 6, 2014. 1624 Fig. 2. Chromatogram of E and Z guggulesterone, (A) Blank Rat Plasma, (B)Overlay blank with IS, (C)Overlay blank with E & Z guggulestrone, (D) Overlay blank with E & Z guggulestrone with IS
Table 1: Accuracy and precision in rat plasma. Analytes Concentration
(µg/ml)
Accuracy (%bias) Precision (%R.S.D.) Inter-day Intra-day Inter-day Intra- day
E Guggulestrone
0.62 -8.76 -7.44 13.80 7.98
2.5 3.12 3.87 7.99 7.57
20 1.04 1.68 9.09 7.52
Z Guggulestrone
0.62 -4.05 -2.70 9.68 7.69
2.5 2.77 -0.09 8.30 3.96
20 -1.36 5.25 12.00 6.20
Table 2: Freeze-Thaw stability data
Analytes Nominal concentration
(µg/ml
% Deviation After Freeze-Thaw Cycles First cycle Second cycle Third cycle
E Guggulestrone
0.62 -7.94 -19.66 -23.84
2.5 7.29 -22.04 -33.04
20 10.04 -23.34 -55.03
Z Guggulestrone
0.62 -11.37 -45.80 -29.94
2.5 -6.7 -29.58 -33.76
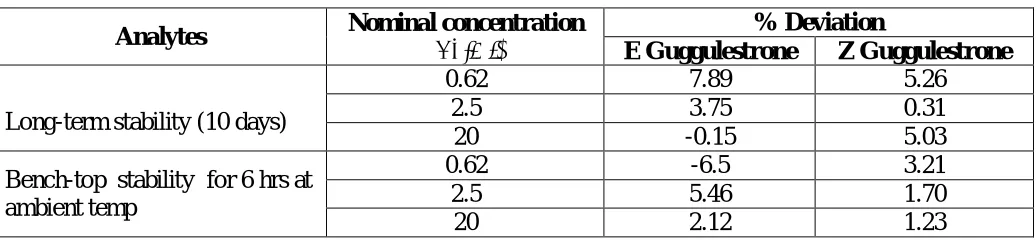
[image:9.595.56.533.471.806.2]www.wjpr.net Vol 3, Issue 6, 2014. 1625 Table 3: Long-Term and bench-top stability
Analytes Nominal concentration
(µg/ml)
% Deviation
E Guggulestrone Z Guggulestrone
Long-term stability (10 days)
0.62 7.89 5.26
2.5 3.75 0.31
20 -0.15 5.03
Bench-top stability for 6 hrs at ambient temp
0.62 -6.5 3.21
2.5 5.46 1.70
20 2.12 1.23
CONCLUSION
The validated RP-HPLC method employed here proved to be simple, specific, accurate, precise, and sensitive . The validated method showed satisfactory data for all the validation parameters tested. The optimum retention time allows the analysis of a large number of samples and is therefore more cost effective. The extraction method gave consistent and reproducible recoveries for analytes from rabbit plasma, with no interference and matrix suppression. The results of validation indicate that method can be considered suitable for carrying out plasma protein binding and preclinical pharmacokinetic studies of E- and Z-guggulsterone.
ACKNOWLEDGEMENTS
The authors are thankful to Vice chancellor Shri Venkateswaray University, for providing facilities and infrastructure for the study.
REFERENCE
1. Satyavati G.V., Dwarakanath C.,. Tripathi S.N, Experimental studies on the hypocholesterolemic effect of Commiphora mukul. Engl. (Guggul), Indian J. Med. Res. 1969; 57: 1950-12.
2. Kapoor N.K., Nityanand S., Triton induced hyperlipoproteinemia in rhesus monkeys, Indian J. Exp. Biol. 1975; 13:189-1.
3. Urizar N.L.,. Moore D.D, GUGULIPID: A Natural Cholesterol-Lowering Agent, Annual Review of Nutrition. 2003; 23:303-10.
4. Dev S., A modern look at an age old Ayurvedic drug- guggul, Science Age. 1987; 13-5. 5. Satyavati G.V, Gum guggul (Commiphora mukul)--the success story of an ancient insight
www.wjpr.net Vol 3, Issue 6, 2014. 1626 6. Singh R.B, Niaz M.A., Ghosh S., Hypolipidemic and antioxidant effects of Commiphora
mukul as an adjunct to dietery therapy in patients with hypercholesterolemia, Cardiovasc Drugs Ther. 1994; 8: 659-5.
7. Antarkar, R. Pande, A. Athavale, R. Shubhangi, S. Saoji, K. Shah, A. Jakhmola, A. Vaidya, Phase I tolerability study of Yogaraj-guggulu--a popular ayurvedic drug, J. Postgrad. Med. 1984; 30:111-4.
8. Deng R., Therapeutic effects of guggul and its constituent guggulsterone: cardiovascular benefits, Cardiovasc. Drug Rev. 2007; 25: 375-15.
9. Singh C.R., Kapoor NK.,, Hypolipidemic and antaoxidant effects of Commiphora mukul as an adjunct to ditery therapy in patients with hypercholesterolemia, Cardiovasc Drugs Ther. 1997; 8: 659-5.
10. Wu J, Xia C., Meier J.,. Li S, Hu X.,. Lala D.S, The hypolipidemic natural product
guggulsterone acts as an antagonist of the bile acid receptor, Mol Endocrinol. 2002;16 1590-7.
11. Cui J, Huang L, Zhao A, Lew J.L, Yu J, Sahoo S,. Meinke P.T, Royo I., Pelaez F,
Wright S.D, Guggulsterone is a farnesoid X receptor antagonist in coactivator association assays but acts to enhance transcription of bile salt export pump, J. Biol. Chem. 2003; 278) 10214-6.
12. Mester L.,. Mester M, Nityanand S., Inhibition of platelet aggregation by "guggulu"
steroids, Planta Med.1979 ; 37 :367-2.
13. Leeman-Neill R.J,. Wheeler S.E,. Singh S.V,. Thomas S.M,. Seethala R.R,. Neill D.B,.
Panahandeh M.C, Hahm E.-R.,. Joyce S.C,. Sen M,. Cai Q, Freilino M.L.,. Li C,. Johnson D.E,. Grandis J.R, Guggulsterone enhances head and neck cancer therapies via inhibition of signal transducer and activator of transcription-3, Carcinogenesis. 2009; 30:1848-8. 14. R Pratap, et.al., in: USPTO (Ed.), 2005.
15. Saxena G.,. Singh S.P,. Pal R,. Singh S,. Pratap R,. Nath C, Gugulipid, an extract of Commiphora whighitii with lipid-lowering properties, has protective effects against streptozotocin-induced memory deficits in mice, Pharmacol. Biochem. Behav. 2007; 86 : 797-3.
16. Singh BB, Mishra LC, Vinjamury SP, Aqquilinia N, Singh VJ, Shepard N, The effectiveness of Commiphora mukul for osteoartherisis of knee : an outcomes study,
www.wjpr.net Vol 3, Issue 6, 2014. 1627 17. US Department of Health and Human Services (2001), Guidelines for industry:
Bioanalytical method validation, Food and Drug Administration, Center for Drug Evaluation And Research Center (CDER).
18. ICH (2006), International conference on Harmonization, IFPMA.
19. Bhatta RS, Kumar D, Chhonker YS, and Jain GK. Simultaneous estimation E- & Z-isomers of guggulsterone in rabbit plasma by liquid chromatography /tandem mass spectrometry and its application to pharmacokinetics study. Biomed chro. 2011; 25 :1054-6
20. Guidance for Industry, Bioanalytical method validation, US Department of Health and Human Services, Food and Drug Administration center for Drug Evaluation And Research Center(CDER) , Center for Veterinary Medicine (CVM) 2001.
21. Williams MG,. Bothwell BE,. Zhong WZ, Development of a sensitive bioanalytical
method for determination of PNU-83757 in rat, monkey and human plasma: from LC-UV to LC-MS/MS. J. Pharm. Biomed. Anal. 2002; 429-12.
22. Yuan J1, Yang DC, Birkmeier J, Stolzenbach J. Determination of protein binding by in