Centralized Carrier Collaboration and Multi-Hub Location
Optimization Using a Genetic Algorithm
Jose F. Espiritu and Eduardo Castillo
Department of Industrial, Manufacturing and Systems Engineering
The University of Texas at El Paso
El Paso, TX 79968, USA
[email protected]
,
[email protected]
Abstract
In the present work a new genetic algorithm is developed to solve the Centralized Carrier Collaborative Multi-Hub Location Problem (CCCMLP) for the small-to medium-sized less-than-truckload (LTL) industry with the main objective of minimizing the total collaborative costs and carbon dioxide emissionsconsidering a set of collaborative carriers. The main costs considered in the present study are the transportation costs for direct shipment, collaborative transportation costs, loading, unloading and operations costs, holding costs and maintenance costs. The main emissions considered in the present study are those produced by the trucks in terms of carbon dioxide emissions. The CCCMLP represents a strategy in which a central system looks for a set of hybrid collaborative consolidation transshipment hubs with the main objective of establishing a collaborative hybrid hub-and-spoke system considering the minimization of the system costs and the minimization of the CO2 emissions. In the present work, a new Genetic Algorithm is developed to solve the CCCLMP.
Keywords
Genetic Algorithms, Supply chain, Centralized collaboration, Optimization
1.Introduction
As the internet became widespread during the 1990s, there has been an increased demand for the less-than-truckload (LTL) shipment industry(Hernandez et al, 2011). Large manufacturers and retailers have increased their demands and requirements due to the increase of online shopping and new inventory practices (Song and Regan, 2004). Not only this, but the Internet and Information Communication Technologies (ICTs) have changed the market by inserting a more spatially spread demand into it. (Anderson et al, 2003). These changes have brought up new challenges for the LTL carriers (Hernandez et al, 2011). Most of the implications of these changes have been endured by the small to medium-sized LTL industry, which have faced increased costs of shipping, jeopardizing their capabilities of sustaining profit. These low profit margins and spatially spread demand has resulted in their use of ICTs and the Internet in search for solutions (Mowery, 1999). As so, some small to medium-sized LTL carriers have begun collaboration by exploiting synergies such as excess capacity, overlapping lanes and facilities (Hernandez et al, 2011).LTL carrier collaboration can become a new model for reducing supply chain costs and increasing utilization of resources while improving the position of the carriers in the market (Hernandez et al, 2011).One of the main challenges for LTL collaboration lies in balancing the service requests and the capacity to service these requests. This balance relies on the affordability of the transportation as well as the size and value of the shipment (Hernandez et al, 2010, 2011, 2012). It is important to take this into consideration since small to medium-sized LTL carriers operate under a point-to-point network. These networks move shipments from origin to destination without middle points. As such, the objectives of this research are to identify and locate transfer hubs to ease and promote carrier collaboration and evaluate the environmental impacts in terms of CO2 emissions.
One of the main challenges for carrier collaboration is to identify the potential locations to install collaboration hubs. Many factors influence the decision of locating a hub, ranging from contract agreements to holding, collaboration, and congestion costs (Hernandez et al, 2011). Additionally, costs may depend on the transfer point (e.g. a city or town) in which they occur, and also the incoming and outgoing of trucks (Boardman, 1997). In addition, hub location selection may depend on product handling and storage capabilities. Some goods may require refrigeration or humidity control, while other goods may not. If we were to consider a heterogeneous product market, the complexity
Proceedings of the 2015 International Conference on Operations Excellence and Service Engineering Orlando, Florida, USA, September 10-11, 2015
of the problem would increase greatly (Hernandez et al, 2012; Hernandez et al, 2011). In this study, we assume a homogeneous fleet handling a single type of non-perishable goods.
In the present research a new genetic algorithm will be developed to address the Centralized Carrier Collaboration Multi-Hub Location Problem (CCCMLP) considering a group of small to medium-sized Less-than-Truckload (LTL) carriers. Here, a central entity organizes the collaboration of the carriers so as to minimize the total (collaborative) system costs subject to the behavior of the individual carriers that need a set of hubs to service demand. The problem is studied under the condition that all the information about costs and demands are known beforehand. Costs associated with events in the hub locations like loading and unloading and delays are considered in the holding costs. Moreover, in the present research, we will solve the CCCMLP problem considering the minimization of carbon dioxide emissions, as an ecologically sustainable system towards the long term sustainability, in order to estimate the CO2 emissions we used information from the Environmental Protection Agency (EPA).The following sections of this paper are as follows. Section 2 consists of a review of literature associated to carrier collaboration as well as hybrid hub-and-spoke systems. Section 3 explains the notation for the variables considered in the CCCMLP problem. In section 4 will further describe the CCCMLP problem as well as stating the assumptions made in the present research. Section 5 will show the development of the mathematical model to solve this problem. Section 6 will show an example in which this method was applied. Finally, in section 7 we present some concluding comments.
2. Literature Review
LTL carrier collaboration is a relatively unexplored concept within the ground freight domain. In the past, different researchers (Hernandez et al., 2011, Agarwal and Ergun, 2010, Kuo et al,2008 and Voruganti et al, 2011) have studied collaboration within the truckload (TL) carriers, liner shipping, and rail industries. Recently, Hernandez et al., (2012), and Hernandez and Peeta, (2010, 2011) introduced and studied the viability of LTL carrier collaboration with a static and dynamic context for a single carrier, and centralized planning perspective for multiple carriers. They explored the potential benefits of LTL carrier collaboration models. For instance, Vorugantiet al., (2011) studied partial and full carrier collaboration and applied the Shapley value principle to distribute the profits. The topology of the network was found to have a significant impact on the collaboration success. Moreover, Bayley et al., (2011a) developed integer programming models and heuristic algorithms usable by medium-sized freight companies to evaluate collaborative savings by minimizing deadheading. Additionally, Bayley (2011b), developed a cardinality and capacity constrained lane covering formulation for shipper collaboration and used Tabu search to solve the problem, in his work, the location of hubs to facilitate collaboration was not addressed as separate objective component.
The concept of hybrid hub-and-spoke is a relatively new one. Although not explicitly as collaboration, Zanget al., (2007) introduced the concept of hybrid hub-and-spoke for a single LTL carrier trying to minimize transportation costs. In their work, hybrid refers to the addition of direct routes to a pure hub-and-spoke system. The authors formulate the problem as a combinatorial one and solve it using a genetic algorithm methodology. Similarly, Zapfel and Wasner (2002) developed a hub-and-spoke system for cooperative third party logistics firms. From an LTL and pure hub-and-spoke perspective, Cunha and Silva, (2007) focused on configuring a hub-and-spoke network for a LTL trucking company in Brazil. They sought to determine the number of consolidation terminals (hubs), their locations, and the assignment of the spokes to the hubs, while aiming to minimize the total cost. The authors used a genetic algorithm and a local improvement procedure to solve the problem.
In the majority of the literature, collaboration is addressed without consideration of multi-hub location or addresses the multi-hub location from the context of a single LTL carrier; moreover, the problem has not been solved considering the minimization of CO2 emissions. Additionally in, the hybrid hub-and-spoke system we will consider a set of collaborative consolidation transshipment hubs from a current point-to-point network structure, as in Hernandez et al., (2011). Simply speaking, a hub-and-spoke system is formed without costly investments in new facilities. With this structure, the centralized carrier collaboration network can benefit from the hub-and-spoke system by consolidating shipments at specific locations to increase the efficiency of the operations and it can also be evaluated considering the CO2 emissions.
3. Problem Description and Assumptions
The CCCMLP seeks to determine a set of hybrid collaborative consolidation transshipment hubs for a central entity (e.g., third party logistics firm) to help establish a collaborative hybrid hub-and-spoke system that minimizes the total collaborative costs or the total CO2 emissions for the set of collaborating carriers. Hence, a carrier in this system is
classified as either a collaborative carrier (shares the costs to set up hybrid hubs), or non-collaborative (decides to ship directly). The operational networks of the collaborating carriers can be completely identical geographically or overlap in some segments relative to other carriers in the collaborative network. The collaborative rate structure of the collaborative carriers is represented by a revenue oriented behavior. If a collaborative opportunity cannot be identified with regards to hybrid collaborative consolidation transshipment hubs, a non-collaborative option is considered. It is assumed that the costs of shipping directly fall upon the carrier itself. The following assumptions are made in the CCCMLP: (i) candidate hybrid collaborative consolidation transshipment hubs are uncapacitated, and (ii) homogenous products are shipped. In addition, the problem is deterministic in the sense that the demand is known and the available holding times at facilities are time invariant. By contrast, a stochastic version of the problem would entail stochasticity of demand of the collaborating carriers.
4. Model Formulation
Let the carrier company be denoted by 𝑞 ∈ 𝑄, the origin of a shipment by 𝑖 ∈ 𝐼 ⊆ 𝑁, its destination by 𝑗 ∈ 𝐽 ⊆ 𝑁, and the hubs by which it may travel by 𝑘, 𝑙 ∈ 𝑁, where N is the total number of nodes in the network.Each carrier q
has an associated demand denoted by 𝑑𝑖𝑗𝑞, the number of shipments that must be made from the origin point i to the destination point j by the carrier q. The collaborative carrier revenue oriented cost associated to demand 𝑑𝑖𝑗𝑞 is given by
𝐶𝑖𝑗𝑘𝑙= 𝐶𝑖𝑘+ 𝛿𝐶𝑘𝑙+ 𝐶𝑙𝑗 (1)
where 𝛿 is the collaboration discount associated with transporting from hub k to hub l, and 0 ≤ 𝛿 ≤ 1, the collaborative discount of a shipment from hub to hub. The cost associated with a carrier q establishing a hub in node
k is denoted as
𝑃𝑘𝑞= 𝜗𝑘𝑞+ 𝜙𝑘 (2)
where𝜗𝑘𝑞 is the holding cost associated with carrier q storing merchandise at the hub in node k, and 𝜙𝑘 is the connection cost of the hub, that is, the cost associated with the loading and unloading of merchandise from one truck to another. The costs of shipping directly from node to node by each carrier will be denoted by 𝑊𝑖𝑗𝑞.
Let:
𝑌𝑖𝑗𝑘𝑙𝑞= 1, if a shipment is sent from node i to node j via the hubs k and l by the carrier q. That is, if the shipment is sent through a collaborative network. Otherwise, it will be equal to 0.
𝑉𝑖𝑗𝑞 = 1, if a shipment is sent directly from node i to node j by carrier q, and 0 otherwise.
𝑋𝑘 = 1, if the node at point k will become a hub, and 0 otherwise.
For the solution to this problem, we have determined the following constraints to be relevant to this problem. Constraint (3) makes it so that there is an exact number of hubs that can be implemented. In order to limit the number of routes from one point to the next, constraint (4) impedes the programming of more than one different route between two points in the system. Constraints (5,6) state that shipments from origin𝑖 ∈ 𝐼 to destination𝑗 ∈ 𝐽 cannot be assigned to a hub at location 𝑘 ∈ 𝐾 or 𝑙 ∈ 𝐿 unless a hybrid collaborative consolidation hub is located in these candidate sites. Constraint (7), ensures that the shipment will only go through the collaborative network if the cost of going through it is smaller than the cost of direct shipping. 𝛾 denotes the profit margin expected by a company in order to participate in the collaboration. Constraints set (8-10) constraints variables X, Y, and V into the binary space.
∑ 𝑋𝑘 𝑘 = 𝑝 (3) ∑ ∑ 𝑌𝑘 𝑙 𝑖𝑗𝑘𝑙𝑞+ 𝑉𝑖𝑗𝑞= 1 ∀𝑖, 𝑗, 𝑞 (4) ∑ 𝑌𝑙 𝑖𝑗𝑘𝑙𝑞≤ 𝑋𝑘 (5) ∑ 𝑌𝑘 𝑖𝑗𝑘𝑙𝑞≤ 𝑋𝑙 (6) 𝐶𝑖𝑗𝑘𝑙𝑌𝑖𝑗𝑘𝑙𝑞≤ 𝑉𝑖𝑗𝑞(1 − 𝑉𝑖𝑗𝑞)(1 − 𝛾) ∀𝑖, 𝑗, 𝑘, 𝑙, 𝑞 (7) 𝑋𝑘∈ {0,1} (8) 𝑌𝑖𝑗𝑘𝑙𝑞∈ {0,1} (9) 𝑉𝑖𝑗𝑞∈ {0,1} (10)
4.1 Objectives considered
The objective function seeks a set of candidate hybrid collaborative consolidation hubs as to minimize the total transportation collaborative costs in a supply chain. It consist of three terms, the first term represents the total transportation costs associated to the carrier collaborative, the second part represents the total costs associated with carriers not collaborating and shipping directly, and third represents the total carrier collaborative costs associated with locating a collaborative candidate hybrid consolidation facilities. The second objective function considered in the present study (Equation 12) considers the minimization of the CO2 emissions, similarly as in the previous cost function, the objective consists of two main terms, the first term represents the total emissions associated to the carriers collaborating, the second part represents the total CO2 emissions associated with carriers not collaborating and shipping directly. The collaborative transportation costs are obtained as the summation of the product of the cost of travel for a shipment 𝐶𝑖𝑗𝑘𝑙, the collaborative carrier demand𝑑𝑖𝑗𝑞 and 𝑌𝑖𝑗𝑘𝑙𝑞(the decision on whether a shipment travels via the collaborative hubs). The non-collaborative costs are obtained as the summation of the cost of shipping directly𝑊𝑖𝑗𝑞, the collaborative carrier demand 𝑑𝑖𝑗𝑞, and the 𝑉𝑖𝑗𝑞 (the decision on whether to ship directly). The collaborative candidate hybrid consolidation hub location costs are obtained as the summation of the product of the costs of locating a collaborative hub 𝑃𝑘𝑞, and the 𝑋𝑘(the decision on whether a collaborative facility is located). Equation (11 and 12) subject to constraints (3) through (10) represents the mathematical formulation of the centralized carrier 31 collaborative multi-hub location problem (CCCMLP).
min ∑ ∑ ∑ ∑ ∑ 𝐶𝑖 𝑗 𝑘 𝑙 𝑞 𝑖𝑗𝑘𝑙𝑑𝑖𝑗𝑞𝑌𝑖𝑗𝑘𝑙𝑞+ ∑ ∑ ∑ 𝑊𝑖 𝑗 𝑞 𝑖𝑗𝑞𝑑𝑖𝑗𝑞𝑉𝑖𝑗𝑞+ ∑ ∑ 𝑃𝑘 𝑞 𝑘𝑞𝑋𝑘 (11)
min ∑ ∑ ∑ ∑ ∑ 𝐺𝑊𝑃𝐶𝐶𝑖 𝑗 𝑘 𝑙 𝑞 𝑖𝑗𝑘𝑙𝑑𝑖𝑗𝑞𝑌𝑖𝑗𝑘𝑙𝑞+ ∑ ∑ ∑ 𝐺𝑊𝑃𝑁𝐶𝐶𝑖 𝑗 𝑞 𝑖𝑗𝑞𝑑𝑖𝑗𝑞𝑉𝑖𝑗𝑞 (12)
5. Algorithm Development
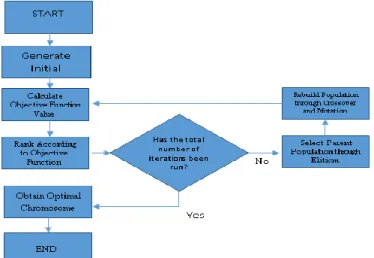
In the present research, a new Genetic Algorithm (GA) is developed to solve the CCCMLP problem. A Genetic Algorithm is a metaheuristic search method that imitates the process of natural selection. It was first introduced by Holland in 1975 through his book “Adaptation in Natural and Artificial Systems.” It follows the “survival of the fittest” theory as the “weakest” (less optimal) individuals are eliminated and the “strongest” or “fittest” individuals remain and serve to create a new population.The genetic algorithm has been used to solve problems in many different fields such as flowshop problems (Reeves, 1995), flexible docking, and project scheduling (Hartmann, 1998) among others.In the present research, the GA developed is flexible enough to solve problems considering any number of destinations and consolidation hubs. The GA first generates an initial random population, and then the objective function is evaluated for each chromosome and they are ranked according to the result. Elitism is used to keep the best solutions.Then the current population is considered to select two parents that will go through the crossover operator to form the new population. Additionally, a random mutation is introduced to the population to add variation in the search process. The process of evaluating, ranking, crossover and mutating will be repeated a number of iterations until stopping criteria is satisfied.Each of the steps taken by the algorithm are shown in Fig.1.
5.1 Initial generation
The first step the algorithm takes is the creation of a random population of individual chromosomes. For this, it will create a zero matrix of size m x n+1, where m is the size of the population. Following this, the matrix will randomly select points in the individual chromosomes, until each of them has p elements equaling one, thus meeting the constraint for number of hubs allowed.
5.2 The Fitness Function
The Fitness Function is determined via the use of an optimized cost matrix S. This matrix starts being the same as the cost matrix W given as a superposition of tables 4 and 5, and changes the values in the matrix to those in the Collaborative cost matrix C if 𝛾𝑆𝑖𝑗𝑞> 𝐶𝑖𝑗𝑘𝑙 for all values of l, k. The fitness value, which is equal to the objective function, is determined as a point product of the Optimized Cost Matrix S and the Demand Matrix D, added to the Hubs cost, given as a scalar multiplication of the hub creation costs for each carrier times the first n values of the chromosome.
Figure 1: Genetic Algorithm Flowchart
5.3 Crossover
Crossover is the process by which a new generation is built. This process can be performed via single point or multi point crossover. For this algorithm, a single point crossover is considered. The single point crossover function consists on mixing two parents at a random point to create a new individual, as shown in Fig 2. For the crossover function, it was decided that a random process would be more likely to produce results that vary more between each other. A set of parents is selected from the population by elitism, as the top x percentage of the population. As so, the algorithm selects a random point in two random chromosomes amongst the parent population, taking the first part of the new chromosome from the first parent and the second from the second parent.
Figure 2. Single Point Crossover
5.4 The Mutation Function
In order to adequately mimic the natural evolutionary process, a random mutation element must be included. As so, if a random number between zero and one is smaller than the specified mutation factor, a random point in the chromosome is changed from zero to one or from one to zero. This is shown in Figure 3 as follows. An adjuster for the number of chromosomes then randomly selects points in the chromosome to change to one or zero if the number of hubs is different to p, the selected number of hubs specified in Equation 3.
Figure 3. Mutation Function
6. Examples
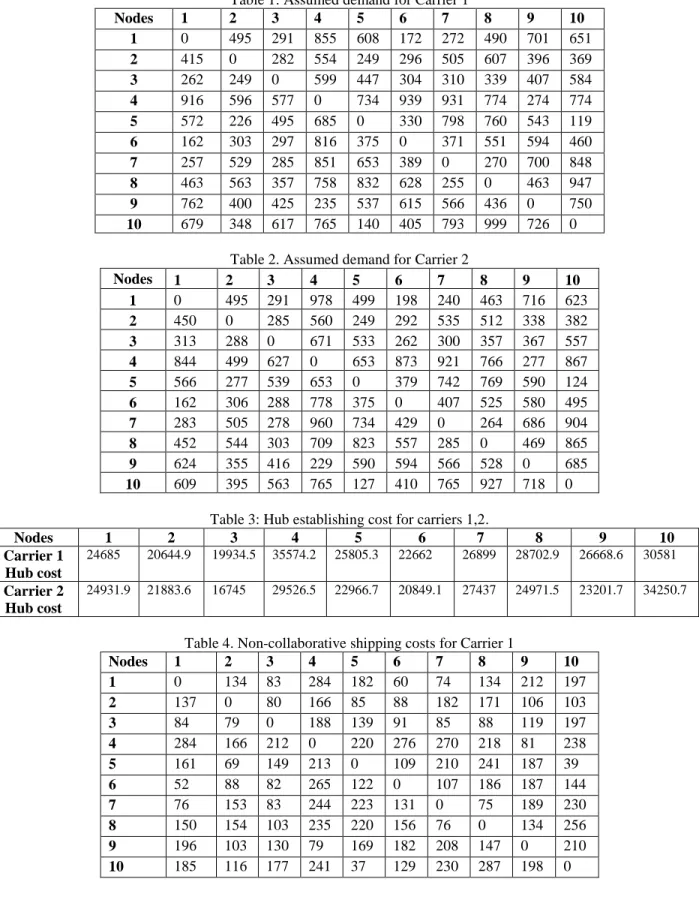
6.1 Case Study 1: Cost minimization
Using data from tables 1-6, we will determine the savings obtained by implementing a 10 node hub-and-spoke network and establishing collaboration between 2 carriers with varying degrees of expected profit margins γ.
Table 1: Assumed demand for Carrier 1 Nodes 1 2 3 4 5 6 7 8 9 10 1 0 495 291 855 608 172 272 490 701 651 2 415 0 282 554 249 296 505 607 396 369 3 262 249 0 599 447 304 310 339 407 584 4 916 596 577 0 734 939 931 774 274 774 5 572 226 495 685 0 330 798 760 543 119 6 162 303 297 816 375 0 371 551 594 460 7 257 529 285 851 653 389 0 270 700 848 8 463 563 357 758 832 628 255 0 463 947 9 762 400 425 235 537 615 566 436 0 750 10 679 348 617 765 140 405 793 999 726 0
Table 2. Assumed demand for Carrier 2
Nodes 1 2 3 4 5 6 7 8 9 10 1 0 495 291 978 499 198 240 463 716 623 2 450 0 285 560 249 292 535 512 338 382 3 313 288 0 671 533 262 300 357 367 557 4 844 499 627 0 653 873 921 766 277 867 5 566 277 539 653 0 379 742 769 590 124 6 162 306 288 778 375 0 407 525 580 495 7 283 505 278 960 734 429 0 264 686 904 8 452 544 303 709 823 557 285 0 469 865 9 624 355 416 229 590 594 566 528 0 685 10 609 395 563 765 127 410 765 927 718 0
Table 3: Hub establishing cost for carriers 1,2.
Nodes 1 2 3 4 5 6 7 8 9 10 Carrier 1 Hub cost 24685 20644.9 19934.5 35574.2 25805.3 22662 26899 28702.9 26668.6 30581 Carrier 2 Hub cost 24931.9 21883.6 16745 29526.5 22966.7 20849.1 27437 24971.5 23201.7 34250.7
Table 4. Non-collaborative shipping costs for Carrier 1
Nodes 1 2 3 4 5 6 7 8 9 10 1 0 134 83 284 182 60 74 134 212 197 2 137 0 80 166 85 88 182 171 106 103 3 84 79 0 188 139 91 85 88 119 197 4 284 166 212 0 220 276 270 218 81 238 5 161 69 149 213 0 109 210 241 187 39 6 52 88 82 265 122 0 107 186 187 144 7 76 153 83 244 223 131 0 75 189 230 8 150 154 103 235 220 156 76 0 134 256 9 196 103 130 79 169 182 208 147 0 210 10 185 116 177 241 37 129 230 287 198 0
Table 5. Non-collaborative shipping costs for Carrier 2 Nodes 1 2 3 4 5 6 7 8 9 10 1 0 134 92 300 150 58 76 157 190 202 2 126 0 78 151 81 93 181 182 101 104 3 78 90 0 193 131 85 90 107 119 167 4 253 153 216 0 210 273 279 193 81 263 5 172 79 134 227 0 113 230 217 193 35 6 56 107 89 256 109 0 126 190 176 126 7 71 159 86 267 218 123 0 90 187 254 8 157 159 89 223 217 177 86 0 139 269 9 206 119 118 74 179 172 195 134 0 213 10 174 112 169 230 34 140 274 253 196 0
Table 6. Collaborative shipping costs for Carriers 1, 2.
Nodes 1 2 3 4 5 6 7 8 9 10 1 0 46 31 101 60 20 26 50 70 66 2 48 0 28 55 27 35 60 61 38 40 3 31 27 0 66 50 29 31 33 43 60 4 101 57 69 0 78 88 92 75 27 89 5 58 28 48 76 0 38 79 87 67 14 6 19 36 31 86 39 0 42 60 65 47 7 28 60 29 90 78 43 0 28 64 86 8 54 61 35 74 86 61 27 0 48 98 9 72 40 42 27 63 69 69 50 0 75 10 67 39 63 86 14 46 83 102 77 0
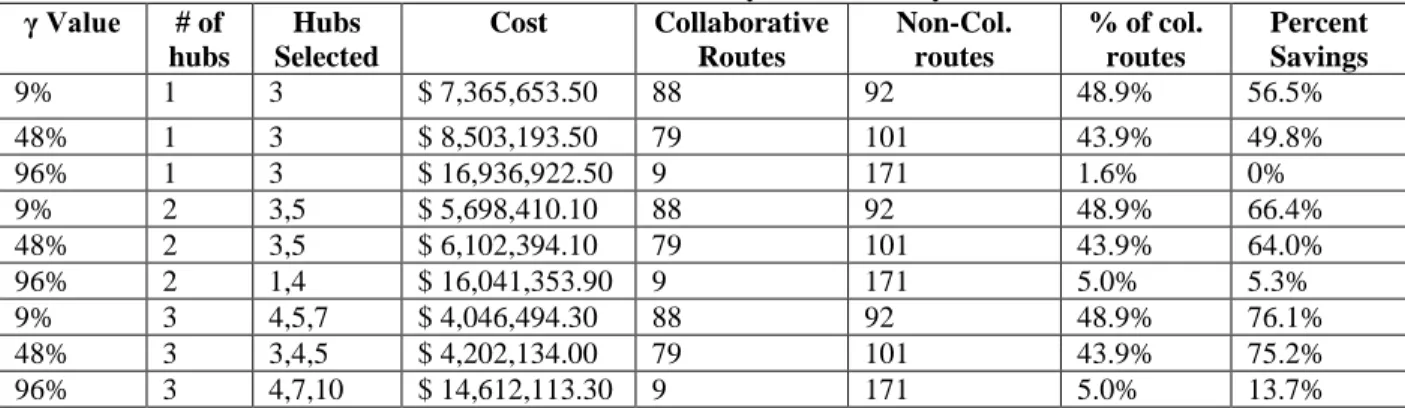
In the genetic algorithm,an initial population of 100 will be considered, running the algorithm for 200 iterations with a 10% elitism, a mutation factor of 10%, and considering a δ of 10% and values for γ of 9%, 48%, and 96%. The results of these tests in terms of γ, # of hubs, Total Cost, number of collaborative and non-collaborative routes, percentage of routes picked as collaborative, and relative saving percentages are presented in table 7.
Table 7: Results summary for Case Study 1.1
γ Value # of hubs Hubs Selected Cost Collaborative Routes Non-Col. routes % of col. routes Percent Savings 9% 1 3 $ 7,365,653.50 88 92 48.9% 56.5% 48% 1 3 $ 8,503,193.50 79 101 43.9% 49.8% 96% 1 3 $ 16,936,922.50 9 171 1.6% 0% 9% 2 3,5 $ 5,698,410.10 88 92 48.9% 66.4% 48% 2 3,5 $ 6,102,394.10 79 101 43.9% 64.0% 96% 2 1,4 $ 16,041,353.90 9 171 5.0% 5.3% 9% 3 4,5,7 $ 4,046,494.30 88 92 48.9% 76.1% 48% 3 3,4,5 $ 4,202,134.00 79 101 43.9% 75.2% 96% 3 4,7,10 $ 14,612,113.30 9 171 5.0% 13.7%
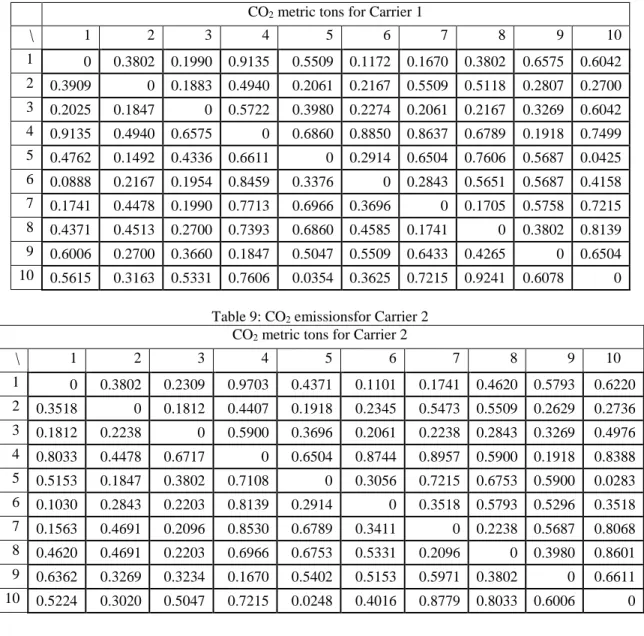
7.2 Case Study 2: Emissions minimization
Considering the data from tables 1 & 2, and the estimated emissions data from tables 8 through 10, we estimated the total tons of CO2emitted by the trucks traveling through the network.This was done by estimating the cost of gas for each route, and calculating the tons of carbon dioxide emitted according to the EPA standard of 8.887*103 metric tons of carbon dioxide for each gallon of gas consumed.
Table8: CO2 emissions for Carrier 1 CO2 metric tons for Carrier 1
\ 1 2 3 4 5 6 7 8 9 10 1 0 0.3802 0.1990 0.9135 0.5509 0.1172 0.1670 0.3802 0.6575 0.6042 2 0.3909 0 0.1883 0.4940 0.2061 0.2167 0.5509 0.5118 0.2807 0.2700 3 0.2025 0.1847 0 0.5722 0.3980 0.2274 0.2061 0.2167 0.3269 0.6042 4 0.9135 0.4940 0.6575 0 0.6860 0.8850 0.8637 0.6789 0.1918 0.7499 5 0.4762 0.1492 0.4336 0.6611 0 0.2914 0.6504 0.7606 0.5687 0.0425 6 0.0888 0.2167 0.1954 0.8459 0.3376 0 0.2843 0.5651 0.5687 0.4158 7 0.1741 0.4478 0.1990 0.7713 0.6966 0.3696 0 0.1705 0.5758 0.7215 8 0.4371 0.4513 0.2700 0.7393 0.6860 0.4585 0.1741 0 0.3802 0.8139 9 0.6006 0.2700 0.3660 0.1847 0.5047 0.5509 0.6433 0.4265 0 0.6504 10 0.5615 0.3163 0.5331 0.7606 0.0354 0.3625 0.7215 0.9241 0.6078 0
Table 9: CO2 emissionsfor Carrier 2 CO2 metric tons for Carrier 2
\ 1 2 3 4 5 6 7 8 9 10 1 0 0.3802 0.2309 0.9703 0.4371 0.1101 0.1741 0.4620 0.5793 0.6220 2 0.3518 0 0.1812 0.4407 0.1918 0.2345 0.5473 0.5509 0.2629 0.2736 3 0.1812 0.2238 0 0.5900 0.3696 0.2061 0.2238 0.2843 0.3269 0.4976 4 0.8033 0.4478 0.6717 0 0.6504 0.8744 0.8957 0.5900 0.1918 0.8388 5 0.5153 0.1847 0.3802 0.7108 0 0.3056 0.7215 0.6753 0.5900 0.0283 6 0.1030 0.2843 0.2203 0.8139 0.2914 0 0.3518 0.5793 0.5296 0.3518 7 0.1563 0.4691 0.2096 0.8530 0.6789 0.3411 0 0.2238 0.5687 0.8068 8 0.4620 0.4691 0.2203 0.6966 0.6753 0.5331 0.2096 0 0.3980 0.8601 9 0.6362 0.3269 0.3234 0.1670 0.5402 0.5153 0.5971 0.3802 0 0.6611 10 0.5224 0.3020 0.5047 0.7215 0.0248 0.4016 0.8779 0.8033 0.6006 0
Table 10: Collaborative CO2 emissions
CO2 metric tons for collaboration between Carriers 1 & 2
\ 1 2 3 4 5 6 7 8 9 10 1 0 0.1155 0.0622 0.3110 0.1652 0.0230 0.0444 0.1297 0.2008 0.1866 2 0.1226 0 0.0515 0.1475 0.0479 0.0764 0.1652 0.1688 0.0870 0.0941 3 0.0622 0.0479 0 0.1866 0.1297 0.0550 0.0622 0.0693 0.1048 0.1652 4 0.3110 0.1546 0.1972 0 0.2292 0.2648 0.2790 0.2186 0.0479 0.2683 5 0.1581 0.0515 0.1226 0.2221 0 0.0870 0.2328 0.2612 0.1901 0.0017 6 0.0195 0.0799 0.0622 0.2577 0.0906 0 0.1013 0.1652 0.1830 0.1190 7 0.0515 0.1652 0.0550 0.2719 0.2292 0.1048 0 0.0515 0.1795 0.2577 8 0.1439 0.1688 0.0764 0.2150 0.2577 0.1688 0.0479 0 0.1226 0.3003 9 0.2079 0.0941 0.1013 0.0479 0.1759 0.1972 0.1972 0.1297 0 0.2186 10 0.1901 0.0906 0.1759 0.2577 0.0017 0.1155 0.2470 0.3145 0.2257 0
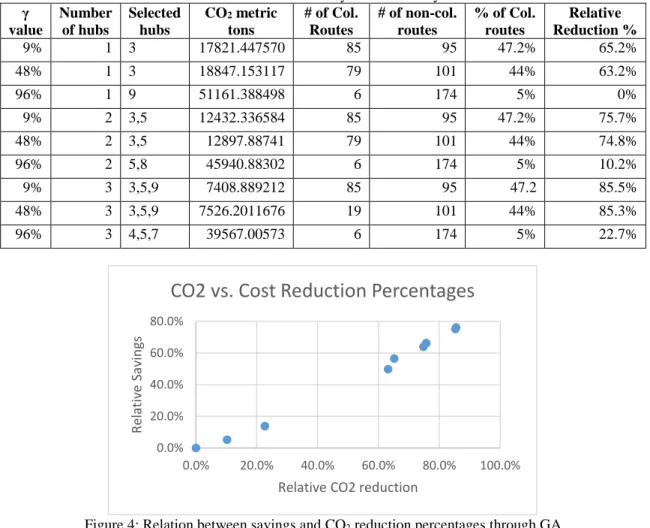
In the genetic algorithm, an initial population of 100 will be considered, running a Genetic Algorithm for 200 iterations with a 10% elitism, a mutation factor of 10%, and considering a δ of 10% and values for γ of 9%, 48%, and 96%. The results of these tests in terms of γ, # of hubs, Total metric tons of carbon dioxide, number of collaborative and non-collaborative routes, percentage of routes picked as collaborative and relative CO2 reduction percentages are presented in table 11 and summarized in Figure 4. As we are considering the emissions by the trucks, the hubs will have no values on this problem.
Table 11: Results summary for Case Study 2.1
γ value Number of hubs Selected hubs CO2 metric tons # of Col. Routes # of non-col. routes % of Col. routes Relative Reduction % 9% 1 3 17821.447570 85 95 47.2% 65.2% 48% 1 3 18847.153117 79 101 44% 63.2% 96% 1 9 51161.388498 6 174 5% 0% 9% 2 3,5 12432.336584 85 95 47.2% 75.7% 48% 2 3,5 12897.88741 79 101 44% 74.8% 96% 2 5,8 45940.88302 6 174 5% 10.2% 9% 3 3,5,9 7408.889212 85 95 47.2 85.5% 48% 3 3,5,9 7526.2011676 19 101 44% 85.3% 96% 3 4,5,7 39567.00573 6 174 5% 22.7%
Figure 4: Relation between savings and CO2 reduction percentages through GA
An important finding is that, in both studies, as the number of hubs in the network increases, so does the relative decrease in cost and emissions, respectively. Inversely, the increase in the minimum expected savings brought a decrease in the actual savings.
7. Conclusions and Future Work
A centralized collaborative carrier multi-hub location problem (CCCMLP) is introduced that provides a planning framework to analyze the benefits of a centralized multiple carrier collaborative network for the creation of hybrid hub-and-spoke system. It addresses the operational issues related to transfer locations and shipment consolidation by introducing the concept of hybrid consolidation hubs from existing locations without the need to construct or invest in new consolidation facility infrastructure. This is done by leveraging the current service locations of existing LTL collaborative carriers, synergized bynew opportunities provided through advances in ICTs and e-commerce. The problem was solved using a Genetic Algorithm. The study results indicated that larger expected profit margins and larger emission reductions from the collaborative carriers would decrease the likelihood of carriers collaborating. In addition, as the network size increases the effect of hybrid hub locational costs was reduced. Also, as the number of hubs increases, there is a reduction in the produced emissions. A direct relation can be observed between the savings and the emission reductions for the same parameters. A key inference of this study is that carrier collaboration in
0.0% 20.0% 40.0% 60.0% 80.0% 0.0% 20.0% 40.0% 60.0% 80.0% 100.0% Re lat iv e Sav in gs
Relative CO2 reduction
terms of a collaborative hybrid hub-and-spoke system can become a critical strategy for small- to medium-sized LTL carriers to remain competitive. That is, by decreasing their operational costs when shipping across a point-to-point network.However, carbon dioxide is not the only emission produced by the burning of fuel. In order to better study these emissions and their effects on the environment, we plan on studying the Global Warming Potential of the trucks.
Acknowledgement
This material is based upon work that is supported by the National Institute of Food and Agriculture, U.S. Department of Agriculture, under award number 2011-38422-30803. Any opinions, findings, conclusions, or recommendations expressed in this publication are those of the author(s) and do not necessarily reflect the view of the U.S. Department of Agriculture.
References
1. Agarwal, R., and Ö. Ergun. Ship Scheduling and Network Design for Cargo Routing in Liner Shipping. Transportation Science, 42(2), 2008, pp.175-196.
2. Agarwal, R., & Ergun, Ö. (2010). Network design and allocation mechanisms for carrier alliances in liner shipping. Operations Research, 58(6), 1726-1742.
3. Anderson, W.P., L. Chatterjee, and T.R. Lakshmanan. E-commerce, Transportation, and Economic. Geography Growth and Change, 34(4), 2003, pp. 415- 432.
4. Boardman, B.S. Real-time Routing of Shipments Considering Transfer Costs and Shipment characteristics. PhD Dissertation. University of Arkansas, 1997.
5. Cunha, C.B., and M.R. Silva. A Genetic Algorithm for the Problem of Configuring a Hub-and-Spoke Network for a LTL trucking Company in Brazil. European Journal of Operational Research. 179(3), 2007, pp. 747-758. 6. Hartmann, S. (1998). A competitive genetic algorithm for resource‐constrained project scheduling. Naval
Research Logistics (NRL), 45(7), 733-750.
7. Hernández, S., and Peeta, S. Less-Than-Truckload Static Single Carrier Collaboration Problem. CD-ROM. Transportation Research Board of the National Academies, Washington, D.C., 2010.
8. Hernandez, S., Peeta, S., and Kalafatas, G. A Less-Than-Truckload Carrier Collaboration Planning Problem under Dynamic Capacities. Transportation Research Part E: Logistics and Transportation Review, 47(6), 2011, pp. 933-946.
9. Hernandez, S., Unnikrishnan, A., &Awale, S. (2011). A less-than-truckload centralized carrier collaboration multi-hub location problem: a hybrid hub-and-spoke network. Transport. Res. Rec. J. Transport. Res. Board, 2263, 20-28.
10.Hernández, S., Unnikrishnan, A., &Awale, S. S. (2012). Centralized Carrier Collaboration Multihub Location Problem for Less-Than-Truckload Industry. Transportation Research Record: Journal of the Transportation Research Board, 2269(1), 20-28.
11.Jones, G., Willett, P., Glen, R. C., Leach, A. R., & Taylor, R. (1997). Development and validation of a genetic algorithm for flexible docking. Journal of molecular biology, 267(3), 727-748.
12.Kuo, A., and E. Miller-Hooks, K. Zhang, and H. Mahmassani. Train Slot Cooperation in Multicarrier, International Rail-Based Intermodal Freight Transport. Transportation Research Record: Journal Transportation Research Board, No.2043, Transportation Research Board of the National Academies, Washington, DC, 2008, pp. 31-40.
13.Mowery, D.C., U.S. Industry in 2000: Studies in Competitive Performance, National Academy Press, Washington, D.C., 1999, pp. 123-151
14.Reeves, C. R. (1995). A genetic algorithm for flowshop sequencing. Computers & operations research, 22(1), 5-13.
15.Song, J., and A. Regan. An Auction Based Collaborative Carrier Network. CD-ROM. CD-ROM. Transportation Research Board of the National Academies, Washington, D.C., 4 2004.
16.Voruganti, A., A. Unnikrishnan, and S.T.Waller. Modeling carrier collaboration in freight networks. Transportation Letters, 3(1), pp. 51-61, 2011.
17.Zapfel, G. and M. Wasner. Planning and Optimization of Hub-and-Spoke Transportation Networks of Cooperative Thrid-Party logistics Providers. International Journal of Production Economics, 78, 2002, pp. 207-220.
Biography
Jose F. Espiritu is an Associate Professor in the Industrial, Manufacturing and Systems Engineering Department at The University of Texas at El Paso. He obtained his MS and PhD degrees in Industrial and Systems Engineering from Rutgers, The State University of New Jersey. His research interests are in the broad areas of quality control and reliability engineering, risk analysis, data mining, renewable energy systems optimization andsustainability engineering. He has been the Principal or Co-Principal Investigator in over $6 million in successful grants from agencies such as The United States Department of Agriculture, The Texas Department of Transportation, The Department of Education and The Department of Homeland Security, as well as funding from private organizations. Dr. Espiritu has published several papers and research reports which have been presented at different national and international conferences.He is a member of the Institute of Industrial Engineers (IIE), the American Society for Engineering Education (ASEE) and the Institute for Operations Research and the Management Sciences (INFORMS).
Eduardo Castillo is an undergraduate student at The University of Texas at El Paso. He is majoring in Industrial Engineering. He began his studies at the Instituto Tecnologico de Santo Domingo, Dominican Republic before transferring to UTEP. His current research concerns Systems Optimization, Supply Chain Management, and Operations Research. HE is a student member of IIE.