Theses and Dissertations
6-30-2016
Contextualizing Classroom Behavior In
Low-Income Children With High Behavioral
Self-Regulation Relative To Peers
Hall Sprott West
University of South Carolina
Follow this and additional works at:https://scholarcommons.sc.edu/etd Part of thePsychology Commons
This Open Access Dissertation is brought to you by Scholar Commons. It has been accepted for inclusion in Theses and Dissertations by an authorized administrator of Scholar Commons. For more information, please [email protected].
Recommended Citation
West, H. S.(2016).Contextualizing Classroom Behavior In Low-Income Children With High Behavioral Self-Regulation Relative To Peers.
with High Behavioral Self-Regulation Relative to Peers
by
Hall Sprott West
Bachelor of Arts College of Charleston, 2004
Master of Arts College of Charleston, 2007
Submitted in Partial Fulfillment of the Requirements
For the Degree of Doctor of Philosophy in
Educational Psychology and Research
College of Education
University of South Carolina
2016
Accepted by:
Kellah Edens, Major Professor
Laura Brock, Committee Member
Matthew Irvin, Committee Member
Kate Niehaus, Committee Member
ii
Acknowledgements
I would like to thank my husband, Raleigh, my children, Scottie and Hugh, my
parents, and other family and friends for supporting me throughout this process. I
would additionally like to thank Laura Brock for her unending support and guidance and
iii
Abstract
This study investigates the home and classroom environments of a subsample of
students (n=16) selected from a participant group of 259 low income students within 4
urban schools in the southeast. The subsample consisted of students who, according to
a direct performance assessment, had higher behavioral self-regulation skills than their
peers yet were reported by teachers as exhibiting undesirable classroom behavior.
Examined as potential contributors to the poor classroom behavior of the students were
home environment characteristics related to stress and child-parent relationships and
classroom environment characteristics which included classroom quality and presence
of chaos. Results indicated that children within the subsample experienced stress in
their home environment and although caregivers reported close relationships with their
children, some also reported relational conflict. In terms of classroom environments,
classroom quality ranged from moderate to low, with most teachers reporting the
presence of chaos within their classrooms. To glean more information, three students
from the subsample were identified for a collective case study. Case study analyses
conducted on observational notes and teacher interviews revealed the following themes
regarding student classroom behavior: lack of motivation, poor peer relations, inability
to control emotions, seeking attention, and instability at home. Discussion focuses on
iv
behavior in the classroom and implications of ecological complexity for teachers and
v
Table of Contents
Acknowledgements ... ii
Abstract ... iii
List of Tables ... vi
Chapter 1: Introduction ... 1
Chapter 2: Literature Review ... 5
Chapter 3: Method ... 15
Chapter 4: Results ... 33
Chapter 5: Discussion ... 51
References ... 64
Appendix A: Summary of Research Questions and Procedures ... 75
Appendix B: HTKS Partial Protocol ... 76
Appendix C: CBRS and SSIS-RS Sample Questions ... 77
Appendix D: Holmes-Rahe Life Stress Inventory Sample Items ... 78
Appendix E: CPRS Sample Items ... 79
Appendix F: LECP (Chaos) Questionnaire Sample Items ... 80
vi
List of Tables
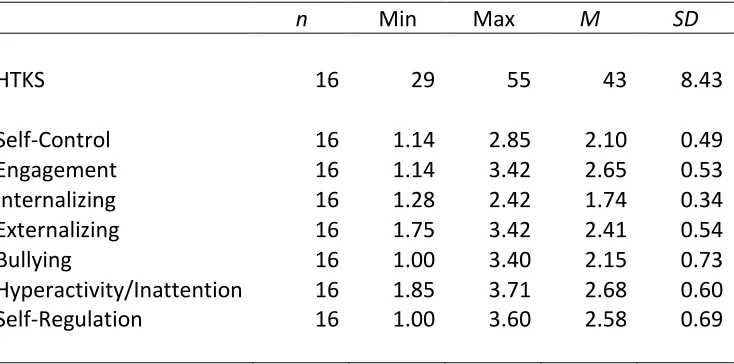
Table 4.1 Means and standard deviations of HTKS and CBRS/SSIS-RS
subscale scores ... 34
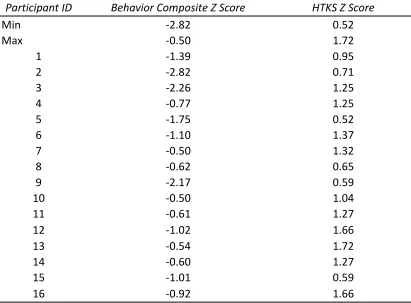
Table 4.2 Subsample standardized scores for the HTKS and CBRS/SSIS-RS measures ... 35
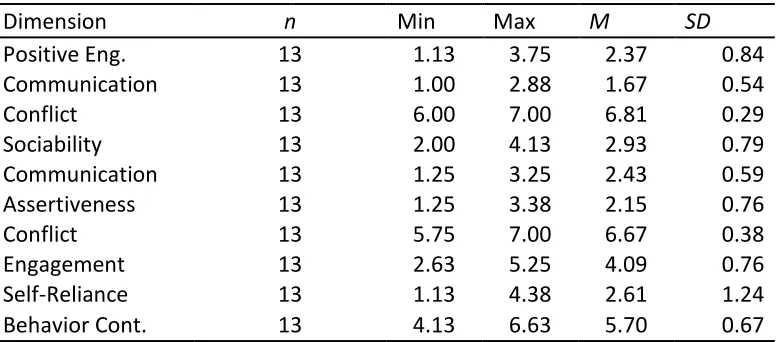
Table 4.3 Subsample inCLASS dimensions means and standard deviations ... 36
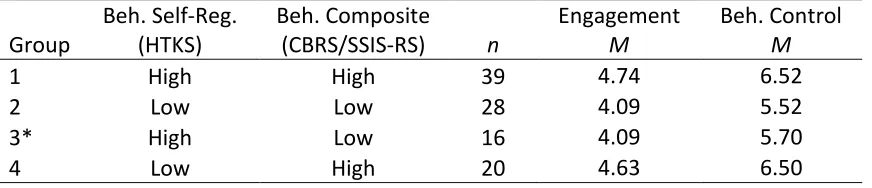
Table 4.4 Comparison group descriptions and inCLASS means ... 38
Table 4.5 ANOVA comparisons of classroom behavior on the inCLASS engagement dimension ... 39
Table 4.6 Tukey HSD comparisons of classroom behavior on the inCLASS engagement dimension ... 39
Table 4.7 ANOVA comparisons of classroom behavior using the inCLASS behavior control dimension ... 40
Table 4.8 Tukey HSD comparisons of groups using the inCLASS dimension of behavior control ... 40
Table 4.9 Holmes-Rahe Life Stress Inventory and CPRS subscale data ... 41
Table 4.10 CLASS dimension means and standard deviations ... 43
Table 4.11 Life in Early Childhood Programs (Chaos) data ... 44
1
Chapter 1
Introduction
Classroom behavior is foundational to academic success in the early years of
schooling (Ladd, Birch, & Buhs, 1999; Normandeau & Guay, 1998; Raver & Zigler, 1997).
Children learn in social contexts where behavioral self-regulation is exerted, requiring
them to pay attention, adapt and comply with given rules and expectations while
navigating social and emotional demands placed on them in the school environment.
Behavioral regulation is essential for successful school functioning and learning, yet
many teachers report that students begin school without this ability (McClelland,
Morrison & Holmes, 2000; Rimm-Kaufman, Pianta, & Cox, 2000). Previous research has
additionally provided that children living in poverty struggle with behavioral
self-regulation in the classroom, acknowledging that poverty-related stressors found in early
environments can negatively influence classroom behavior (Fantuzzo, et al., 2005;
Howse, Calkins, Anastopoulos, Keane, & Shelton, 2003; McClelland, et al., 2000).
Poverty and Schooling
It is well documented that children from low-socioeconomic backgrounds often
enter school less prepared than their more affluent peers, contributing to what is often
termed the achievement gap (Lee & Burkham, 2002; Rouse, Brooks-Gunn, &
2
families at the bottom of the economic spectrum encounter disadvantage in a myriad of
ways: less employment opportunity, reduced accessibility to quality support services
(including daycare), and increased likelihood of living in harsh social environments
(Duncan, 1991; Jargowsky, 1994; Shinn & Gillespie, 1994; Zigler, 1994). These
environmental factors converge to impact children living in poverty in a host of
disadvantageous ways, affecting long-term trajectories by interfering with child
development (cognitive, social, emotional), off-setting chances for academic success in
the early years, and eventually derailing later academic success leading to academic
non-completion and perpetuating a cycle of poverty (McLoyd, 1998).
To illustrate, in a recent report synthesizing data collected from the Early
Childhood Longitudinal Study- Kindergarten Cohort (ECLS-K), the National Education
Longitudinal Study (NELS), and the Baccalaureate and Beyond Longitudinal Study (B&B),
initially high-achieving low-income students were found to be less likely than their more
affluent peers in achieving school success, despite scoring within the top 25percent on
nationally-normed assessments (Wyner, Bridgeland, & Dilulio, 2007). Within this report,
findings indicate that economic disparities influence the number of low-income,
high-achieving students from the earliest start; fewer low-income children perform within
the highest echelon than their higher-income peers at the start of formal schooling
(2007). As elementary school continues, low-income students struggle to remain as
high-achievers and this trend continues through high school (2007). Taken together,
research indicates children living in poverty tend to underperform academically
3
entry. Beyond academic skills, other skills, including behavioral self-regulation are
critical to long-term success in classroom learning environments.
Behavioral Self-Regulation and Schooling
Behavioral self-regulation encompasses a set of skills that allows for successful
classroom functioning including controlling cognition, emotions, and behavior to comply
with the demands of the classroom environment (Baumeister & Vohs, 2004; Shonkoff &
Phillips, 2000). Research has provided that self-regulation is connected to academic
success; a number of studies have shown that strong self-regulation skills predicted
successful classroom behavior and poor self-regulation was associated with maladaptive
classroom behavior (Blair, 2002; Bronson, 2000; Fabes, Martin, Hanish, Anders, &
Madden-Derdich, 2003; Howse, Calkins, Anastopoulos, Keane, & Shelton, 2003;
Shonkoff & Phillips, 2000). Ponitz, McClelland, Matthews, and Morrison (2009) also
found that stronger levels of behavioral self-regulation on a direct assessment in the fall
of kindergarten year predicted higher levels of teacher-reported classroom behavioral
self-regulation.
Underlying behavioral self-regulation is a tripartite of cognitive abilities -working
memory, inhibitory control, and attention- that are subsumed within the term executive
function. Executive function (EF) describes the ability to control, manage, and utilize
working memory, inhibition, and attention in order to fulfill a goal (Blair, 2002). Of
importance, EF is shown to be particularly influential in aiding early learning in school
(Blair & Razza, 2007) as it supports behavioral self-regulation as well as social-emotional
4
referenced as the cognitive processes that underlie behavioral self-regulation. In turn,
behavioral self-regulation refers to the observable behaviors that are attributed to the
cognitive processes incorporated within EF.
Although most research points to a positive relationship between behavioral
self-regulation and successful classroom behavior, this study focuses on a subsample of
children from low-income backgrounds that display poor classroom behavior despite
having high behavioral self-regulation ability relative to peers as evidenced by a direct
assessment of student performance on a task requiring self-regulatory ability. The
characteristics of the students’ home and classroom environments, as assessed through
5
Chapter 2
Literature Review
This research finds footing in Bronfenbrenner’s (1979) Ecological Systems theory,
acknowledging that in order to understand child development and behavior, social and
contextual forces affecting the child and his or her family should also be taken into
consideration. Bronfenbrenner’s (1979) ecology of human development is defined as
follows:
The ecology of human development involves the scientific study of the
progressive, mutual accommodation between an active, growing human being
and the changing properties of the immediate settings in which the developing
person lives, as this process is affected by relations between these settings, and
by the larger contexts in which the settings are embedded (pg. 22).
Therefore, the present study incorporates the notion that “…development never takes
place in a vacuum; it is always embedded and expressed through behavior in a particular
environmental context” (pg. 28).
Bronfenbrenner’s four environmental systems or structures include the
microsystem, the mesosytem, the exosystem, and the macrosystem (Bronfenbrenner,
1979). At its base, the microsystem includes the immediate environments of the child-
the home, the classroom, the family. The mesosystem is described as linkages among
6
family) affects the child in a different microsystem (i.e., the classroom; 1979). The
exosystem includes environments that the child does not directly experience, but events
within it affect the child (for instance, a parent’s place of work) (1979). Finally, the
macrosystem contains social constructs that are related to grander cultural
characteristics. Bronfenbrenner (1994) provides that the macrosystem,
consists of the overarching pattern of micro-, meso-, and exosystems
characteristic of a given culture or subculture, …customs, lifestyles, opportunity
structures, hazards, and life course options that are embedded in each of these
broader systems. The macrosystem may be thought of as a societal blueprint for
a particular culture or subculture (pg. 40).
Therefore, within the macrosystem, beliefs, values, and behavior are passed down that
in turn affects functioning within the other systems (1994).
Bronfenbrenner also acknowledges that ecological transitions or changes over
time, both normative and nonnormative, affect development (1979). He defines this
further: “An ecological transition occurs whenever a person’s position in the ecological
environment is altered as the result of a change in role, setting, or both” (pg. 27).
Examples include gaining a new family member and parental divorce. While this study
does not attempt to identify how ecological transitions affect human behavior, it does
seek to describe environmental influencers that have the potential to shape behavior, in
light of the interconnectedness of the child’s environmental structures. Thus, cognitive
self-7
regulation, are potentially affected by characteristics and events within the child’s
varied environments.
Executive Function, Behavioral Self-Regulation, and Poverty
Executive function (EF) is described as the goal-directed cognitive management
of working memory, inhibition, and attention (Blair, 2002) and functions within the
frontal lobes of the brain (Bronson, 2000). This cognitive skill develops in accordance
with neurobiological development and is shown to be influenced by external factors,
including caregiving environments (Blair, 2002; Bronson, 2000). Of importance, EF is
shown to be particularly influential in aiding early learning in school (Blair & Razza,
2007) as it contributes to self-regulated classroom behavior (McClelland, Cameron,
Wanless, & Murray, 2007).
Research shows that children’s cognitive development, including EF, is negatively
affected by family income and poverty status (McLoyd, 1998). For example, in a
longitudinal study, Raver, Blair, and Willoughby (2013) found that EF was impacted by
both the number of years living in poverty (chronic poverty) and by the financial strain
associated with living in poverty. EF, in turn, has also been studied as a predictor of
academic adjustment in kindergarten and first-grade homeless children (Masten, et al.,
2012). Of significance to the present study, EF influences a child’s ability to remember
relevant information, maintain attention, and inhibit impulses (Raver, et al., 2013); skills
that support the learning process by way of influencing behavioral self-regulation within
8
Behavioral self-regulation, the observable display of EF skills within a social learning
environment, applies the more cognitive skills of EF including attention, working
memory, and inhibitory control to classroom expectations (McClelland, et al., 2014;
McClelland, Cameron, Wanless, & Murray, 2007). Two aspects of behavioral
self-regulation, engagement and behavioral control, have been found to be necessary for
academic success in the early years of schooling (DiPerna, Lei, & Reid, 2007; Fantuzzo,
Bulotsky-Shearer, McDermott, McWayne, & Frye, 2007; Grimm, Steele, Mashburn,
Burchinal, & Pianta, 2010; Howse, Calkins, Anastopoulos, Keane, & Shelton, 2003; Ladd,
Birch, & Buhs, 1999; Sektan, McClelland, Acock, & Morrison, 2010). Children’s ability to
remain engaged and exert behavioral control in the classroom has additionally been
studied as beneficial for achievement throughout elementary school (McClelland, Acock,
& Morrison, 2006) and has been shown to predict literacy, vocabulary, and math skills in
preschoolers (McClelland, et al., 2007). A look towards potential influencers within the
child’s varied environments further illustrates how behavioral self-regulations skills can
be altered in varying contexts.
Home Environment
Stress related to living in poverty has been shown to have a negative influence
on children’s ability to regulate their behavior (Fantuzzo, et al., 2005; Howse, et al.,
2003; McClelland, Morrison, & Holmes, 2000). Howse and colleagues (2003) found that
children from low-income backgrounds had more difficulty regulating their behavior and
remaining engaged when compared to their more affluent peers. Shore (1997) indicates
9
circumstances associated with poverty negatively impact children’s cognitive
development and behavior. Other stressors including household and residential
instability, neighborhood poverty, and crime have also proven to negatively affect
children’s self-regulation (McCoy & Raver, 2014; McCoy, Raver, & Sharkey, 2014; Raver,
et al., 2013).
Stressors associated with living in poverty influence children’s development also
by way of their influence on parents. Parents that encounter chronic stress related to
poverty often exhibit harsher parenting styles (McLoyd, 1990) and are more withdrawn
from their children, both of which are harmful for children’s socio-emotional and
cognitive development (Duncan, Brooks-Gunn, & Klebanov, 1994; McLeod & Shanahan,
1993; McLoyd, Jayaratne, Ceballo, & Borquez, 1994; Nievar, Moske, Johnson, & Chen,
2014). On the other hand, secure parent-child relationships provide an early influence
on children’s ability to regulate behavior (Waters, Weinfield, & Hamilton, 2000). Of
interest, one study found that urban children who encountered multiple stressors were
stress-resilient due to more positive parenting variables including positive parent-child
relationships (Cowen, Wyman, Work, Parker, 1990). A similar study found that children
in nurturing home environments, despite low economic resources, were more prepared
for school in terms of cognitive competence (Nievar, et al., 2014).
Classroom Environment
Although a wealth of research has studied classroom quality and its relation to
academic outcomes (Hamre & Pianta, 2005; Mashburn, et al., 2008), research has also
10
attend to tasks and expectations, and generally exhibit successful classroom behavior.
Hamre and Pianta (2007) contend that interactions between the teacher and students
within the classroom environment provide a lens with which to observe classroom
quality. Hamre and Pianta (2005) divide classroom quality into three parts: emotional
support, classroom organization, and instructional support. Emotional support assesses
the degree to which teachers and students exchange warm and positive social
interactions, captures negativity present in the social environment, the degree to which
the teacher is sensitive to the needs of the students, and the teacher’s efforts in
supporting and valuing student perspectives. Classroom organization targets the
manner in which behavior is managed within the classroom, how productive the
classroom is, and the degree to which the teacher facilitates student interest and
engagement within the context. Lastly, instructional support considers how well the
teacher promotes higher-order thinking skills, the presence and quality of feedback
within the learning environment, and the emphasis placed on language modeling.
Aspects of emotional support have been shown to predict student engagement
in the classroom (Bryant, et al., 2002; NICHD ECCRN, 2002, 2005). One study showed
that preschool students were more engaged in classrooms with more responsive
teachers (McWilliam, Scarborough, & Kim, 2003), whereas another study found that
students in classrooms with more controlling teachers were less engaged (de Kruif,
McWilliam, Ridley, & Wakely, 2000).
Well-structured and organized classrooms also have the potential to encourage
11
Nathanson, and Brock (2009) found that classroom organization (productivity, effective
and proactive behavior management practices, and teacher facilitation) was effective in
eliciting student engagement, as well as behavioral and cognitive control. Alternatively,
the presence of classroom chaos and disorganization may contribute to lower levels of
behavioral self-regulation as studied in preschool classrooms (Wachs, Gurkas, & Kontos,
2004).
Additionally, aspects of instructional support have also been linked to student
engagement in elementary school classrooms. Dolezal, Welsh, Pressley, and Vincent
(2003) found that third-grade teachers who encouraged students to think deeply,
complete complex and cognitively challenging tasks, promoted student collaboration,
and offered feedback had more academically engaged students. Bogner, Raphael, and
Pressley (2002) had similar findings in their study of first-grade teachers during literacy
activities; those teachers that promoted creative and independent thinking, provided
effective feedback and challenging content, and promoted teacher-student and
student-student interactions had the most student-student engagement within their classrooms.
However, data from the National Center for Early Development and Learning’s
(NCEDL) Multi-State Study of Pre-Kindergarten incorporating 730 kindergarten
classrooms and consisting of 50.3% low-income children described kindergarten
classroom quality as only moderate (La Paro, et al., 2009). Using an observational tool
assessing teacher-student interactions within classroom environments across six states,
emotional support and classroom organization were found to be of moderate quality
12
schools serving mostly low-income children, classrooms were considered to be more
negative and the instruction to be focused on rote knowledge within didactic teaching
practices compared to national norms (Stipek, 2004). Taken together, previous research
evaluating the influence of home (i.e., stress, parent-child relationships) and classroom
environment factors (i.e., classroom quality, chaos) on behavioral self-regulation ability,
along with findings supporting the importance of behavioral self-regulation ability for
successful classroom functioning (e.g., Blair, 2002; Bronson, 2000; Fabes, et al., 2003;
Howse, et al., 2003; Ponitz, et al., 2009; Shonkoff & Phillips, 2000), provided the basis
for this study.
The Present Study
The present study identifies a sample of children from socio-demographically
at-risk backgrounds who have undesirable classroom behavior despite high behavioral
self-regulation ability relative to peers and describes potential contributors to their
classroom behavior. I examined three initial research questions:
1. Among the larger sample of low income children, what is the prevalence of
children who demonstrate high behavioral self-regulation relative to peers in
a direct assessment, but display poor classroom behavior?
2. What are the characteristics of the home environment for children exhibiting
poor classroom behavior but high behavioral self-regulation?
3. What are the characteristics of the classroom environment for children
13
In regards to the home environment context (Q-2), I hypothesized that children
identified as having poor classroom behavior, despite high behavioral self-regulation
ability relative to peers as evidenced by a direct assessment, encounter multiple
stressors at home and experience conflict and minimal closeness with parents. This
expected outcome acknowledged previous research showing that stress and
child-parent conflict can impact behavior and self-regulation skills (Fantuzzo, et al., 2005;
Howse, et al., 2003; McClelland et al., 2000; Waters, Weinfield, & Hamilton, 2000). In
regards to the classroom context (Q-3), I predicted that classroom quality would be low
and learning environments would often be characterized as chaotic. This expected
outcome acknowledged previous research showing that children are more engaged and
exert cognitive and behavioral control in classrooms that are warm, well-organized, and
academically stimulating (Bogner, Raphael, and Pressley, 2002; McWilliam,
Scarborough, & Kim, 2003; Rimm-Kaufman, et al., 2009).
For a subset of the participant sample exhibiting the poorest classroom behavior
relative to others in the subsample during a standardized classroom observation later in
their first and second grade years (low observed behavioral control and engagement), I
looked further into student classroom behavior by posing two additional research
questions that afforded a more contextualized view of student-level classroom
behavior:
4. What are teacher perceptions of the student’s classroom behavior?
14
Research questions in the present study focus on describing the home and
classroom environments of a subsample of students that had the unlikely combination
of high behavioral self-regulation relative to peers, but poor classroom behavior
according to teacher report. This was done in order to illuminate potential contextual
influencers that may undermine the expression of behavioral self-regulation skills
needed for positive classroom behavior.
Significance of the Present Study
This research study identifies children that display poor classroom behavior
despite high behavioral self-regulation ability relative to peers. The findings from it,
therefore, provide information about students that lie at behavioral self-regulation
extremes and display behavior that is counter to what most research portends in
regards to the positive relationship between high behavioral self-regulation skills and
subsequent classroom behavior (e.g., Blair, 2003; Ponitz, et al., 2009). The basis for this
line of inquiry is supported by Hinde’s (1998) contention that within larger samples,
subgroups of students that may be special or extreme are misunderstood or even lost.
Therefore, studying sub-groups that exhibit behavior that is not typical can contribute
information that may, in other studies with larger samples, be obscured or overlooked.
In so doing, this study seeks to identify potential influencers that may impede
behavioral self-regulation ability in the classroom for a subsample of students who have
high behavioral self-regulation ability relative to peers in a direct assessment so that
practical measures may be taken to help mitigate these influencers and help ensure
15
Chapter 3
Method
This study uses a mixed methods design, incorporating quantitative measures to
select the subsample, compare the subsample to other groups of students, describe
home environments, and describe classroom environments. This study also uses
qualitative measures to focus on three students within the subsample in order to more
fully understand student classroom behavior and potential influencers within the
natural classroom context. The choice of this study design acknowledges the work of
Johnson and Onwuegbuzie (2004) who contend that both quantitative and qualitative
research are valid and in combining the two, the strengths of both may be amplified and
the weaknesses of both may be lessened.
Participants
Participants were 259 kindergarten students who were recruited for a larger
study evaluating the effectiveness of an after-school program that promotes social and
emotional learning for at-risk elementary school children. The participants attended
four elementary schools and were within two cohorts. Each child within the larger study
was assigned a condition at kindergarten entry (i.e., treatment, control) and all students,
regardless of condition, were eligible to participate in this research study. Out of those
selected for the subsample to answer research question 1, five students (31%) received
16
All study participants (N=259) attended public Title I elementary schools in the
southeast during the 2012-2013 and 2013-2014 school years. Most of the children were
girls (53.5%) and were between 4.82 and 6.38 years of age at kindergarten entry. Nearly
all of the children had attended preschool before the kindergarten year (89.7%).
In terms of parental education, 93 reported having a high school diploma or
equivalent, 48 had some college without a degree, and 47 had some high school, but did
not have a diploma. Most caregivers were African American (87.65%). Forty-nine
teachers participated in the larger study. Teachers on average had 12.5 years of
teaching experience (range = 0-49 years). Most teachers were white (77.6%) and 20.4%
were African American. Twenty-four (49%) of the teachers had received a master’s
degree and 15 (30.6%) had received a bachelor’s degree at the time of the study.
Subsample participants (n=16) selected from the larger sample of students
consisted of 13 girls and 3 boys and were between 4.90 and 5.55 years of age at
kindergarten entry. Fifteen of the subsample participants had attended preschool prior
to the start of kindergarten. Parents or primary caregivers of the subsample children
were mostly African American (n=15). In terms of parental education, 5 reported having
some high school without a diploma, 5 had received a high school diploma or
equivalent, 4 had some college without a degree, 1 had a high school diploma plus
technical training, and 1 had an Associate’s or two-year degree. Teachers of the
subsample students (n=7) had on average 9.6 years of teaching experience (range= 2-30
17
degree; one subsample teacher had received one year of coursework beyond a
Bachelor’s degree.
Three students from the subsample were selected for more detailed analysis as
case study participants. They were selected based upon observed low behavioral control
and engagement observational scores (.5 standard deviation below subsample peers)
and were assessed later in their first and second grade years during the 2014-2015
school year (first grade, n=1; second grade, n=2). All case study participants were female
and all were African American.
School Context
All four elementary schools are within one district in a state in the southeast. The
district covers a large expanse of land (approximately 1,000 square miles) and
incorporates a blend of urban, suburban, and rural areas. On the most recent district
report card, the district received an overall rating of excellent, the highest rating it had
received to date (S.C. Annual Report Card, 2014).
The district is geographically divided into four zones: North, Central, East, and
Southwest. Two of the elementary schools in the study are within the North Zone of the
district in an area with 23% of the population living below the poverty line (U.S. Census,
2013); this is higher than regional (county (18%), state (19%)) and national percentages
(15%). The other two schools are in a neighboring city, within the Central Zone of the
district; this area has 20% of residents living in poverty (2013).
School 1 is a Title I school with 98% of the student population living in poverty
18
state assessments and on the most recent school report card, the school had an
absolute rating of below average with an Elementary and Secondary Education Act
(ESEA) index score well below that of state expectations (29.1 (F); S.C. Annual School
Report Card, 2014d). School 1 is also considered a Title I Priority School which
designates it as one of the lowest performing Title I schools (2014d).
School 2 is also located in the north area of the district and had an absolute
rating of below average on the 2014 state report card with an ESEA index score slightly
higher than that of School 1, but still considered below state expectations (52.8 (F); S.C.
Annual School Report Card, 2014a). School 2 also has a very high percentage of students
living in poverty (99%; S.C. Department of Education, 2014).
School 3 is located within the Central Zone of the district with 93% of the student
population living in poverty (S.C. Department of Education, 2014). The most recent
report card also gave school 3 an absolute rating of below average with an ESEA score of
64.2 (D), indicating that the school’s performance did not meet state standards (S.C.
Annual School Report Card, 2014c).
School 4 is also located within the Central Zone of the district. On the most
recent school report card, school 4 received an absolute rating of below average, with
an at-risk growth rating,and received an ESEA score of 55.3 (F)(S.C. Annual School
Report Card, 2014b).This school, however, has the lowest percentage of students living
in poverty in comparison to the other three schools in this study (79%; S.C. Department
19
Procedures
To identify children with high behavioral self-regulation ability relative to peers,
researchers administered an often-used assessment of behavioral self-regulation ability,
the Head-Toes-Knees-Shoulders (HTKS) direct assessment, to study participants during
the summer of 2013 (prior to first grade for cohort 1, prior to kindergarten for cohort 2).
Teachers assessed children’s classroom behavior using a combined questionnaire, the
Child Behavior Rating Scale (CBRS) and the Social Skills Improvement System-Rating
Scales (SSIS-RS), in the spring of the students’ kindergarten year (spring 2013 for cohort
1, spring 2014 for cohort 2). Researchers also observed children’s behavior within the
classroom environment using the Individualized Classroom Assessment Scoring System
(inCLASS) during the spring of their kindergarten year. This observation focused on the
child’s behavior and consisted of two observations, on differing days, lasting
approximately one hour per observation.
In order to capture home environment characteristics, parents or primary
caregivers completed two portions of a quantitative interview, the Holmes-Rahe Life
Stress Inventory and the Child Parent Relationship Scale (CPRS), in the summer of 2013
(summer before first grade for cohort 1, summer before kindergarten for cohort 2).
To assess classroom characteristics, researchers observed kindergarten
classrooms during the spring (spring 2013 for cohort 1, spring 2014 for cohort 2) using
the Classroom Assessment Scoring System (CLASS). Classrooms were observed two
times by certified observers; each observation period lasted approximately one hour.
20
Life in Early Childhood Programs (LECP) questionnaire during the fall of the participants’
kindergarten year (fall 2012 for cohort 1, fall 2013 for cohort 2).
Students within the subsample (those with high behavioral-self regulation
relative to peers and poor classroom behavior) who had not relocated out of the study
schools by the spring of the 2014-2015 school year were observed by researchers in
their classrooms again using the inCLASS observational tool (second grade for cohort 1,
first grade for cohort 2). This observation focused on the child’s behavior and consisted
of two observations, on differing days, lasting approximately an hour per observation.
Out of the inCLASS student behavior observations during the 2014-2015 school
year, three case study participants were selected for further qualitative analysis based
on scores assigned for behavior control and engagement (.5 standard deviation below
subsample scores). After standardizing engagement and behavior control dimension
scores, three students had scores that fell half a standard deviation below other
subsample students on both dimensions. For those three students, observational notes
taken during student observations were coded and teachers of the case study
participants were interviewed using structured interview protocols lasting
approximately thirty minutes per interview.
Measures
Students’ behavioral self-regulation ability was assessed using a direct
assessment of observed performance on a task and teachers reported children’s
kindergarten classroom behavior through a questionnaire. Children’s classroom
21
was assessed by a parent quantitative interview and the classroom environment was
assessed with an observational measure and a teacher questionnaire. Case study
participants were selected based on observed classroom behavior. Case study
participants were further evaluated using qualitative observational notes and teacher
interviews.
The Head, Toes, Knees, Shoulders task. The Head, Toes, Knees, Shoulders
(HTKS)- Form B Extended task is a game-like assessment for children aged four to eight
years old and requires the student to touch his or her head, toes, knees, and shoulders
when given an opposite command (Cameron & McClelland, 2011). For example, the
student must touch his or her toes when told to touch his or her head and vice versa;
the student must touch his or her shoulders when told to touch his or her knees and
vice versa. In the final stage of the activity, the student must continue to do the
opposite of what is commanded according to a new set of rules, adding complexity to
the task (touch your knees when told to touch your head, touch your shoulders when
told to touch your toes, etc.).
The assessment has a total of 30 commands and the highest score possible is 60.
If the child does not produce the instructed response he/she receives 0 points, if the
child self-corrects his response, he/she receives 1 point, and if the child correctly
responds (meaning touches his toes when told to touch his head), he/she receives 2
points. The alpha coefficient for the present study was .890.
Behavioral self-regulation skills are required to complete this task successfully,
22
attends to changing rules and inhibits impulses to produce the desired response
(Cameron Ponitz, et al., 2008). In a recent study, the HTKS measure was found to be
significantly related to measures of cognitive flexibility, working memory, and inhibitory
control for young children (kindergarten and pre-kindergarten) (McClelland, et al.,
2014). Through this study, the HTKS measure had convergent validity with the
Dimensional Change Card Sort (DCCS) measuring cognitive flexibility, the Auditory
Working Memory test within the Woodcock-Johnson III- Tests of Cognitive Abilities
measuring working memory, and two tests of inhibitory control (Day-Night Stroop task,
Simon Says task); all showing significance at =.001 (2014).
Teacher questionnaire.The teacher questionnaire consisted of a scale that
determined student classroom behavior. This questionnaire was a combination of the
Social Skills Improvement System-Rating Scales (SSIS-RS; Gresham & Elliott, 2008) and
the Child Behavior Rating Scale (CBRS; Bronson, Goodson, Layzer, & Love, 1990) and
assessed the child regarding his or her social competence and problem behaviors in the
classroom.
The SSIS-RS is an updated version of the Social Skills Rating System (SSRS) and is
considered a psychometrically sound measure in assessing student behavior and skills
(Gresham & Elliott, 2008). Gresham and colleagues (2011) have found high internal
consistency within subscales on the SSIS-RS (self-control (α = .90); problem behavior
composites (internalizing, externalizing, and hyperactivity; α = .95)) from elementary
school teacher reports in addition to significant correlations with its predecessor (SSRS).
23
measure (Bronson, Tivnan, & Seppanen, 1995; Matthews, Cameron Ponitz, & Morrison,
2009; McClelland et al., 2007). Bronson (1994) also reports significant positive
correlations with teacher reports of student self-control (r = 0.43).
The combined SSIS-RS and CBRS measure consists of 48 questions that the
teacher must answer using a range of responses indicating how often a particular
behavior occurs (1=never, 2= seldom, 3=often, and 4=almost always). Example items
include, “Returns to unfinished tasks after interruption,” “Responds to instructions and
then begins an appropriate task without being reminded,” “Has temper tantrums,” and
“Disobeys rules or requests.” Items within the combined measure were aggregated into
seven behavior subscales: self-control (α = .952), engagement (α = .940), internalizing
problem behavior (α = .844), externalizing problem behavior (α = .949), bullying (α =
.917), hyperactivity/inattention (α = .898), and self-regulation (α = .964).
Individualized Classroom Assessment Scoring System. The Individualized
Classroom Assessment Scoring System (inCLASS; Downer, Booren, Hamre, Pianta, &
Williford, 2011) is an observational measure focused on individual students within the
classroom setting and targets the child’s interactions with agents (teachers, peers, task)
within the environment. Downer and colleagues (2010) report small to moderate
correlations with a number of other validated teacher report measures.
The inCLASS is organized into four domains: teacher interactions (α = .931), peer
interactions (α = .978), task orientation (α = .822), and negative engagement (α =.995).
Within the teacher interactions domain, two dimensions guide the observation: positive
24
dimensions structure the observation: sociability, communication, and assertiveness.
Within the task orientation domain, the child is assessed on his or her level of
involvement with the task at hand through the dimensions of engagement and
self-reliance. Finally, the negative engagement domain incorporates three dimensions:
teacher conflict, peer conflict, and behavior control. Students are assessed on a scale of
1 to 7; a score of 1 provides that the behavioral indicators for a given dimension are
rarely observed and a score of 7 provides that the behavioral indicators are often and
consistently observed throughout the observational cycle. Observational cycles lasted
for fifteen minutes, and consisted of four ten-minute observational cycles followed by
five minutes for coding.
The Holmes-Rahe Life Stress Inventory. The Holmes-Rahe Life Stress Inventory
(Holmes & Rahe, 1967) is a 37-item list of statements that the parent must acknowledge
with a yes or no regarding whether or not a given personal life event occurred within
the past year. Example items include, “Major personal injury or illness,” “Major change
in the health or behavior of a family member,” “Detention in jail or other institution,”
and “Eviction.” This measure acted as a checklist for caregivers to denote which, if any,
stressful life events occurred so that frequencies could be aggregated.
The Child-Parent Relationships Scale. TheChild-Parent Relationship Scale (CPRS;
Pianta, 1992) is a 15-item scale that focuses on the quality of relationship between the
primary caregiver and the child. Pianta (1992) reports high alpha coefficients for its
closeness (α = .72) and conflict subscales (α = .83). Example items on the measure
25
becomes angry with me,” “Dealing with my child drains my energy,” and “My child
spontaneously shares information about himself/herself.” The caregiver may respond to
statements in seven ways (1: Definitely does not apply, 2: Not really, 3: Neutral: Not
sure, 4: Applies somewhat, 5: Definitely applies, Don’t know, and Prefer not to answer
(refuse)). Items within the CPRS measure for the present study were aggregated into
two subscales: conflict (α = .749) and closeness (α = .511).
Classroom Assessment Scoring System. Classroom environments were assessed
using the Classroom Assessment Scoring System (CLASS, K-3; Pianta, La Paro, & Hamre,
2008). The CLASS is an often-used and psychometrically-valid measure that assesses
classroom quality using three domains: emotional support, classroom organization, and
instructional support. CLASS scores have been associated with another measure of
classroom quality, the Early Childhood Environment Rating Scale (ECERS), with a
particularly strong association between the CLASS domain of emotional support and the
ECERS interactions factor (2008).
The CLASS focuses on the three domains to provide a wealth of information
regarding the nature of interactions within the learning environment. The emotional
support domain (α = .855) encompasses the following dimensions: positive climate,
negative climate, teacher sensitivity, and regard for student perspectives. The classroom
organization domain (α = .796) targets the management and organizational
characteristics of the classroom environment. Dimensions within this domain include:
behavior management, productivity, and instructional learning formats. Finally, the
26
learning process. The dimensions within the instructional support domain include:
concept development, quality of feedback, and language modeling. Dimensions are
coded between 1 and 7. Low (1,2), mid (3,4,5), and high (6,7) codes reflect the
presence, frequency, and consistency of the observed indicators, with high scores
representing high quality. Given behavioral indicators support the dimensions within
each of the three domains.
Life in Early Childhood Programs Questionnaire. In addition to the CLASS
observational measure, teachers reported the level of chaos they felt characterized their
classroom using the Life in Early Childhood Programs questionnaire (LECP (Chaos);
Kontos & Wachs, 2000; Wachs, Gurkas, & Kontos, 2004). This classroom chaos measure
is a revised version of the Confusion, Hubbub, and Order Scale used for assessing home
environmental chaos (Matheny, Wachs, Ludwig, and Phillips, 1995). Ponitz and
colleagues (2009) have previously used the measure alongside the CLASS domain of
classroom organization to predict gains in student literacy within first grade classrooms.
This 16-item questionnaire consists of statements to which the teacher replies
with a yes or no indicating his or her agreement with the given statement. Example
items include, “No matter how hard we try, we always seem to be running late,” “There
is often fuss going on in our classroom,” and “You can’t hear yourself think in our
classroom.” The alpha coefficient for the chaos measure was .631.
Case study participant observation notes. For all participants, observational
notes were taken in order to code behaviors on the inCLASS measure protocol.
27
analyzed and coded in order to provide a more thorough description of student
behavior.
Case study teacher interviews. For case study participants, structured interviews
were conducted to understand teacher perceptions regarding individual student
behavior in the classroom. The interview was conducted at the school, after school
hours and consisted of 16 questions. Example questions included, “When thinking about
the student in the classroom, how would you describe his/her ability to attend (pay
attention to, stay engaged) to activities throughout the day?” and “What
classroom/school circumstances affect his/her ability to be patient, follow expectations,
and respect other students’ personal space?” Appendix A provides a summary of the
research questions, measures, and procedures.
Data Analysis
Analyses identified children who had behavioral self-regulation ability and poor
classroom behavior (subsample participants), compared subsample participants to other
groups of students with dissimilar scores on the direct assessment and teacher-report
measure of classroom behavior, assessed individual classroom behavior, as well as
provided an overall picture of the subsample’s home and classroom environments. All
statistics were computed with the Statistical Package for the Social Sciences 22 (SPSS).
Qualitative analyses were conducted to target individual classroom behavior as well as
teacher perceptions of child behavior for the three case study participants selected from
28
Out of the larger pool of participants (N=259), direct assessment scores (HTKS)
and teacher report measures of classroom behavior (CBRS/SSIS-RS) were first analyzed
for research question 1. This research question focused on identifying the number of
students out of the larger sample that had high behavioral self-regulation ability relative
to peers as well as undesirable classroom behavior. Direct assessment raw scores were
used to determine behavioral self-regulation ability (sum points out of 60). Those scores
were standardized to determine the highest performing students in terms of behavioral
self-regulation ability among their peers. Participant scores on the subscales within the
CBRS and SSIS-RS were standardized and combined to create a behavior composite
score. Standardized scores were used to identify participants with the poorest
classroom behavior among their peers according to teacher report. Subscales included
self-control, engagement, internalizing behavior, externalizing behavior, bullying,
hyperactivity, and classroom self-regulation. Participants whose scores were
approximately half a standard deviation above others on the direct assessment of
behavioral self-regulation (HTKS) as well as a half a standard deviation below others on
the teacher reported student classroom behavior measure (CBRS/SSIS-RS) were
identified for research question one; those identified were the subsample of interest
and analyses done on the home and classroom environments focused on this subsample
of students.
By converting students’ raw scores to standardized scores, I was able to compare
students’ performance on the behavioral self-regulation task (HTKS) and teacher report
29
in a selection of participants that outperformed approximately 70% of their peers on the
direct assessment and had poorer classroom behavior than approximately 70% of their
peers assessed by teacher report (Fraenkel & Wallen, 2009). Previous studies have used
this technique in identifying students considered above average (.5 standard deviation
or higher) and below average (.5 standard deviation or lower; see Irvin, 2012; Farmer, et
al., 2002).
To compare the subsample students to other students in terms of observed
classroom behavior,individual behavior in the kindergarten context was assessed using
an observational measure (inCLASS); dimension codes taken from both days of
observation were averaged to provide a picture of individual classroom behavior for the
targeted participants. Data collected on the inCLASS during the participants’
kindergarten year represents 81% of the subsample participants; three of those selected
for subsample analyses had relocated out of the study schools by the spring of their
kindergarten year.
In order to evaluate the uniqueness of the subsample of students that were of
primary interest in this study (those with high behavioral self-regulation relative to
peers and poor classroom behavior), the subsample’s scores on the inCLASS
observational dimensions of engagement and behavior control derived from student
observations during the kindergarten year were compared to the scores of three other
groups of students: (a) students who had high behavioral self-regulation relative to
peers and positive classroom behavior, (b) students who had low behavioral
30
behavioral self-regulation relative to peers and positive classroom behavior. These
additional groups were selected in the same manner as the primary subsample using the
HTKS task to evaluate behavioral self-regulation ability and the teacher questionnaire of
student classroom behavior assessed by the combined CBRS/SSIS-RS. To be selected for
the comparison groups, students with high behavioral self-regulation ability relative to
peers were those that had standardized scores on the HTKS that were half a standard
deviation above others or greater; students with low behavioral self-regulation ability
relative to peers were those that had standardized scores on the HTKS that were half a
standard deviation or lower below others. Students who had positive classroom
behavior relative to peers had behavior composite standardized scores derived from the
teacher-reported measure (CBRS/SSIS-RS) that were half a standard deviation or more
above others; students with poor classroom behavior relative to peers had behavior
composite standardized scores that were half a standard deviation or lower below
others. In order to compare group scores on the inCLASS dimensions of engagement and
behavior control, a one-way analysis of variance (ANOVA) was used.
To describe the characteristics of the home environment (Q-2), the subscales of
conflict and closeness within the parent report CPRS measure were averaged for
subsample participants selected from research question one (those with high behavioral
self-regulation ability relative to peers and poor classroom behavior). Additionally,
frequencies and means were aggregated for the responses on the Holmes-Rahe Life
31
To describe the characteristics of the classroom environment (Q-3), classroom
quality was assessed by examining dimension codes taken from both days of
observation for classrooms that contained the subsample participants using the CLASS;
codes were averaged to provide information regarding the classroom environment
during the kindergarten year. In order to measure teacher-reported chaos in the
classroom, sums were aggregated per teacher for the teacher-report LECP (Chaos)
measure. Positive codes were reverse-coded so that higher sums represented higher
levels of classroom chaos.
Classroom-level data were collected on those teachers with subsample
participants in their classrooms. This consisted of 7 teachers, however one teacher had
subsample students from both cohorts and therefore was observed in two consecutive
years. Therefore, the analyses of classroom environments focused on 8 classrooms but
with only 7 teachers.
To select case study participants within the subsample, individual behavior was
again observed and assessed using the inCLASS during the 2014-2015 school year. The
dimension codes taken from both days of observation were averaged to provide a
current picture of classroom behavior. Dimension averages were then standardized to
identify those participants with the poorest classroom behavior as evidenced by their
scores on engagement and behavior control dimensions within the inCLASS
observational measure (out of those remaining in the study schools during the
32
peers on the engagement and behavior control dimensions were selected for further
study (n=3).
To analyze teacher perceptions of case study participants’ classroom behavior
and specific classroom behaviors the case study participants engage in (Q-4, Q-5),
qualitative analyses were conducted on interviews with the teachers of the case study
participants and on participant observation notes in line with what Stake (2000)
identified as cross-case analysis within a collective case study. After interviews were
recorded, the text was transcribed. Interview transcripts and hand-written
observational notes were read and re-read to develop initial codes, categories, and
themes based on the data and in consideration of the research questions (Glesne,
1999). Initial codes included on- and off-task behavior, interaction with peers (positive,
negative), individual characteristics (motivation, academic ability, emotional regulation,
behavior control), interactions with the teacher (positive, negative), and family/home
life. Themes were then created based on the codes and related data across the case
33
Chapter 4
Results
Students with Behavioral Regulation Ability and Poor Classroom Behavior
By comparing students’ direct assessment scores with teacher-reported accounts
of student classroom behavior, 16 kindergarten students were identified as having poor
classroom behavior despite exhibiting high behavioral self-regulation skills relative to
peers in a direct assessment. This represents 6% of students from the larger sample.
Table 4.1 shows means and standard deviations of the raw scores on both measures.
These raw scores show that there was variation in the direct assessment scores (M=43,
min=29, max=55, SD= 8.43) with a mean reflecting moderate to moderate-high
performance on the task.
Table 4.1 also shows raw scores per subscale on the teacher-reported measure
of child behavior (CBRS/SSIS-RS) during the students’ kindergarten year. The means for
self-control (M=2.10), engagement (M=2.65), and self-regulation (M= 2.58) all remain
below a 3, reflecting inconsistency in classroom behavior with regards to these targeted
aspects (1= never; 2= seldom; 3=often; 4= almost always). Raw means for problem
behavior subscales (internalizing (M= 1.74), externalizing (M= 2.41), bullying (M= 2.15),
hyperactivity/inattention (M= 2.685)) show that hyperactivity and inattention are the
34
Table 4.2 shows the subsample standardized scores derived from the direct
assessment of behavioral self-regulation (HTKS) and the teacher-reported measure of
student classroom behavior (CBRS/SSIS-RS). The direct assessment (HTKS) z scores
ranged from half a standard deviation above the mean (z= .523) to nearly two standard
deviations above the mean (z= 1.721). The behavior composite z scores from the
teacher-reported measure assessing student classroom behavior (CBRS/SSIS-RS) ranged
from nearly 3 standard deviations below the mean (z= -2.82) to half a standard
deviation below the mean (z= -.50).
Table 4.1Means and standard deviations of HTKS and CBRS/SSIS-RS subscale scores.
n Min Max M SD
HTKS 16 29 55 43 8.43
Self-Control 16 1.14 2.85 2.10 0.49
Engagement 16 1.14 3.42 2.65 0.53
Internalizing 16 1.28 2.42 1.74 0.34
Externalizing 16 1.75 3.42 2.41 0.54
Bullying 16 1.00 3.40 2.15 0.73
Hyperactivity/Inattention 16 1.85 3.71 2.68 0.60
35
Participants’ kindergarten inCLASS scores are shown in Table 4.3. These scores
are an average of the codes attributed to each observational cycle across the two
observation days for each participant. By the spring of the participants’ kindergarten
year, 3 students had relocated to different schools, therefore only 13 participant
observations were available for inCLASS analyses.
Table 4.3 shows the engagement dimension mean of 4.09. This indicates that
participants’ level of engagement throughout the observations was inconsistent. Mid
codes (3, 4, 5) on the inCLASS for the engagement dimension provide that the observed Table 4.2Subsample standardized scores for the HTKS and CBRS/SSIS-RS
measures.
Participant ID Behavior Composite Z Score HTKS Z Score
Min -2.82 0.52
Max -0.50 1.72
1 -1.39 0.95
2 -2.82 0.71
3 -2.26 1.25
4 -0.77 1.25
5 -1.75 0.52
6 -1.10 1.37
7 -0.50 1.32
8 -0.62 0.65
9 -2.17 0.59
10 -0.50 1.04
11 -0.61 1.27
12 -1.02 1.66
13 -0.54 1.72
14 -0.60 1.27
15 -1.01 0.59
36
child was only occasionally able to sustain attention and be engaged with the learning
activities over the course of the observational cycle. This can be compared to a high
range code (6,7) that indicates the child was able to consistently sustain attention and
focus on the activities for the majority of the observational cycle. The range of means
for that dimension (min= 2.63, max= 5.25) also shows that the majority of codes were
within the low to mid-range. Of interest, the behavior control dimension mean is in the
mid-high range (M= 5.70). This indicates that the participants were observed as having
control over their body with respect to the learning environment and others within it
most of the time.
Table 4.3Subsample inCLASS dimension means and standard deviations.
Dimension n Min Max M SD
Positive Eng. 13 1.13 3.75 2.37 0.84
Communication 13 1.00 2.88 1.67 0.54
Conflict 13 6.00 7.00 6.81 0.29
Sociability 13 2.00 4.13 2.93 0.79
Communication 13 1.25 3.25 2.43 0.59
Assertiveness 13 1.25 3.38 2.15 0.76
Conflict 13 5.75 7.00 6.67 0.38
Engagement 13 2.63 5.25 4.09 0.76
Self-Reliance 13 1.13 4.38 2.61 1.24
Behavior Cont. 13 4.13 6.63 5.70 0.67
To evaluate the uniqueness of the subsample students in terms of behavioral
self-regulation ability and subsequent classroom behavior, three additional groups of
students were selected for comparison. Table 4.4 provides descriptions of these
additional groups (groups 1, 2, and 4). Group 1 had standardized scores on the
37
than peers and also had teacher-reported classroom behavior scores (CBRS/SSIS-RS) half
a standard deviation above others (high behavioral self-regulation and high classroom
behavior). Group 2 had standardized scores on the behavioral self-regulation direct
assessment task (HTKS) half a standard deviation or greater below others as well as
teacher-reported classroom behavior scores (CBRS/SSIS-RS) half a standard deviation
below others (low behavioral self-regulation and low classroom behavior). Group 3 is
the subsample and primary group of interest for this study and, as mentioned
previously, had standardized scores on the behavioral self-regulation direct assessment
task (HTKS) half a standard deviation or greater above others as well as
teacher-reported classroom behavior scores (CBRS/SSIS-RS) half a standard deviation below
others (high behavioral self-regulation and low classroom behavior). Finally, group 4 had
standardized scores on the behavioral self-regulation direct assessment task (HTKS) half
a standard deviation below others as well as teacher-reported classroom behavior
scores (CBRS/SSIS-RS) half a standard deviation above others (low behavioral
self-regulation and high classroom behavior). Table 4.4 also shows the inCLASS engagement
and behavior control dimension averages per group. The engagement dimension
averages range from 4.09 to 4.74; the behavior control dimension averages range from
5.52 to 6.52.
38
Table 4.5 shows ANOVA comparisons of observed student behavior within the
inCLASS dimension of engagement. ANOVA comparisons show a significant difference
between groups at the p < .05 level in observable student behavior with regard to the
inCLASS dimension of engagement [F (3,86)=7.37, p=0.00]. In post hoc comparisons,
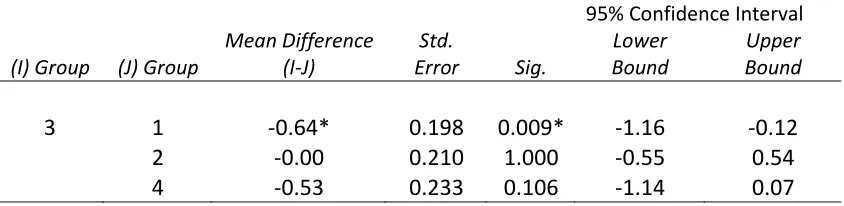
(see Table 4.6) group 3 (high-low) was significantly different from group 1 (high-high),
scoring lower in observed engagement (p < .05). Interestingly, group 3 (high-low) was
not significantly different from group 4 (low-high) in observed engagement, however,
there was a trend towards significance (p =. 106). Additionally, there was no significant
difference between group 3 (high-low) and group 2 (low-low) on observed engagement
indicating that those that performed poorly on the direct assessment measure of
behavioral self-regulation (HTKS) had observed engagement scores on the inCLASS that
were commensurate with those in group 3 (high-low) that performed highly on the
behavioral self-regulation measure.
Table 4.4 Comparison group descriptions and inCLASS means.
Group
Beh. Self-Reg. (HTKS)
Beh. Composite
(CBRS/SSIS-RS) n
Engagement
M
Beh. Control
M
1 High High 39 4.74 6.52
2 Low Low 28 4.09 5.52
3* High Low 16 4.09 5.70
4 Low High 20 4.63 6.50
39 *Significant at the p<.05 level.
*Significant at the p<.05 level.
Table 4.7 shows ANOVA comparisons between groups of observed student
behavior within the inCLASS dimension of behavior control. ANOVA comparisons show a
significant difference between groups at the p<.05 level in observed student behavior
with regard to the inCLASS dimension of behavior control [F (3,86)=16.0, p=0.00]. In post
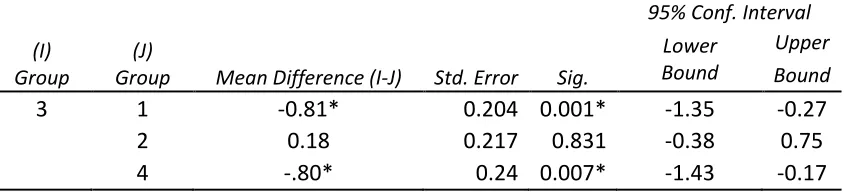
hoc comparisons, Table 4.8 shows that group 3 (high-low) scored lower on observed
behavior control than groups 1 (high-high) and 4 (low-high). In other words, group 3
(high-low) was significantly different from groups 1 (high-high) and 4 (low-high) in terms
of observed classroom behavior control (p<.05). However, group 3 (high-low) was not
significantly different than group 2 (low-low; p=0.831), again indicating that those that
performed poorly on the direct assessment measure of behavioral self-regulation (HTKS) Table 4.5 ANOVA comparisons of classroom behavior on the inCLASS
engagement dimension.
Sum of
Squares df Mean Square F Sig.
Between Groups 8.39 3 2.79 7.37 0.00*
Within Groups 32.63 86 0.37
Total 41.02 89
Table 4.6 Tukey HSD comparisons of classroom behavior on the inCLASS engagement dimension.
95%Confidence Interval
(I) Group (J) Group
Mean Difference (I-J)
Std.
Error Sig.
Lower Bound
Upper Bound
3 1 -0.64* 0.198 0.009* -1.16 -0.12
2 -0.00 0.210 1.000 -0.55 0.54
40
had observed behavior control scores on the inCLASS that were commensurate with
those in group 3 (high-low) that performed highly on the behavioral self-regulation
measure.
*Significant at the p<.05 level.
*Significant at the p<.05 level.
The Home Environment
Data collected from the parent report measures regarding the home
environment of the subsample participants (those with high behavioral self-regulation
relative to peers and low classroom behavior) are shown in Table 4.9. The Holmes-Rahe
data shows that participants’ experiences vary greatly. The range of reported stressful
life events (min= 3; max= 13; SD= 4.02) shows this variability, however, out of the 16
participants, 8 parents/caregivers reported having more than 10 stressful life events
within the past year.
Table 4.7 ANOVA comparisons of classroom behavior using the inCLASS behavior control dimension.
Sum of Squares Df Mean Square F Sig.
Between Groups 19.35 3 6.45 16.00 0.00*
Within Groups 34.65 86 0.40
Total 54.00 89
Table 4.8 Tukey HSD comparisons of groups using the inCLASS dimension of behavior control.
95% Conf. Interval
(I) Group
(J)
Group Mean Difference (I-J) Std. Error Sig.
Lower Bound
Upper Bound
3 1 -0.81* 0.204 0.001* -1.35 -0.27
2 0.18 0.217 0.831 -0.38 0.75