ISSN: 1992-8645 www.jatit.org E-ISSN: 1817-3195
ANALYSIS AND EXPERIMENT OF DYNAMIC
CHARACTERISTICS OF ELECTRONIC DEVICE CHASSIS
HE QING, DU DONGMEI, JIANG XUCHAO
Key Laboratory of Condition Monitoring and Control for Power Plant Equipment, Ministry of Education,
School of Energy Power and Mechanical Engineering, North China Electric Power University, Beijing
102206, China
E-mail: [email protected]
ABSTRACT
During design process of electronic device chassis, dynamic analysis plays a very important role in improving its environment adaptability. After analyzing characteristic of chassis, a finite element model is established and employed. The analysis model and its harmonic responses based on the ANSYS are presented. The reasonable of the finite element model is verified by the experiment results of sweep frequency excitation vibration to typical electronic device chassis used in nuclear power station. Vibration modal analysis shows the weakest location of the chassis.
Keywords: Electronic Device Chassis, Finite Element Model, Vibration Characteristics, Sweep Frequency Experiment
1. INTRODUCTION
Comparing to common electronic equipment, nuclear electronic equipment has a higher request on safety and reliability. The purpose for design the nuclear cabinet is to provide a good, fit environment and it can resist the outside badly environment. In most case, anti-vibration design is one of the critical techniques. Traditional electronic chassis design is based on experience and intuition: firstly, the designers design the initial structure based experience, then the technician verify the model though experience. Obviously, the way not only wastes time but also spend more money. Currently, with developed of computer aided engineering (CAE) technique, designers have changed the way to design production. Recently, CAE software has been made available and practical for using on personal computers; hence, many engineers now use CAE software [1-3]. Its process is like this: firstly, designers design model like traditional way, then production’s computer aided design (CAD) model is imported to CAE software such as ANSYS, NASTRAN, etc. In previous studies, CAE software could analysis the thermal, mechanical dynamics, mechanical static and so on.
The objectives of the study in this paper is
determining that the dynamic characteristic of electronic device chassis is good for usage or not
based on of modeling, harmonic response analysis and sweep frequency experiment.
The remaind arrangement of the paper is as follows. Section 2 describes theory of dynamic analysis of vibration, mode and numerical simulation of chassis is explained in section 3, sweep frequency experment is discussed in section 4, and finally conclusion is given in section 5.
2. THEORY OF DYNAMIC ANALYSIS OF VIBRATION
A modal analysis can determine vibration characteristics of structure [4, 5]. As known, the general equation of vibration is
[M]{ } [ ]{ } [X + C X + K]{ }X ={ ( )}F t (1)
where, [M], [C], [K] is separately mass, damping and stiffness; { }X , { }X ,{ }X ,{ ( )}F t is separately acceleration, velocity, displacement and load of structure.
Assume the motion is free vibrations, and ignore damping
[M]{ } [ ]{ }X + K X =0
Assume the motion is harmonic, substitute and simplify the motion Equ.(1)
2
The harmonic analysis procedure consists of four main steps: (a) build the model, (b) choose analysis type and options, (c) apply harmonic loads and solve, and (d) review results [6-8]. In order to make sure that a given design can withstand sinusoidal loads at different frequencies or to detect resonant response and avoid it, it is necessary to do a harmonic analysis.
3. MODEL AND NUMERICAL SIMULATION OF CHASSIS
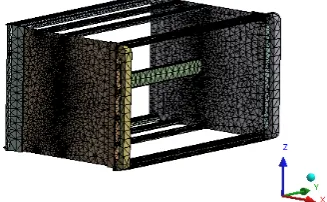
[image:2.612.339.503.611.712.2]The simply 6U nuclear electronic chassis consists of three parts: the printed circuit boards (PCB), beams and front panels. The dimension of the chassis is 427.6×303.68×262.45mm3 with a total weight of about 3.16 kg. The side wall thickness is 1.5mm. The bosses and holes located at beams and boards will be ignored in the simply model. The thread connections are fully constrained in displacement and rotation. As the aim is to analyze the structure of chassis, so the PCB boards will not consider. The three-dimension (3D) model as CAE model is shown in Fig.1. The material of nuclear chassis is Q235. The material properties are listed in Table 1 [3].
Figure 1. Cabinet 3D Model
Table1. Material Properties Of Chassis
Item Properties
Material type Q235
Yield strength (MPa) 345
Allowable stress (MPa) 235
Young’s modulus (GPa) 210
analysis tools, (c) AWE analysis environment, and (d) optimal design: design Xplorer. In order to analysis the model, ANSYS Workbench request factors as follows: verify the materials, mesh setting, number of modes to extract and the solution setting.
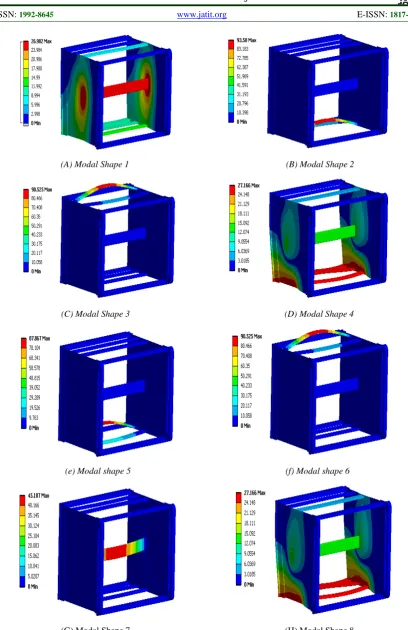
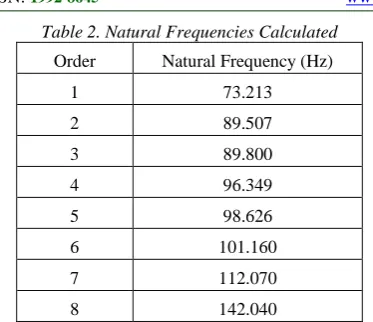
The element model is composed by nodes and elements [9]. Fig.2 shows its CAE structure model. The chassis panel modeled, using Shell63 unit and beams using Beam188 unit. Consider speed of the computer, the grid should not too small. The model in Fig.2 contains 84978 nodes and 45032 units. Select the modal analysis module and applied a fixed handle. This simulation selects load under test conditions as follows: the eight holes and tow holes set aside in the model to do superposition method and extracts the first eight order modals. The analysis takes about 1800 seconds and Fig.3 shows the vibration mode shake. The frequency calculated by the eight models listed in Table 2. Fig.3 shows that the first order mainly correspond to strain of the panels and middle beams while the resonance occurs of other beams from the second to the eight orders. The natural frequency could be changed by changing the structure and materials. So it could avoid the chassis’s resonance phenomenon occurs. The harmonic response input load is displacement and output results are chassis’s stress and strain [8, 9]. According to experimental conditions, the chassis is loaded and constrained as experimental condition. The maximum input displacement is 7 mm and the scope of vibration frequency range is from 5 Hz to 150 Hz.
ISSN: 1992-8645 www.jatit.org E-ISSN: 1817-3195
(A) Modal Shape 1 (B) Modal Shape 2
(C) Modal Shape 3 (D) Modal Shape 4
(e) Modal shape 5 (f) Modal shape 6
[image:3.612.96.505.67.698.2]
(G) Modal Shape 7 (H) Modal Shape 8
7 112.070
8 142.040
The phase-frequency and amplitude-frequency of low-beam are shown in Fig.4. We can find that the maximum amplitude occurs at about 100 Hz which correspond to the fifth-order or six-order of Fig.3.
According the total deformation of the chassis in 100 Hz shown in Fig.5, it can be found the panel and front beams are the weakest place of the structure.
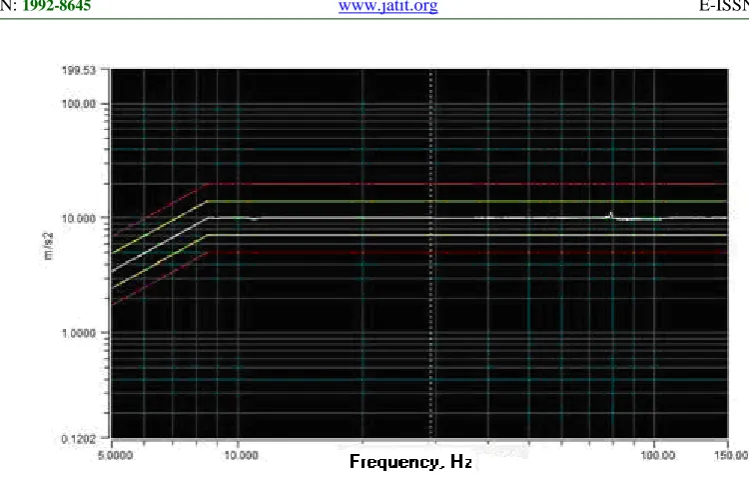
shaking table back to computer. Then the computer will analyze the vibration curve is reasonable or not. The parameters of sweep frequency experiment are listed in Table 3.
[image:4.612.100.287.83.244.2]The amplitude-frequency diagram of sweep vibration test is shown in Fig.7. There is a vibration peak about at 77 Hz which correspond to the first-order in Fig.3. Compared to the diagram, the simulation analysis is reasonable.
Figure 4. Response Curves Of Amplitude And Phase
[image:4.612.103.510.379.706.2][image:4.612.110.502.388.547.2] [image:4.612.103.283.582.705.2]
ISSN: 1992-8645 www.jatit.org E-ISSN: 1817-3195
Table 3. Sweep Frequency Parameters
Items Parameters
Spectrum line 2048
Maximum frequency 2400 Hz
Sweep mode Logarithmic
Sweep speed rate 3 Oct/min
Frequency increment 0.5 Oct
Control way Single-channel
Filter types Proportion bandwidth
Band width 25 %
Compression type Adaptive
Compression ratio Fast
Logarithmic change ratio 20 dB/s
Incremental order 10 %
5. CONCLUSIONS
The finite element method has been to provide a useful and powerful tool for designers to predict the dynamic response of electronic chassis. The simulation constrain conform to experimental conditions. The simulation results will be more accurate when use high-speed computer. Only one direction of the vibration is done in the simulation, the other two directions can be done as the same way. The weakest parts of chassis can be shown through strain cloud map. It provides the basis theoretical for optimize design.
The results of numerical simulation and sweep frequency experiment obtained have provided a way to improve the dynamic characterictic of chassis. This analysis and experiment can be extended to consider more condition as shock during transportation in order to choise a suitable packing method.
REFERENCES
[1] Pan JS, Liang XC, Yan QS, Gao WQ. Modal Analysis of the new type of filtering gear reducer based on ANSYS Workbench. Machine Tool and Hydraulics. 2009; 37(7): 185-187. [2] Lee JH, Lee BS. Modal analysis of carbon
nanotubes and nanocones using FEM. Computational Materials Science. 2012; 51(1): 30-42.
[3] Ooi JB, Wang X, Tan CS, Ho JH, Lim YP. Modal and stress analysis of gear train design in portal axle using finite element modeling and simulation. Journal of Mechanical Science and Technology. 2012; 26(2): 575-589.
[4] Quinn DD. Modal analysis of jointed structures. Journal of Sound and Vibration. 2012; 331(1): 81-93.
[image:5.612.104.479.79.320.2]transmission-line metamaterials. IEEE Transactions on Antennas and Propagation. 2011; 59(5): 1562-1570.
[9] Picard C, Frisson C, Faure F, Drettakis G, Kry PG. Advances in modal analysis using a robust and multiscale method. Eurasip Journal on Advances in Signal Processing. 2010.