ISSN:
2349-7157, volume1 Issue7 July2014
16
Load Distribution of SPR and CSR in Wireless Network
HOD-ECE, Nandha Engineering College, Anna University, India
ABSTRACT: In a wireless network, route travelled by a packet from source to destination usually consist of multiple hops. Routing algorithms are used to find optimal route for each pair of source and destination in a given network. Routing algorithms typically choose the shortest path among all possible routes between source and destination. Taking the shortest path can achieve smallest delay and shortest travelled distance; However this may lead to uneven distribution of traffic load in a network. Under uneven distribution, the center of a network becomes crowded, because shortest paths go through the center rather than through the periphery of a network Circular Sailing Routing (CSR) provides remedy for the above problem as it offers balanced traffic load distribution to the network. CSR maps the nodes on the surface of a sphere and selects routes based on surface distance. This project analyses and compares the load distribution of CSR & SPR under various network traffic for various topologies.
Keywords:CSR,routingalgorithms,SPR,topology
1. INTRODUCTION
In recent years wireless network draw lot of attention due to their potential application in many different areas. They also have many different special characteristics along with some unavoidable limitations when compared with fixed networks.Routing is one of the important featureof wireless network. Several different routing protocols are used for different network applications.Forexample, there are cluster based routing for better scalability, geographical routing to reduce the overhead and power efficient routing for better energy efficiency. There are several load balancing routing protocols which are dynamically adjust the traffic in a route to balance the network traffic based on the knowledge of current load in a network,but these routing protocols are not suitable for large dense wireless network. In this paper, we design the wireless network with different network topologies of various network size(number of nodes in a network).
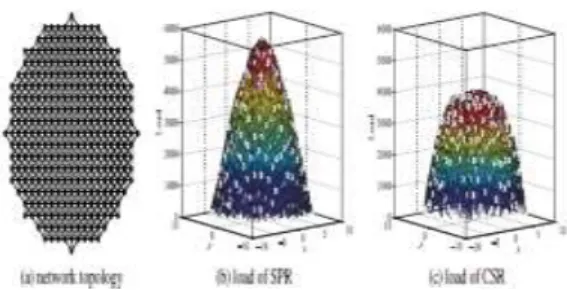
Fig 1: Network topology and load distribution with CSR and SPR
A route traveled bya packet from the source to the destination usually in a dense wireless network consists of multiple hops were intermediate nodes act as relays. To minimize the distance travelled and the total delay experienced by packets, routing algorithms normally choose the shortest path among all possible routes between a source and destination, but Shortest Path Routing (SPR)may lead to uneven distribution of traffic load in a network.
2. CIRCULAR SAILING ROUTING
The main idea of CSR is to map all wireless nodes in a 2D network onto a 3D sphere via reversed stereographic projection. The surface of the sphere is symmetric, there will be no crowded center effect on the spherical surface, if nodes communicate only on the surface and traffic demand is uniformly distributed in the network. A stereographic projection is mapping an infinite plane onto a sphere and vice versa.
Fig 2: Stereographic projection in a 3D sphere and a 2D plane: One-to-one mapping between a node m0 on a sphere S and a node m in a plane.
ISSN:
2349-7157, volume1 Issue7 July2014
Mapping all wireless nodes in a 2D network ontoa 3D sphere via stereographic projection.Nodes communicate on the surface and traffic demand is uniformly distributed in the network. There will be no crowded center effect on the spherical surface. After nodes are mapped onto the surface of a sphere, packets can be routed on the virtual coordinates of nodes on the sphere.
The stereographic projection maps an infinite plane onto a sphere. For a wireless network, the area in which the wireless nodes lie corresponds to a finite region of the plane. Let this region be called P. With the information of the network region, we can place the south poleSof a sphere S at the center of the network, whose coordinate is (0, 0, 0). The radius r of S is an adjustable parameter for our proposed routing method. Here, we assume each node knows the radius r of the projection sphere. This can be done via either a preset before the deployment or a broadcast operation after the deployment. Any point m(x, y, 0) in P maps to m_(x_, y_, z_) on the sphere S. It is a one-to-one mapping, where z_ ≤ k for some 0 < k <2r. Here k is the z_ value of the highest projection on the sphere. The basic idea of circular sailing routing is letting packet follow the circular shortest paths on the sphere instead of the Euclidean shortest paths in 2D plane. Because there is no hot spot on the sphere where most of the circular shortest paths must go through, we expect circular sailing routing can achieve better load balancing than shortest path routing.
2.1 stereography projection
The stereographic projection is a certain mapping that projects a sphere to plane. Imagine that nodes are deployed on the surface of a three dimensional sphere instead of a planar shape.If nodes communicate only on the sphere surface and the communication is uniform.The crowded center effect vanishes due to symmetry.
Fig 3:StereographicProjection
3. TRAFFIC LOAD ANALYSIS OF CSR
There is no theoretical result on load distribution of CSR or CBR. In this section, we give the detail load analysis of CSR in a dense multi-hop wireless network
3.1 Model and assumptions
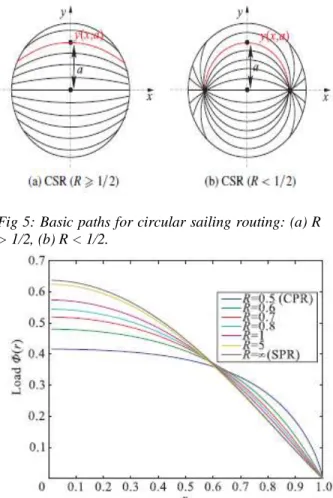
Let us consider a dense wireless multi-hop network with the number of nodes is extremelylarge. Assume that the spatial scales of a typical distance between source and destination and the mean distance between neighboring nodes are strongly separated. With this assumption the routes are modeled as smooth and continuous curves. For example, SPR transmits a packet over a line segment, where CSR transmits over a circular segment. All paths of CSR are on circles in the 2D plane. Let us assume that the network is located in a 2D diskDwith radius one and centered at S.0. Then the total packet generation rate over the network is _ D p2_.r1; r2/./. For a routing method A, its traffic load distribution is denoted as _A.r/ for all r 2 D. For CSR, we assume that the projection sphere S is centered at O.0; 0;R/ with radius R. We assume that R > 1=2. Then the packet arrival rate for a given location r can be defined as _.r. while R < 1=2, the projections of some nodes will surpass the equator to the northern hemisphere. if R > 1=2, the projections of all nodes are located only on the southern hemisphere; When R < 1=2, CSR may cause the following problems for our analysis, The spherical shortest path between projections of two nodes near the boundary of the network may go via the north pole.
Fig 4: Basic paths for (a) shortest path routing and (b) circular path routing.
ISSN:
2349-7157, volume1 Issue7 July2014
18
Fig 5: Basic paths for circular sailing routing: (a) R > 1/2, (b) R < 1/2.Fig 6: Load distribution as the function of the distance r to the center for CSR with different R. Here, _=1.
4. SHORTEST PATH ROUTING
There are several SPR protocols, we consider AODV(ad-hoc on demand distance vector) to compare the load distribution with CSR(circular sailing routing)
4.1 AODV
AODV is a combination of on-demand and distance vector i.e. hop-to-hop routing methodology. When a node needs to know a route to a specific destination it creates a ROUTE REQUEST. Then the route request is forwarded by intermediate nodes which also create a reverse route for itself. When the request reaches a destination with route, it creates a REPLY which contains the number of hops to reach the destination. This route created from each node from source to destination is a hop-by-hop state and not the entire route as in source routing.
All nodes that participate in forwarding this reply to the source create a forward route to destination. The sequence number allows the network to distinguish between recent information and old information. The main feature defining the AODV is the use of routing tables in each node. The routing table is associated to a sequence number and a timer. The timer is to prevent the usage of links whose status is not known for long time.
4.1.1 Route Discovery
The route discovery process is initiated whenever a source needs a route to a destination. Route discovery typically flood of route request (RREQ) packets targeting the destination and waiting for a route reply (RREP). An intermediate node receiving a RREQ packet sets up a reverse path to the source using the previous hop of the RREQ as the next hop. Duplicate copies of the RREQ packet received at any node are discarded. If a valid route to the destination is available, then the intermediate node generates a RREP, else the RREQ is re-broadcast. The RREP is routed back to the source via the reverse path.
4.1.2 Route Maintenance
Route maintenance is done using route error (RERR) packets. When a link failure is detected, a RERR is sent back via separately maintained predecessor links to all sources using that failed link. Routes are erased by the RERR along its way. When a traffic source receives a RERR, it initiates a new route discovery if the route is still needed. Unused routes in the routing table are expired using a timer-based technique.
4.1.3 Packet Dropping
Malicious nodes are dropped by the function of AODV protocol. The cooperation of mobile nodes is critical to the normal operation of multi-hop wireless networks, thus all misbehaviors have prompted open challenges to many issues, such as protocol design, service availability, and topology management, in mobile ad hoc networks. Therefore, we are investigating node behaviors in order to design a general node model so that we can have an in-depth understanding on the evolution of different node behaviors and their impact to network survivability. The modeling and analysis of node behaviors will yield new insights into the analysis and design of resilient wireless multi-hop networks.
ISSN:
2349-7157, volume1 Issue7 July2014
5. SIMULATIONIn this section, we are going to conduct extensive simulations withboth grid and random networks to verify our theoretical results. In bothcases, wireless nodes are distributed in a unit circulararea and a simple unit disk graph propagation modelis used. In CSR, the south pole of the sphere S islocated at the center of the deployment area. The virtualcoordinates of all projection nodes on the sphere arethen generated. We are mainly interested in CSR’s loaddistribution in term of the distance to the center. It isclear that the size of the sphere affects the distributionof the mapped nodes on the sphere, thus affects theperformance. In our simulations, we try different radiiR of the sphere and different network sizes (denoted asn). For all simulations, we compare the load of SPR andCSR under the uniform communication scenario whereevery pair of nodes has unit message to communicate.
5.1 Grid networks
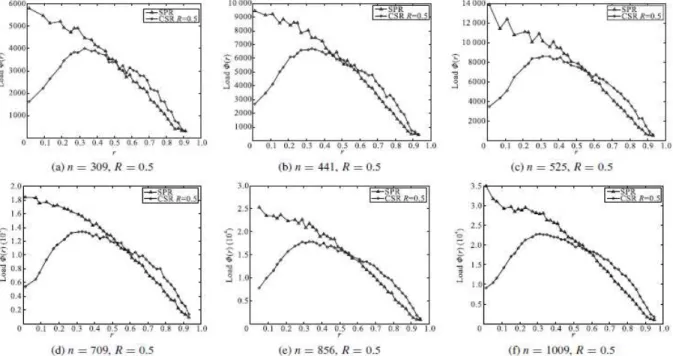
We deploy n nodes on a grid inside the unit circulararea, then set the transmission range to certain valueso that each node can only reach its neighbors in thegrid. We first fix R at 0:5 and test the loaddistribution of SPR and CSR (n increases from 309 to1009).The following conclusionscanbe drawn
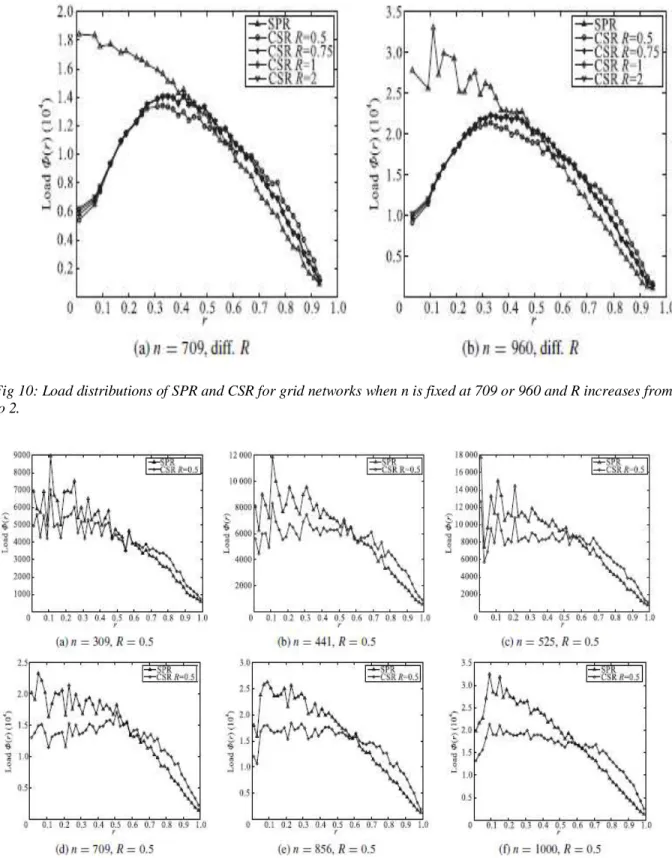
for all cases. It is clear that SPR suffersfrom the crowd center effect in which the maximumload occurs at the center of the network. CSR insteadcan eliminate the high load at the center area and itsmaximum load is much smaller than that of SPT. Thisconfirms the load balancing capability of CSR. we then fix n at 709 or 960 andtest various values of R (from 0:5 to 2). With largervalue of R, CSR has higher maximum load. This isconsistent with our theoretical analysis.However, it isinteresting to see that in all cases the maximum load ofCSR does not occur at the center. This is mainly dueto the structure of grid topology which is not a perfectcircle around the boundary.
5.2 Random networks
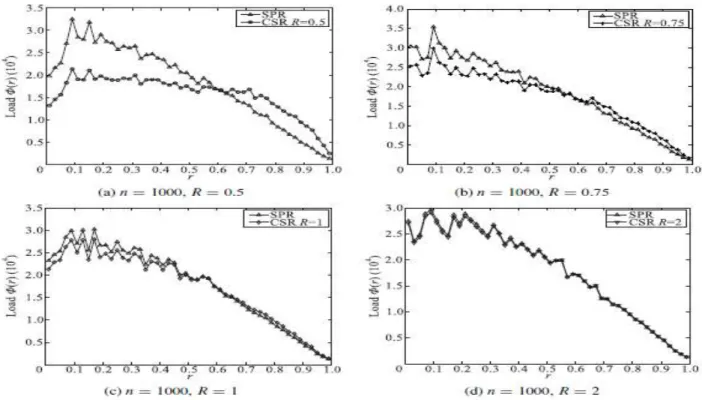
We also test CSR with different random networks. Ineach case, we generate 30 random networks and take theaverage for all results. The conclusions are consistent with ourtheoretical results too.With more nodes, the load curvesbecome much smooth as expected. When n D 1000, itis interesting to see that the load of CSR with R D 2 isalready near the SPR’s one.Thisconfirm our observation that CSR becomes SPR whenR goes to infinity. In addition, the maximum load ofCSR indeed occurs near the center now.
Fig 9: Load distributions of SPR and CSR for grid networks when R is fixed at 0.5 and n increases from 309 to 1009.
ISSN:
2349-7157, volume1 Issue7 July2014
20
Fig 10: Load distributions of SPR and CSR for grid networks when n is fixed at 709 or 960 and R increases from 0.5 to 2.
Fig 11: Load distributions of SPR and CSR for random networks when R is fixed at 0.5 and n increases from 309 to 1000.
Fig 12: Load distributions of SPR and CSR for random networks when n is fixed at 1000 and R increases from 0.5 to 2.
6. CONCLUSION
In this paper, we have presented the first theoreticalresults on load distribution of CSR in a largescale dense multi-hop network. Using the techniquesdeveloped by Hytti¨a and Virtamo, we are able toderive the traffic load _.r/ of CSR (R > 1=2)at any point with a distance r to the center of thenetwork under uniform traffic demands. Our resultsshow that when R D 1=2, CSR can achieve the bestload balancing. Larger R will increase the maximumload at the center of the network. However, it isunclear what is the load distribution of CSR whenR< 1=2. Simulation results in Refs. [10, 11] seemindicate that a better load balancing may be happenedwhen R is slightly smaller than 1=2. We leave furtherstudy of load distribution of CSR when R < 1=2 as ournext step.
7. REFERENCES
[1] S. Chen and Y. Wang, Data collection capacity of randomdeployed wireless sensor networks under physical models, Tsinghua Science and Technology, vol. 17, no. 5, pp. 487-498, 2012.
[2] F. Li and Y. Wang, Circular sailing routing for wireless networks, in Proc. of IEEE INFOCOM, 2008, pp. 1346-1354. [3] F. Li, S. Chen, and Y. Wang, Load balancing routing with bounded stretch, EURASIP Journal on Wireless Communications and Networking, vol. 2010, Article ID 623706, 2010.
[4] E. Hyyti¨a and J. Virtamo, On traffic load distribution and load balancing in dense wireless multi-hop networks, EURASIP Journal on Wireless Communications and Networking, Article ID 16932, 2007.
[5] P.P. Pham and S. Perreau, Performance analysis of reactive shortest path and multipath routing mechanism with load balance, in Proc. of IEEE INFOCOM, 2003, pp.251-259.
[6] S.J. Lee and M.Gerla, Dynamic load-aware routing in ad hoc networks, in Proc. of IEEE ICC, 2001.
[7] H. Hassanein and A. Zhou, Routing with load balancing in wireless ad hoc networks, in Proc. of ACM MSWIM, 2001, pp. 3206-3210.
[8] Y. Yoo and S. Ahn, A simple load-balancing approach in cheat-proof ad hoc networks, in Proc. of IEEE Globecom, 2004, pp. 3573-3577.
[9] Y. Ganjali and A. Keshavarzian, Load balancing in ad hoc networks: single-path routing vs. multi-path routing, in Proc. of IEEE INFOCOM, 2004, pp. 1120-1125.
[10] L. Popa, A. Rostami, R. Karp, C. Papadimitriou, and I. Stoica, Balancing the traffic load in wireless networks with curveball routing, in Proc. of ACM Mobihoc, 2007,pp. 170-179.
[11] F. Li and Y. Wang, Stretch Factor of Curveball Routing in Wireless Network: Cost of Load Balancing, in Proc. of IEEE ICC, 2008, pp. 2650-2654.
[12] H. S. M. Coxeter, Introduction to Geometry, New York: John Wiley & Sons, 1969.