FAULT PROGNOSTICS AND RELIABILITY ESTIMATION OF
DC MOTOR USING TIME SERIES ANALYSIS BASED ON
DEGRADATION DATA
LI WANG, HUIYAN ZHANG, HONG XUE
School of Computer and Information Engineering, Beijing Technology and Business University, Beijing
100048, China
ABSTRACT
This paper presents a method of fault prognostics and reliability estimation for DC motor using time series modeling procedure based on DC motor performance degradation data. DC motor performance degradation data are treated as a time series data and stochastic process are utilized to describe the degradation process for predicting long-term trend. A degradation test is processed for DC motor until they failed and the degradation data are collected for fault prognostics and reliability estimation. Degradation path of DC motors are predicted using time series analysis based on short time period degradation data. A comparison between the predicted failure time and the real failure time of DC motors is processed and the results show that the fault prognostics and reliability estimation of DC motors using time series analysis is effective.
Keywords: Fault Prognostics, Reliability Estimation, DC Motor, Time Series, Degradation Data
1 INTRODUCTION
Fault prognostics and reliability estimation technology is used to predict the probable failure time of a product while operating to help people decide whether to fix or replace the product before its failure. It acquires the main performance indexes variations with time of a product, processes real-time data analysis and presents a lifetime prediction of the product. Much work has been down in fault prognostics and reliability estimation methods, which are proposed including artificial intelligence, fuzzy logic, neural network and grey theory [1-3].
For most kinds of mechanical and electrical products, such as DC motor, the main performance index of the products degrades with time and it will lead to the failure of the product if it passes a specified threshold. Hence, if the degradation path of the performance of the product is predicted, the failure time of the product could be estimated.
In recent years, many scholars have made great success for fault prognostics and reliability estimation of DC motor. However, most researchers have focused on the use of intelligent methods, which exist some shortage, such as that they only emphasis the fitting ability of model and take little consideration of the reasoning ability and prediction ability of model.
Time series analysis is a method to establish a stochastic model for time series data based on its property, and utilizes the stochastic model to predict the long term trend. As the degradation data of products are random variables arranged in temporal order which could be treated as time series data, time series method is applicable to prediction the long-term degradation trend.
2 TIME SERIES ANALYSIS OF
DEGRADATION DATA
The stochastic analysis of degradation data using time series analysis is based on the following hypotheses:
(1) The performance of the product degrades monotonously;
(2) The failure mechanism of product remains the same during the degradation process.
In a degradation test, performance degradation data is usually equally spaced and its variance is homogeneous for a fixed sampling frequency. And the degradation data is nonstationary according to the first hypothesis.
2.1Degradation Data Decomposition
Let Yt denote the performance degradation
measurement at time t. Based on Cramer
be decomposed into two components: deterministic component and stationary random component.
Hence, Yt could be expressed as,
, 1, 2,
t t t t
Y = + +T S ξ t= L (1)
Where Tt is the trend component and St is the
seasonal component, both of which are deterministic
components. ξt is residual component and it is the
stationary random component.
2.2 Trend Component Modeling
The trend component Tt is extracted from
performance degradation data using regression model,
( )
1 2, 1, 2,
t
T =c f t +c t= L (2)
Where f(t) is a specified regression function
which fits the degradation trend of the data well, c1
and c2 are regression parameters which could be
estimated by performance degradation data.
2.3 Seasonal Component Modeling
Extract the season component St, which is
modeled by Hidden Periodicity (HP) regression model,
(
)
1
cos , 1, 2,
q
t j j j
j
S A ω t φ t
=
=
∑
+ = L(3)Where 0<ω ω1< 2L<ωq ≤π.
2.4 Residual Component Modeling
The residual component ξt is modeled by
autoregressive (AR) model,
( )
( )
(
)
1
2
, 1, 2, ,
0, ,
, 0, 1
p
t j t j t
j
t t
t t i
t
E Var
Cov i
ξ ϕ ξ ε
ε ε σ
ε ε − = − = + = = = = ∀ ≥
∑
L (4)As the stationary random series {ξt} and time
series {Yt} are dependent, it is needed to separate the
estimation of the parameters in St and ξt with the
estimation of parameters in Tt. Hence, HP regression
model of season component St and AR model of
residual component ξt are combined into Xt using
Auto Regression-Hidden Periodicity (ARHP) model to estimate the parameters. Set,
, 1, 2,
t t t
X =S +ξ t= L (5)
Substitute Eq.(3) and Eq.(4) to Eq.(5), it is expressed as,
(
)
1 1
cos
p q
t j t j j j j t
j j
X ϕ X− A ωt φ ε
= =
=
∑
+∑
+ + (6)Eq.(6) is an ARHP model.
Hence, the performance degradation
measurement Yt is obtained as,
, 1, 2,
t t t
Y = +T X t= L (7)
Eq. (7) is a Regression-Auto Regression (RAR) model [1].
3 FAILURE TIME PREDICTIONS AND RELIABILITY ESTIMATION
3.1 Failure Time Predictions
In practice, fault or failure occurs often as product performance level achieves a specified threshold
which is denoted as D. Product failure time is time
scale from the beginning of operating to the first achieving. In this paper, failure time is obtained by prediction of degradation data.
0
inf : t ; 0
f
Y
t t D t
y
⎧ ⎫
= ⎨ = ≥ ⎬
⎩ ⎭ (8)
3.2 Reliability Estimation
The failure time prediction is assumed to obey a certain location-scale distribution as determined by a Pearson chi-square Goodness of Fit Test. The estimate of the location and scale parameters of the failure time distribution are obtained by MLE. This
paper denotes failure time prediction of ith product
astf i( ), when total number of products is m, and then
the prediction of the maximum likelihood function for the failure time distribution is
( )
(
( ))
1 , m f i iL β f t β
=
=
∏
(9)Here,β =
(
µ σ,)
T, T means transpose of matrix.This paper denotes failure time distribution as F(t),
reliability of product is estimated by
( ) 1 ( )
R t = −F t (10)
Here, µ, σ are mean value and variance of failure
time distribution.
4 DC MOTOR DEGRADATION TESTING 4.1 Dc Motor Failure Mechanism Analyses
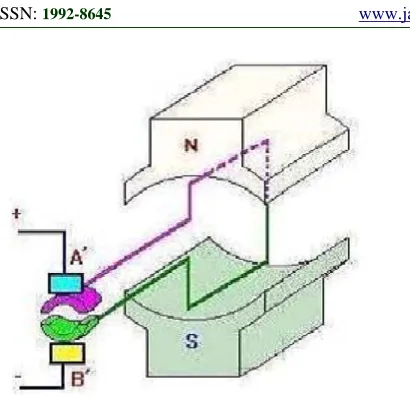
DC motor structure principle is shown as Figure
1. From Figure 1, the DC motor consists of electric
Figure 1 Dc Motor Structure Principle
In practice, most DC motor failure mechanism is electric brush and commutator wear. It leads to DC
motor degradation. Figure 2 shows the failure
[image:3.612.94.299.77.282.2]mechanism.
Figure 2 Dc Motor Failure Mechanism
4.2 Degradation Testing System Design
A degradation testing system for DC motors is built to obtain degradation data of them and predict failure time of DC motors based on short time period degradation data and compare them with the real failure time recorded to verify the fault prognostics and reliability estimation method based on time series analysis.
[image:3.612.318.531.307.476.2]The degradation testing site is shown in Figure 3,
Figure 3 Degradation Testing Site
The construction of the degradation testing system is shown in Figure 4,
Figure 4 Degradation Testing System Construction
The degradation system consists of PC, data acquisition board, I/O connector, DC motor, resistor and power. The power supplies voltage to motor and resistor which are series connected, the I/O connector acquires the voltage over the resistor and sends it to PC through data acquisition board. The PC records the voltage of the resistor in a specified frequency.
The output voltage is defined as the voltage over the motor, and it is given as,
output power
resistor power
resistor motor
V V
R V
R R
= −
×
+
(11)
[image:3.612.91.299.342.502.2]The design voltage of the motor is 3v. The resistance of the resistor is 1 ohm. Hence, for a motor with the resistance of 29 ohm, when it is operating, the output voltage should be an increasing value from 4.83v based on Eq.(11) and when the motor fails, the voltage over the resistor is around zero and the output voltage is around power voltage, which is 5v, as a result of circuit interferences.
5 DEGRADATION TESTING DATA
ANALYSIS
[image:4.612.315.519.75.238.2]A degradation testing is processed for DC motors and the degradation data of 14 motors are utilized to verify the time series analysis method. The PC records the voltage over the resistor every hundred minutes. The degradation path of motors are preprocessed by initial value processing for eliminating influence of their initial value difference and normalizing the failure criterion, which are shown in Figure 5,
Figure 5 Preprocessed Degradation Path Of DC Motors
5.1 Fault Prognostic
Fault prognostic for DC motors using time series analysis is processed as follows.
The trend component Tt is set as a power form as
it fits the degradation path well,
2
1 3, 1, 2,
c t
T =c t +c t= L (12)
The estimations of parameter c1, c2 and c3 are
obtained by regression analysis using degradation
data. The estimation of trend component Tt is shown
[image:4.612.314.519.331.477.2]in Figure 6,
Figure 6 The Estimation Of Trend Component
HP regression model of season component St and
AR model of residual component ξt are combined
into Xt using ARHP model, and the performance
degradation measurement Yt is obtained by RAR
model. Then, the prediction of degradation
measurement Yt is shown in Figure 7,
Figure 7 The Estimation Of Season Component
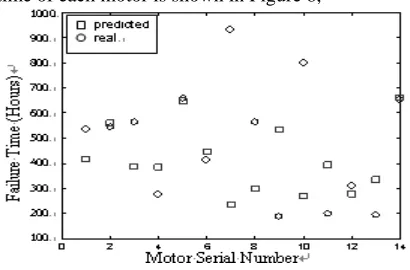
The prediction of failure time and the real failure time of each motor is shown in Figure 8,
Figure 8 Failure Time Prediction And Real Failure Time
5.2 Reliability Estimation
Reliability of DC motor is estimated by
[
]
{
}
( ) 1 ln /
[image:4.612.92.298.338.497.2] [image:4.612.315.520.511.646.2]Here, µ, σ are mean value and variance of lognormal distribution.
The predicted reliability and real reliability of DC
[image:5.612.86.299.94.285.2]motor are all showed in Figure 9 for compare.
Figure 9 The Predicted Reliability And The Real Reliability
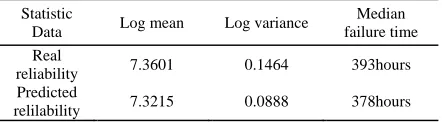
The statistic data of real reliability and predicted reliability is shown in
Table 1,
TABLE 1: Reliability Statistic Data
Statistic
Data Log mean Log variance
Median failure time Real
reliability 7.3601 0.1464 393hours
Predicted
relilability 7.3215 0.0888 378hours
From Table 1, it is obvious that the prediction of reliability curve is very near and just before the real reliability curve of DC motor.
6 CONCLUSIONS
This paper presents a method of fault prognostics and reliability estimation for DC motor using time series modeling procedure based on DC motor performance degradation data. It describes the performance degradation measure of DC motor by Regression-Auto Regression model. A degradation test of DC motors is processed and the degradation data are utilized to predict the failure time and reliability of DC motors. The results show that fault prognostics and reliability estimation by the proposed method is very near the real reliability of DC motor.
ACKNOWLEDGEMENTS
This research is supported by the Research Foundation for Youth Scholars of Beijing
Technology and Business University under grants QNJJ2012-21.
REFRENCES:
[1] Victor Chan, William Q. Meeker, “Time Series
Modeling of Degradation Due to Outdoor Weathering”, Communications in Statistics - Theory and Methods, 37:3,408-424 , 2008.
[2] Bachmann, S. M., “Using the Existing Spectral
Clutter Filter With the Nonuniformly Spaced Time Series Data in Weather Radar,” IEEE Geoscience and Remote Sensing Letters, Vol. 5, No. 3, July 2008.
[3] Wang, L., Li, X. and Jiang, T., “SLD
Constant-Stress ADT Data Analysis based on Time Series Method”, the Proceedings of the 8th International Conference on Reliability, Maintainability and Safety, Chengdu, China, July 21-25, 2009.
[4] Wang Li, Li Xiaoyang, Jiang Tongmin,
“CSADT Life Prediction based on DAD using Time Series Method ”, Proceedings of Annual Reliability and Maintainability Symposium (RAMS2011), 2011.
[5] Wang Li, Li Xiaoyang, Wan Bo, “Step-Stress
ADT Data Estimation based on Time Series Method ”, Proceedings of Annual Reliability and Maintainability Symposium (RAMS2010), 2010.
[6] Wang, J., Zhang, T., “Degradation prediction
method by use of autoregressive algorithm,” IEEE Transactions Industrial Technology, 21-24, Page(s):1-6, April 2008.
[7] Bo Wan, Jun Yao, “New Approach to
Estimating the Constant-stress Accelerated Life Test”, 9th International Conference on Engineering Structural Integrity Assessment (ESIA9), Beijing, China, 2007
[8] Zaiwen Liu, Xiaoyi Wang, Lifeng Cui.
“Research on Water Bloom Prediction Based on Least Squares Support Vector Machine”. 2009 World Congress on Computer Science and Information Engineering, 2008
[9] John P. Rooney., “Storage Reliability,” Proc
Ann. Reliability & Maintainability Symp., 1989, pp 178-182.
[10]Michael Pecht, Abhijit Dasgupta.
“Physics-Of-Failure, An Approach to Reliable Product Development,” IEEE Integrated Reliability Workshop, 1995, pp. 1-4.
[11]Serdobolskii, “Multivariate Statistical
[image:5.612.85.306.377.438.2]