Available Online atwww.ijcsmc.com
International Journal of Computer Science and Mobile Computing
A Monthly Journal of Computer Science and Information Technology
ISSN 2320–088X
IJCSMC, Vol. 3, Issue. 3, March 2014, pg.1127 – 1132
REVIEW ARTICLE
A Review on Novel Approach for MRI
Image Detection using Kochanek-Bartels
Splines with Masking Algorithm
1
Sukhjit Kaur,
2Pooja Sharma
1
[email protected], 2 [email protected]
ABSTRACT: Encryption of image plays a very important role, it helps to save the image from the unauthorized attack. Image processing usually refers to digital image processing, but optical and analog image processing also are possible. MRI is widely used in pre operative and post operative evaluation of the patients. Magnetic Resonance Imaging (MRI) is a powerful visualization technique. It allows images of the internal anatomy to be acquired in a safe and non invasive way. It is based on the principles of Nuclear Magnetic Resonance (NMR). it allows a vast array of different types of visualizations to be performed. In this paper, we are going to use the splines and masking algorithm to detect MRI images.
Keywords: Kochank-bartels splines, MRI, Image Processing, Masking Algorithm
I. INTRODUCTION
In the last years, many solutions for the image encryption have been found. Image data have strong correlations
among adjacent pixels, which make fast data shuffling quite difficult. Statistical analysis on large numbers of images
Correlation among adjacent pixels is evaluated in terms of correlation coefficient, which is a statistical measurement
of an image state.
The key plays a vital role in any encryption method. The security of a cipher text is also depends on the quality of
the key. The key generation algorithm is used for image encryption. In this algorithm, a key is design. This key is
applied on an image that will largely decrease the correlation among the image elements. The image that developed
after this is known as the cipher image. This image is more protected than the first one.
Magnetic Resonance Imaging
Magnetic Resonance Imaging (MRI) is a powerful visualization technique. It allows images of the internal anatomy
to be acquired in a safe and non invasive way. It is based on the principles of Nuclear Magnetic Resonance (NMR).
it allows a vast array of different types of visualizations to be performed. This imaging medium has been of the
particular relevance for producing images of the brain. It can be work like this due to the ability of MRI to record
signals.[1] These signals are distinguish between different soft tissues. In imaging the brain, two
MRI visualizations are used, as:
1) T1-weighted
2) T2-weighted images.
These are generally refer to the dominant signal, that help the measured to produce the contrast observed in the
image. The areas with high fat content have a short T1 time relative to water. The T1 weighted images can be
thought of as visualizing locations of the fat. In contrast, the areas with high water content have the short T2 time
relative to areas of high fat content. The T2 weighted images can be thought of as visualizing locations of water.
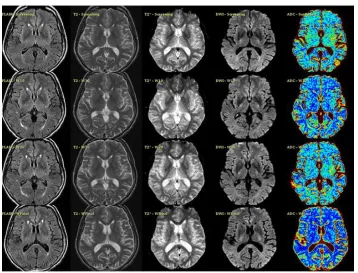
T1 weighted images shows in the first 3 rows. The T1 weighted images with contrast agents are shown in the middle
3 rows. The T2 weighted images are shown in the bottom 3 rows. The slices within modalities are ordered from left
to right, then top to bottom. This order corresponds to moving from the bottom to the top of the head.[1]
Imaging techniques
The MRI has become the primary imaging modality for brain tumors. Now a days, it is widely used in pre operative
and post operative evaluation of the patients. The conventional MRI with or without contrast medium is the
investigation of choice.[2]
The imaging modality has some limitations, as:
The findings are not specific as gliomas, metastasis, lymphomas, abscesses and
Infarctions. These all may present in ring like contrast enhancement and surrounding edema.
The degree of contrast enhancement is correlates to the histologic grade of gliomas. MRI
techniques alone has a limited diagnostic yield.
The perfusion MRI measures blood flow to the tumor and the surrounding brain tissue. The most commonly used
parameter is regional cerebral blood volume (rCBV). it is used to evaluates the amount of blood passing through a
specified region of the brain. The techniques enables to a certain extent glioma grading, differentiation of metastasis
and high grade gliomas, selection of an appropriate target for stereotactic biopsy and defininition of tumor margins.
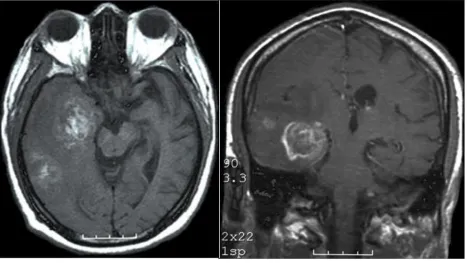
Fig 2 Glioblastoma multiforme
The Positron emission tomography (PET) can resolve part of this problem though the sensitivity is arguable. This
in GBM. The various imaging modalities may be complementary and contribute to diagnosing a brain lesion, the
clinical value is still partially undetermined for some of the techniques.[3]
II. LITERATURE SURVEY
In 2010,Mukesh Kumar, Kamal K. Mehta discuss that the detection and segmentation of brain tumor accurately is
a challenging task in MRI. The MRI image is an image that produces the high contrast images indicating regular and
irregular tissues. The automatic seed finding methods may suffer with the problem if there is no growth of tumor
and any small white part is there. When the edges of tumor are not sharp then the segmentation results are not
accurate. This may be happened due to initial stage of the tumors.[4] In this paper a method of tumor detection
based on texture of the MRI and if it is detected then to segment it automatically is proposed. Segmentation is a
process of identifying an object or pattern in the given work space. The MRI produces a high contrast image
representing each part very clearly. In these cases the physiologist need to have keen observation of the anatomical
structure. But this process is too much time consuming and if the initial segmentation result is not correct then other
consequent results also produces incorrect measurement results. There are a number of methods for brain tumor
segmentation like fuzzy logic approach, neuro fuzzy approach, Random walk etc, but these all methods can
produces unsatisfactory results due to un sharped edge boundaries.
Peter Karasev et.al,(2013): discuss that segmentation of injured or unusual anatomic structures in medical imagery
is a problem that has continued to elude fully automated solutions. In this paper, the goal of easy-to-use and
consistent interactive segmentation is transformed into a control synthesis problem.[5] A nominal level set partial
differential equation (PDE) is assumed to be given; this open-loop system achieves correct segmentation under ideal
conditions, but does not agree with a human expert’s ideal boundary for real image data. Perturbing the state and
dynamics of a level set PDE via the accumulated user input and an observer-like system leads to desirable
closed-loop behavior. The input structure is designed such that a user can stabilize the boundary in some desired state
without needing to understand any mathematical parameters. Effectiveness of the technique is illustrated with
applications to the challenging segmentations of
a patellar tendon in magnetic resonance and a shattered femur incomputed tomography.
J.L. Izquierdo aragoza et.al,(2011): Atherosclerosis may progress throughout life being unnoticed, it can lead to
serious cardiovascular diseases. One of the most reliable indicators to detect the thickening of the arterial walls is the
intima media thickness (IMT) of the common carotid artery. The doctor can measures the IMT by setting manually
only two points, which may distort the results depending on whether these points are taken properly. By segmenting
with active contours, two parametric curves will delineate I5 and I7 interfaces, which leads to better and more useful
results. Image segmentation can detect the IMT throughout the artery length as well as statistics [6] such as the
maximum, the minimum or the average IMT. The segmentation method proposed in this work is based on active
contours, consisting of two parametric curves that are adjusted adaptively to the existing edges in the image. Results
show the ability of these curves to measure the IMT in ultrasound images and are also compared with measurements
III. PROPOSED WORK
In the image detection, magnetic resonance imaging (MRI) Plays a vital role. In our purposed approach MRI is used.
Earlier image processing is the most challenging task, but now days, medical image processing is the most
challenging and emerging field. Manual segmentation of images from Magnetic Resonance images is time
consuming task. Processing of MRI images is one of the part of this field. The detection and extraction of image is
done by MRI scan. To solve the problems presenting in image detection, we are going to use the K B splines with
masking algorithm. The kb splines are nothing more than hermite curves and a handful of formulas to calculate the
tangents. These curves have been introduced by D. Kochanek and R. Bartels in 1984 to give animators more control
over key frame animation. They introduced three control-values for each key frame point:
1) Tension
2) Continuity
3) Bias
The Kochanek-Bartels Splines: The Kochanek-Bartels Splines are base on tangents. tangents provides the
direction of curve. It begins form start point and through various points it will meets end point.
P0: the start point of the curve
M0: the tangent to how the curve leaves the start point
P1: The Midpoint of the curve
M1: the tangent to how the curves passes the midpoint
P2: he endpoint of the curve
M2: the tangent to how the curves meets the endpoint
Now here we are going to use Kochanek-Bartels Splines with masking algorithm for MRI image detection. Now
MRI images aremagnetic resonance imaging like CT scan, ultra sound etc. so for proper detection of disease from
MRI image we will use these algorithms.
REFERENCES
[1] Brown, M. and Semeka, R. (2003). MRI: Basic Principles and Applications.John Wiley and Sons, Inc., 3rd
edition.
[2] Olsen KI, Schroeder P, Corby R, Vucic I, Bardo DME. Advanced magnetic resonance imaging techniques to
evaluate CNS glioma. Expert Rev Neurotherapeutics Suppl 2005; 5:s3-s11.
[3] Knopp EA, Cha S, Johnson G et al. Glial neoplasms:dynamic contrastenhanced T2*-weighted MR imaging.
Radiology 1999; 211(791):798.
[4] Mukesh Kumar, Kamal K.Mehta, A Texture based Tumor detection and automatic Segmentation using Seeded
Region Growing Method,2010
[5] Peter Karasev, et.al, Interactive Medical Image Segmentation Using PDE Control of Active Contours, IEEE
TRANSACTIONS ON MEDICAL IMAGING, VOL. 32, NO. 11, NOVEMBER 2013 2127
[6] J.L. Izquierdo-Zaragoza, et.al, SEGMENTATION OF THE CAROTID ARTERY IN ULTRASOUND
IMAGES USING FREQUENCY-DESIGNED B-SPLINE ACTIVE CONTOUR, 978-1-4577-0539-7/11/$26.00