JIEM, 2012 – 5(2): 364-381 – Online ISSN: 2013-0953 – Print ISSN: 2013-8423 http://dx.doi.org/10.3926/jiem.410
- 364 -
Genetic algorithm for project time-cost optimization in fuzzy
environment
Khan Md. Ariful Haque, Md. Ahsan Akhtar Hasin
Rajshahi University of Engineering & Technology (Bangladesh)
,
Received: October 2011 Accepted: August 2012
Abstract:
Purpose:
The aim of this research is to develop a more realistic approach to solve project
time-cost optimization problem under uncertain conditions, with fuzzy time periods.
Design/methodology/approach:
Deterministic models for time-cost optimization are never
efficient considering various uncertainty factors. To make such problems realistic, triangular
fuzzy numbers and the concept of
-cut method in fuzzy logic theory are employed to model
the problem. Because of NP-hard nature of the project scheduling problem, Genetic Algorithm
(GA) has been used as a searching tool. Finally, Dev-C++ 4.9.9.2 has been used to code this
solver.
Findings:
The solution has been performed under different combinations of GA parameters
and after result analysis best values of those parameters have been found for the near optimal or
sustainable solution.
Research limitations/implications:
For demonstration of the application of the developed
algorithm, a project on new product (Pre-paid electric meter, a project under government
finance) launching has been chosen as a real case. The formulation of the model of the problem
is developed under some assumptions that have been mentioned in section 5.
- 365 -
Originality/value:
Reports reveal that project optimization problems have never been solved
under multiple uncertainty conditions. Here, the function has been optimized using Genetic
Algorithm search technique, with varied level of risks and fuzzy time periods.
Keywords:
time-cost optimization, fuzzy time functions, risk levels, genetic algorithm
1. Introduction
A project is a combination of interrelated activities which must be executed in a certain order before the entire task is completed. The activities are interrelated in a logical sequence which is known as precedence relationship. For the analytical purpose, the activities of a project are represented in a network diagram maintaining precedence relationship to get solutions for scheduling and controlling. The longest continuous path of a project network is called critical path which determines the project duration. The most commonly used project management techniques are Gantt chart, Milestone, Critical Path Method (CPM) and Project Evaluation and Review Technique (PERT). The major objective of project scheduling is to complete the entire project within budget and time constraints. Traditional project scheduling problems mainly focus on activities assuming deterministic or probabilistic time durations.
Project scheduling is the conversion of a project action plan in an operating timetable. It serves as the basis for monitoring and controlling project activity. Taken together with the plan and budget, it is probably the major tool for the management of projects. The basic approach for all scheduling techniques is to form a network of activity and event relationships. Critical path of this network is an important issue for project schedulers, because it refers the duration of whole project. Project managers are highly concerned with this critical path for on time completion of a project, especially when an extension will incur a penalty (either in liquidated damages, opportunity costs and goodwill losses). When some delay have been occurred, there may be necessary to compress the critical activity by incrementing the activity resources above the normal level. It is often the case that the performance of some or all activities can be accelerated, or the duration crashed, by allocating more resources at the expense of higher activity direct cost. This crashing of activities can be achieved by multiple shift work, extended work days, using larger and more productive equipment and increasing the size of labour crews. So, project schedule planners mainly focus on finding the most cost effective way to complete a project within a specified completion time. This class of problem is usually called time-cost trade off.
- 366 -
execution errors of contractor, design errors, natural events such as climate changes and etc. Therefore, total time and cost of project may differ significantly because of these uncertainties. Almost all of the projects, the required information for estimation of project parameters are either unavailable or incomplete. In practice, the majority of construction companies do not systematically record the durations of project activities. In addition, it is commonly known that no two construction projects are alike. Also in many cases the project is done for the first time, this compels us to use expert opinion in forecasting the project parameters. Experts use their own judgment, experience and project information that is available to them. In practice, linguistic terms such as, “approximately”, “more or less”, or “about” are commonly found in the statements used by these experts. These terms clearly exhibit some sort of imprecision that naturally leads to a range of possible values, rather than a definitive estimate using a single value. So, uncertainty and project parameters are inextricable. In thesis situation, deterministic models of construction time-cost trade off are not realistic. Crisp decision making in uncertain environment causes loss of some parts of information. Use of uncertain models, whish is capable of formulating vagueness of the dynamic conditions of real world gives more stability to solve time-cost trade off problem. Some probabilistic techniques are used in many cases to meet these uncertainties to some extent. But project parameters may not be in statistical manner. That is why fuzzy set theory is appropriate to consider affecting uncertainties in activity duration, direct and indirect cost of a project.
Since different alternatives of possible durations and costs for the activities can be associated with a project, the problem is arisen to search the best solution. As combinatorial optimization problems, finding optimal decisions is difficult and time consuming considering the number of possible permutations involved. Therefore, any analytical procedure may suit for small project, but it will be inefficient for large project because of exhaustive enumeration. To avoid the problem of combinatorial explosion, heuristic models can be used. It does not ensure the optimality but it gives better near optimal solution without mathematical rigor.
This research aimed at development of an efficient heuristic approach with fuzzy activity time and cost for project time-cost optimization incorporating the vagueness or fuzziness of the dynamic conditions of the real world.
2. Literature review
- 367 -
Considering the importance of construction time-cost optimization, various analytical and heuristic methods have been proposed by many researchers in recent decades.
Some examples of heuristic approaches are Fondahl’s (1961) method, Prager’s (1963) structural model, Siemens’s (1971) effective cost slope model, and Moselhi’s (1993) structural stiffness method. Siemens has developed SAM (Siemens Approximation Method) algorithm which is ideally suited for hand computation and also is suitable for computer solution. Lakshminarayanan, Gaurav and Arun (2011) developed a meta-heuristic multi-colony ant algorithm for optimization of three objectives time-cost-risk as trade-off problem.
Feng, Liu and Burns (1997) developed a GA model that is an improvement of their earlier linear programming / integer programming model (Liu, Burns & Feng, 1995). The model by Li and Love (1997), on the other hand, was formulated to produce the times, in real numbers, by which each critical activity should be reduced. The study did not consider the formation of other critical paths during the crashing process and was limited to continuous, as opposed to discrete, variables for crashing times. Hegazy (1999) developed a practical GA model by implementing the GA protocols within Microsoft Project. This model has demonstrated an improvement over the previous GA models. Zheng, Ng and Kumaraswamy (2004) has introduced a multi-objective model by using genetic algorithms integrates the adaptive weight derived from previous generations and induces a search pressure toward an ideal point. Chua, Chan and Govinda (1997) proposed a time-cost trade-off model using genetic algorithm. Li, Hussein and Lei (2011) proposed a methodological framework including optimization, sensitivity analysis, and improved GA for build-operate-transfer projects. However, the above mentioned time-cost trade-off models mainly focus on deterministic environment.
Uncertainties (such as inflation, economical and social stresses, execution errors of contractor, design errors, natural events as climate changes, etc.) in the problem have received less attention due to its complexity. These uncertainties cause changes in durations and cost of activities and hence total cost of project may differ significantly. Because of its practical relevance researchers have recently begun to pay special attention to uncertain scheduling.
- 368 -
completion time with uncertainty. To solve time-cost trade-off problem, Ghazanfari (2008) developed an approach by possibility goal programming with fuzzy decision variables. It could not fully satisfy the real field problem of time-cost trade-off problem as crashing costs are crisp.
Leu, Chen and Yang (2001) incorporated fuzzy set theory with genetic algorithms to model uncertainty in time-cost trade-off problem. Project scheduling with resource consideration was also developed by Leu, Chen and Yang (1999). Abbasnia, Afshar and Eshtehardian (2008) have investigated fuzzy logic based approach called Non-dominated Sorting Genetic Algorithm (NSGA) for time-cost trade-off problem in uncertain environment. This model cannot fully meet uncertainty of practical problem.
Other than fuzzy time-cost trade-off problem, a probabilistic model has been developed by Arazon, Perkgoz and Sakawa (2005) in PERT network using a genetic algorithm. Another analytical method that combines fuzzy set theory with the PERT technique for measuring the criticality in a project network was developed by Chen and Huang (2007).
3. Fuzzy set theory
3.1. Concept of fuzzy numbers
There are different forms of fuzzy numbers. This paper only considers triangular fuzzy numbers that can be defined by a triplet
A
~
a
,
b
,
c
, the membership function is;
x
c
,
0
c
x
b
,
b
c
x
c
b
x
a
,
a
b
a
x
a
x
,
0
)
c
,
b
,
a
;
x
(
triangle- 369 -
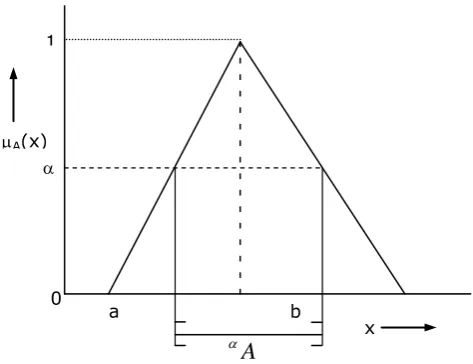
Figure 1. Triangular fuzzy membership function and -cut level
3.2. Concept of alpha ()-cut
The -cut is a commonly used method to connect the principles of fuzzy sets with a collection of crisp sets, which can in turn be fed into most of the existing systems. Given a fuzzy set A defined on X and any number
[
0
,
1
]
, the -cut, A
is the crisp set as defined by:}
)
x
(
A
|
x
{
A
That is, the -cut of a fuzzy set A is the crisp set
A
that contains all the elements of theuniversal set X whose membership grades in A are greater than or equal to the specified value of which is clearly explained by Figure 1.
In this paper, -cut is known to incorporate the experts or decision makers’ confidence over his preference or the judgments. =1 means the expert is highly certain about his knowledge regarding a phenomenon over which he expresses his preferences then the outcome will be a single value having the membership 1 in the fuzzy performance set. When <1, it indicates there exist uncertainty. =0 expresses the highest level of uncertainty. Actually represents the degree of risk that the managers is prepared to face.
4. Genetic algorithm (GA)
Genetic algorithm is a heuristic search approach that provides a means of optimization of
NP-hard problems. These procedures combine an artificial survival-of-the-fittest strategy with genetic operators abstracted from nature (Goldberg, 1989), to form a mechanism that is suitable for a variety of optimization problems. The theory behind GA is that a population of certain species will, after many generations of random evolutions, adapt to live better in its environment. GA solves optimization problems in the same fashion. This procedure begins by
1
0
A
A(x)
x
- 370 -
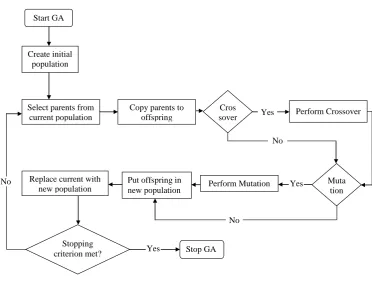
generating an initial population of random solutions that are codified in the strings of numbers called chromosomes. Each individual chromosome represents one solution that is better, or worse, than others in the population. The fitness of each solution is determined by evaluating its performance with respect to an objective function named as fitness function. A selection mechanism is applied to the current population to create an intermediate population. Then crossover and mutation operators are applied to the intermediate population to form a novel population. This population is then used in the next iteration of the algorithm. Usually, this process is continued for a large number of offspring generations in which the population keeps evolving (better solutions replace unfit solutions), until a terminating criterion is met. At the end of the process, the member of the population with the best performance becomes the optimum solution. The operations of GA process are shown in Figure 2.
Perform Crossover Cros
sover Copy parents to
offspring Select parents from
current population Start GA
Create initial population
Put offspring in
new population Perform Mutation
Muta tion Replace current with
new population
Stopping
criterion met? Stop GA No
Yes
Yes No
No Yes
Figure 2. The GA process
5. Problem formulation
The objective of this model is to find the optimal combination of activity durations with minimum total project cost at different risk levels (-cut levels) so that the project can be completed within a specified project duration selected from feasible project time spectrum. The mathematical model is expressed as follows:
min
i J i C i
N
C
C
C
C
(1)- 371 -
(
)
0
0
low
i i i
i i
N
if
d
d
N
d
C
0
)
(
0
i Ci i iC
if
d
d
N
d
C
lo w i
Otherwise i J i iJ
d
N
C
Subject to
T
D
(2)
max i i min
i
d
d
d
(3)0
d
i
, i = 1, 2, 3....
Where,
C
= Total project cost at a specific -cut level
i
d
= Duration of activity i at a specific -cut level
i N
C
= Normal cost of activity i at the duration
i
d
i CC
= Crash cost of activity i at the duration
i
d
i JC
= Indirect cost of activity i at the duration
i
d
i
N
= Normal cost rate of activity i at the duration
i
d
i CN
= Crash cost rate of activity i at the duration
d
ii J
N
= Indirect cost rate of activity i at the duration
i
d
T
= Project duration at a specific -cut level
D = Permissible maximum project duration
min i
d
- 372 - low
i
d
= Minimum duration of activity i at a specific -cut level finished normally
max i
d
= Maximum duration of activity i at a specific -cut level finished normally
Equation (1) indicates the total project cost. Equation (2) restricts the project must be finished within the targeted duration. Equation (3) ensures each activity time is restricted between minimum crash duration and maximum normal duration. This model is formulated on the basis of some assumptions. These are all activities are crashable, normal and crash activity durations are characterized by triangular fuzzy numbers, direct and indirect cost rates are also characterized by triangular fuzzy numbers, durations of activities are considered only integer values within its range, direct cost rates are decreased and indirect cost rates are increased as activity duration increases in fuzzy nature, and resources are not limited.
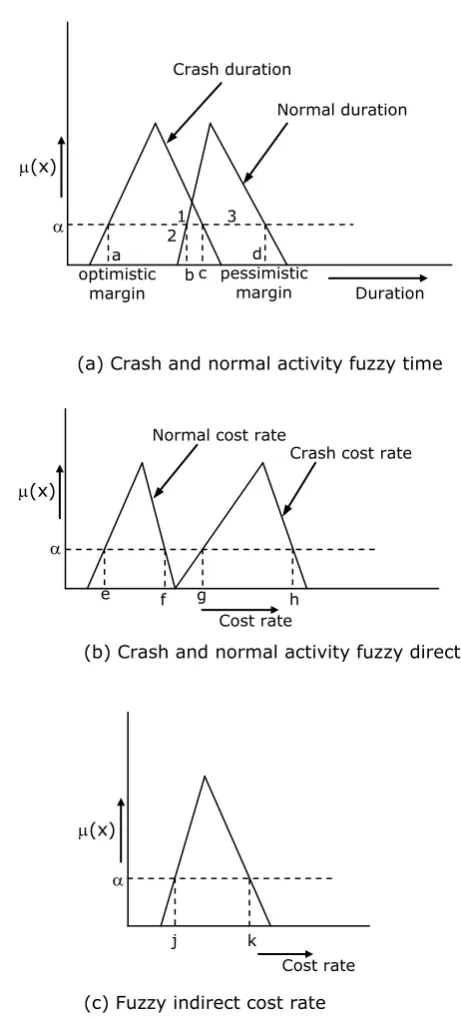
6. Fuzzy relationship between time and cost
Figure 3 depicts the concept of activity durations and their corresponding costs generation procedure. The activity duration can be divided into three regions- crash time (region-1), normal time (region-2) and overlapping time (region-3) as in Figure 3(a). Within the crash time, the activity needs to be performed in a crash mode, i.e., it needs to spend great deal of effort to reduce the time. Within the normal time, the activity can be finished in normal mode. The cost in a crash mode is generally higher than that in a normal mode since more resources are needed to invest in the activity so as to finish as early as possible. When the activity time falls within the overlapping region, it can be performed in either normal mode or crash mode. But it is reasonable to finish the activity in normal mode as it will be cost effective.
At a specific -cut level, points h, g, f, e in Figure 3 (b) represent corresponding direct cost rates of points a, c, b and d in Figure 3 (a) respectively. In case of indirect cost, points i and k
in Figure 3 (c) represent corresponding indirect cost rates of points a and d in Figure 3 (a) respectively. Direct and indirect cost rates of other durations in the acceptable region are then calculated. These cost rates are used to determine the total costs (direct cost indirect cost) of each activity which are the inputs of the next steps.
- 373 -
Figure 3. Fuzzy relationships between time and cost of an activity
7. GA based solver
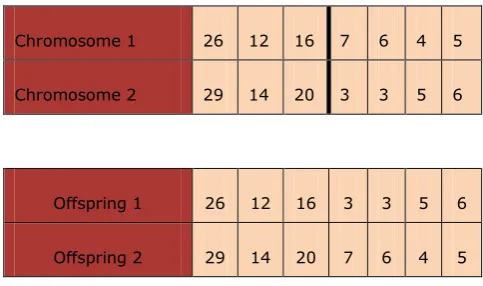
The operational architecture of GA solver for fuzzy time-cost optimization of a project is shown in Figure 5. GA solver starts with the creation of an initial population pool where each solution is presented as a string (chromosome) of activity durations. The initial population number is taken as computer input for the program. In Figure 4, chromosome 1 (parent) and chromosome 2 (parent) show sample encoded chromosomes that have been used in this paper. Numbers in cells represent activity durations of seven activities from A to G successively. A value of -cut level and specified project duration (within feasible region) are
(a) Crash and normal activity fuzzy time
(b) Crash and normal activity fuzzy direct cost rate
j
(x)
k
Cost rate
(c) Fuzzy indirect cost rate
Crash cost rate
(x)
e f g h
Normal cost rate
Cost rate Crash duration
Normal duration
(x)
a
b c d optimistic
margin
1 3 2
pessimistic
- 374 -
also taken as input. After evaluating the fitness function, probability pi and cumulative
probability qi for
i
chromosomes (where i = 1, 2, 3, ….) have been calculated. Roulette wheelmechanism is used to select chromosomes which will undergo breeding to create next generation.
In order to exploit and explore potential solutions, genetic algorithm generates possible chromosomes by using crossover and mutation operators. Single-point crossover is used in this solution. A crossover rate pc is taken indicates how many chromosomes will undergo the crossover operation. Figure 4 shows single-point crossover operation. Here, offspring 1 and offspring 2 have been created from their parent chromosomes by exchanging all bits after randomly chosen crossover point (crossover point is 3).
Chromosome 1 26 12 16 7 6 4 5
Chromosome 2 29 14 20 3 3 5 6
Offspring 1 26 12 16 3 3 5 6
Offspring 2 29 14 20 7 6 4 5
Figure 4. Single point crossover operation
A mutation rate
p
mis used to control the percentage of bits on which mutation is applied. The- 375 -
Figure 5. GA problem solving approach
8. A case study and result analysis
The project on launching of a new product (pre-paid electric meter, a project under the government finance) is presented with a 7-activity CPM network (AOA diagram) illustrating project scheduling with time-cost trade-off problem. The precedence relationships of the network are depicted in Figure 6. The durations, direct and indirect cost rates for both normal and crash modes of each activity are shown in Table 1. The optimistic and pessimistic project duration margins with different values of -cut levels are defined in Table 2 and Figure 7. Only integer activity times have been considered to estimate project duration. The region bounded by the optimistic and pessimistic margins is the possible project duration spectrum for construction time-cost trade-off.
Figure 6. CPM network of the project on new product (Pre-paid electric meter, a project under government finance) launching
C
G
F
1 5
4 2
3 B
E D
A Start
Problem Inputs
Project network
Expected completion time
Fuzzy durations
Fuzzy cost rates
α-cut levels
Developing the objective function
Acceptable activity duration generation
GA SA inputs
Encoding type
Chromosome
Selection method
Reproduction
Termination condition
- 376 -
Activity
No. Name of the Activity
Duration (day) Direct cost rate (Tk./day) Indirect cost rate (Tk./day) Crash Normal Crash Normal
A Forecast sales volume, using market research 15,17,20 25,27,30 300,400,445 150,200,250 70,70,70
B Design pre-paid meter 10,12,15 13,16,20 200,250,260 100,120,130 20,20,20
C Materials and component procurement 15,16,20 16,20,26 200,250,300 80,120,170 60,60,60
D Laboratory test of materials and component 2,4,5 5,7,8 150,220,280 50,90,120 80,80,80
E Proto-type Production 2,3,5 4,6,7 290,370,410 100,160,210 100,100,100
F Laboratory and commercial testing 2,3,4 3,5,7 140,225,350 50,90,130 50,50,50
G Commercial production, sales and distribution
planning 3,5,6 4,6,9 150,210,250 40,95,140 30,30,30
Table 1. Durations and cost rates of activities of the project on new product Pre-paid electric meter, under government finance) launching
Crash duration
(day) Normal duration (day) Min Max Min Max
0.0 35 51 49 72
0.1 39 47 53 68
0.2 39 47 53 67
0.3 39 46 54 66
0.4 39 45 54 64
0.5 39 45 54 64
0.6 41 43 58 63
0.7 41 42 58 60
0.8 41 41 59 60
0.9 41 41 59 59
1.0 41 41 59 59
Table 2. Optimistic and pessimistic project duration margins
0 0.1 0.2 0.3 0.4 0.5 0.6 0.7 0.8 0.9 1
30 35 40 45 50 55 60 65 70 75
Project duration (day)
V
al
ue
of
a
lph
a-cut
Figure 7. Possible project duration spectrums of the project
- 377 -
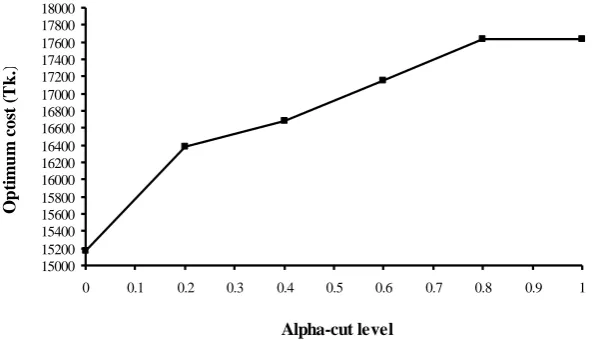
of RAM. Two folders were created: one is input folder and the other is output folder. All inputs are given into the input folder. GA operational parameters are given as input through dialogs and the all output data are exported to output folders for data analysis. Table 3 shows the results produced with the parameters set as number of initial population = 100, generation number = 10,000, project completion time 55 days. Here, -cut value was varied. The best result was found at crossover rate = 0.8, and mutation rate = 0.1. For -cut value=2, the result reveal that under time constraint of 55 days, the project manager should try to complete this project within 55 days with cost of Tk.16384.3 considering 0.2 (lower) risk levels.
Values of -cut level
Durations (day) of activities Optimum project duration
(day)
Optimum Cost (Tk.)
Computation time (second) A B C D E F G
0.0 30 13 19 2 2 3 4 55 15167.5 23.37 0.2 29 14 18 3 3 4 5 55 16384.3 23.30 0.4 28 15 19 3 3 4 5 55 16678.2 22.20 0.6 27 15 19 7 3 5 6 55 17147.4 20.01 0.8 27 16 20 7 3 5 5 55 17630.0 20.01 1.0 27 16 20 7 3 5 5 55 17630.0 19.00
Table 3. Effect of -cut value on the optimum solution
An analysis found that as the alpha-cut value increases, the total cost of a project also increases (see Figure 8). It is because, the choice become limited for the selection of smaller value from possible duration of each activity to reduce the total cost of the project. Alternatively, it can be said that total cost of a project increases with the risk level (-cut value) increases.
15000 15200 15400 15600 15800 16000 16200 16400 16600 16800 17000 17200 17400 17600 17800 18000
0 0.1 0.2 0.3 0.4 0.5 0.6 0.7 0.8 0.9 1
Alpha-cut level
O
p
ti
m
u
m
c
os
t (
T
k
.)
Figure 8. Impact of alpha-cut level on project total cost
9. Convergence analysis
- 378 -
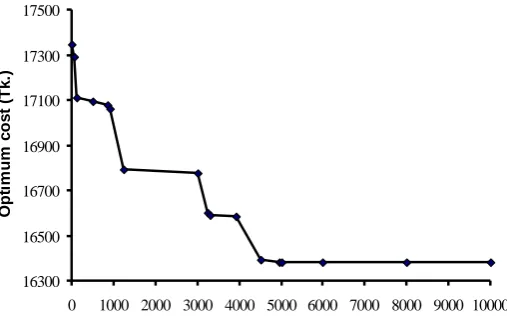
drawn from the data with parameters of 0.2 alpha-cut level, project completion time 55 days, 100 number of initial population, Pc = 0.8 and Pm = 0.1. It is observed from the figure
that the optimum value is improving with generation number and it is converging toward global optimum. After 4960 generations the global optimum solution has been found and its value is Tk.16384.3 only.
16300 16500 16700 16900 17100 17300 17500
0 1000 2000 3000 4000 5000 6000 7000 8000 9000 10000
Generation number
O
p
ti
m
u
m
c
o
s
t
(T
k
.)
Figure 9. Convergence graph of the project
10. Conclusions
This research work customized GA based project time-cost optimization algorithm in a fuzzy environment. It provides an efficient computational technique for time-cost optimization project scheduling problem incorporating uncertainty in network analysis. Because of dynamic situation of environment, these proposed algorithms are efficient due to fuzziness of its variables. With the concept of alpha-cut method of fuzzy theory, fuzzy input variables were transformed into crisp values. Due to NP-hard nature of the problem, a computer code of GA based solver was used to find the optimum solution within project completion time constraint at different values of alpha-cut level. Decision makers (mainly project managers) can use this model to choose the desired (optimum) solution for time-cost trade off within a time limit under different risk levels that varies with the values of ( =0 means lowest level of risk and
=1 means highest level of risk).
The problem was resolved under different combinations of GA parameters. After analysis of results, optimum values of those parameters were found.
- 379 -
Different selection mechanisms can change the algorithm efficiency. In this problem Roulette wheel selection method is suggested. A new selection method can be created as an attempt to improve the solution quality.
Crossover and mutation operators are important parameters of genetic algorithm. In this paper, single point crossover and random mutation operations were used in every generation. Other new types of crossover and mutation operations can be developed which may be respondent to the generation quality.
The algorithm can also be extended by considering resource limited time-cost optimization with other types of fuzzy numbers.
References
Abbasnia, R., Afshar, A., & Eshtehardian, E. (2008). Time-cost trade-off problem in construction project management, based on fuzzy logic. Journal of Applied Sciences, 8(22), 4159-4165. http://dx.doi.org/10.3923/jas.2008.4159.4165
Arazon, A., Perkgoz, C., & Sakawa, M. (2005). A genetic algorithm approach for the time-cost trade-off in PERT networks. Applied Mathematics and Computation, 168, 1317-1339. http://dx.doi.org/10.1016/j.amc.2004.10.021
Chanas, S., & Zielinski, P. (2001). Critical path analysis in the network with fuzzy activity times. Fuzzy Sets and Systems, 122, 195-204. http://dx.doi.org/10.1016/S0165-0114(00)00076-2
Chen, C. T., & Huang, S. F. (2007). Applying fuzzy method for measuring criticality in project network. Information Sciences, 177, 2448-2458. http://dx.doi.org/10.1016/j.ins.2007.01.035
Chua, D. K. H., Chan, W. T., & Govinda, K. (1997). A time-cost trade-off model with resource consideration using genetic algorithm. Civil. Eng. Syst., 14, 291-311. http://dx.doi.org/10.1080/02630259708970224
Feng, C., Liu, L., & Burns, S. (1997). Using genetic algorithms to solve construction time-cost trade-off problems. ASCE Journal of Computing in Civil Engineering, 11(3), 184-189. http://dx.doi.org/10.1061/(ASCE)0887-3801(1997)11:3(184)
Fondahl, J. W. (1961). A non-computer approach to the critical path method for the construction industry. Tech. Rep. No. 9, The Constr. Inst., Dept. of Civ. Engrg., Stanford Univ., Stanford, Calif.
- 380 -
Han, T. C., Chung, C. C., & Liang, G. S. (2006). Application of fuzzy critical path method to airport’s cargo ground operation system. Journal of Marine Science and Technology, 14(3), 139-146.
Hegazy, T. (1999). Optimization of construction time-cost trade-off analysis using genetic
algorithms. Canadian Journal of Civil Engineering, 26(6), 685-697.
http://dx.doi.org/10.1139/l99-031
Klir, G. J., & Yuan, B. (2005). Fuzzy sets and Fuzzy logic: Theory and Applications. Prentice -Hall of India.
Lakshminarayanan, S., Gaurav, A., & Arun, C. (2011). Time-cost-risk trade off using ant colony optimization. Journal of Construction in Developing Countries, Preview Manuscript. Leu, S. S., Chen, A. T., & Yang, C. H. (1999). Fuzzy optimal model for resource-constrained
construction scheduling. Journal of Computing in Civil Engineering, 13(3), 207-216. http://dx.doi.org/10.1061/(ASCE)0887-3801(1999)13:3(207)
Leu, S. S., Chen, A. T., & Yang, C. H. (2001). A GA-based fuzzy optimal model for construction time-cost trade-off. International Journal of Project Management, 19, 47-58. http://dx.doi.org/10.1016/S0263-7863(99)00035-6
Li, H., Hussein, M. A., & Lei, Z. (2011). Incentive genetic algorithm based time–cost trade-off analysis across a build–operate–transfer project concession period. Can. J. Civ. Engrg., 38, 166-174. http://dx.doi.org/10.1139/L10-118
Li, H., & Love, P. (1997). Using improved genetic algorithms to facilitate time-cost optimization. ASCE Journal of Construction Engineering and Management, 123(3), 233-237. http://dx.doi.org/10.1061/(ASCE)0733-9364(1997)123:3(233)
Liang, G. S., & Han, T. C. (2004). Critical path analysis based on fuzzy concept. International Journal of Information and Management Sciences, 15(4), 29-40.
Liu, L., Burns, S., & Feng, C. (1995). Construction time-cost trade-off analysis using LP/IP.
ASCE Journal of Construction Engineering and Management, 121(4), 446-454. http://dx.doi.org/10.1061/(ASCE)0733-9364(1995)121:4(446)
Liu, S. T. (2003). Fuzzy activity times in critical path and project crashing problems.
Cybernetics and Systems, 34, 161-172. http://dx.doi.org/10.1080/01969720302865
Lorterapong, P., & Moselhi, O. (1996). Project-network analysis using fuzzy sets theory.
- 381 -
Moselhi, O. (1993). Schedule compression using the direct stiffness method. Can. J. Civ. Engrg., 20, 65-72. http://dx.doi.org/10.1139/l93-007
Prager, W. (1963). A structural method of computing project cost polygons. Mgmt. Sci., 9(3), 394-404. http://dx.doi.org/10.1287/mnsc.9.3.394
Siemens, N. (1971). A simple CPM time-cost tradeoff algorithm. Mgmt. Sci., 17(6), B-354-363. http://dx.doi.org/10.1287/mnsc.17.6.B354
Yager, R. R. (1981). A procedure for ordering fuzzy subsets of the unit interval. Information Science, 24, 143-161. http://dx.doi.org/10.1016/0020-0255(81)90017-7
Zheng, D. X. M., Ng, S. T., & Kumaraswamy, M. M. (2004). Applying a genetic algorithm-based multiobjective approach for time-cost optimization. Journal of Construction Engineering and Management, 130(2), 168-176. http://dx.doi.org/10.1061/(ASCE)0733-9364(2004)130:2(168)
Journal of Industrial Engineering and Management, 2012 (www.jiem.org)
El artículo está con Reconocimiento-NoComercial 3.0 de Creative Commons. Puede copiarlo, distribuirlo y comunicarlo públicamente
siempre que cite a su autor y a Intangible Capital. No lo utilice para fines comerciales. La licencia completa se puede consultar en