Modification of the Fast Global
K
-means Using a Fuzzy Relation with Application in
Microarray Data Analysis
Z. Shaeiri a, R. Ghaderi*b
a Department of Electrical and Computer Engineering, Babol Nooshirvani University of Technology, Babol, Iran b Department of Electrical and Computer Engineering, Babol Nooshirvani University of Technology, Babol, Iran
P A P E R I N F O
Paper history:
Received 6 June 2012
Accepted in revised form 30 August 2012
Keywords:
Gene Expression Data Clustering Global K-means Algorithm Fuzzy Entropy Measure
A B S T R A C T
Recognizing genes with distinctive expression levels can help in prevention, diagnosis and treatment of the diseases at the genomic level. In this paper, fast Global k-means (fast GKM) is developed for clustering the gene expression datasets. Fast GKM is a significant improvement of the k-means clustering method. It is an incremental clustering method which starts with one cluster. Iteratively new clusters are added. Since in each epoch, all data points are examined for the next cluster center, it is believed that fast GKM attains a near global solution. In the gene expression clustering problem, genes with significant differential expression levels, across the output disease classes, are important for the accurate classification of samples. Thus a fuzzy entropy measure which is designated based on maximum within class and minimum between class relevance is exerted in to the search procedure of the fast GKM. As a result, the search procedure of the proposed method is conducted in such a way to provide clusters which assembles the most discriminative genes closer to their centers. Therefore, capacity of the fast GKM which is its ability to find global clusters is managed in a profitable way. To demonstrate the usefulness of the proposed method, three published microarray datasets are used: Leukemia, Prostate, and Colon. Classification results are found robust and accurate using three public classification methods: K-NN, SVM, and Naïve Bayesian.
doi:10.5829/idosi.ije.2012.25.04c.03
1. INTRODUCTION1
To handle the vast amounts of data that are rapidly generated, exploratory data analysis methods such as clustering methods are being increasingly popular [1]. In biomedical and pharmaceutical researches, with typical examples including gene expression microarray data analysis [2-4], functional genomic data mining [5], functional MRI image analysis [6] and etc, application of clustering methods is ubiquitous. In particular, DNA microarray data allow monitoring the expression levels of thousands of genes under several experimental conditions. A gene expression data can be viewed as a data matrix, with each row corresponding to one condition/sample and each column corresponding to one gene/feature. Each entry of this data matrix is the expression level of a gene under corresponding condition. Among the overwhelming number of genes, only a fraction of them is important in biomedical
*Corresponding Author Email:[email protected] (R. Ghaderi)
viewpoint. Beside, many conventional classifiers are developed in such a way that cannot handle a huge number of features. For this, feature selection and feature clustering methods are often used to reduce the data dimensionality in gene expression datasets [7]. Clustering can be used to group genes which share similar expression patterns. Based on similarity between objects, several clustering methods have been introduced in the literatures [8]. They are often roughly divided in two categories: partitional methods such as k -means, Kohonen’s self organizing maps (SOM) and hierarchical approaches such as decision trees (like C4.5) and Random forests [9-11]. In hierarchical clustering (HC), clusters are generated successively based on previously generated clusters in an agglomerative (bottom-up, clumping) or divisive (top-down, splitting) procedure. In HC a tree called the dendrogram is used to represent how the objects are similar. HC has been extensively applied in gene expression data clustering [12-13]. In the partitional clustering, clusters are defined all at a time based on
some criterion without using any hierarchical structure.
k-means is one example of the partitional clustering methods which has been successfully used in gene expression data clustering [14]. It usually starts with K
randomly selected cluster centers. Iteratively, the cluster centers are updated and moved toward the optimal cluster centers. In the k-means algorithm the resulting cluster centers are not unique. They vary depending on the choice of the starting point for the cluster centers. Thus no satisfactory robustness is observed in the further classification task. Requiring a predefined number of clusters, K, which has to be preset, using the hidden natural structure of the dataset, is another drawback of the k-means clustering method. The Fuzzy counterpart of the k-means clustering, is the Fuzzy c -means (FCM) clustering, which was proposed by Bezdek [15]. FCM allows the data points to be associated with all clusters with a degree of membership. It relaxes the hard clustering of k-means and it makes the clusters much believable and almost more accurate especially in the boundary region of each cluster.
The global k-means algorithm which first was proposed in reference [16], is one of the modified versions of the k-means algorithm. It is also an iterative algorithm. In GKM new clusters are generated iteratively until a predefined number of clusters is achieved. Taking in to account all the data points as the cluster center for the k-th cluster in each epoch, a near global solution is achieved. Although it has been shown that GKM is an improved version of the k-means, its applicability is limited. It’s very time consuming because of N applications of the k-means in each epoch (N is the number of data points to be clustered). Therefore, it is not applicable for middle-sized and large datasets. To reduce the complexity of the GKM two methods have been proposed. We consider one of them, the fast GKM method, which is applicable to large datasets. In the fast GKM method instead of applying the k-means N times in each epoch, an upper bound is exerted into the criterion function. As a result, the time and space requirements are decreased. Fast GKM is less sensitive to initialization in comparison with the k -means clustering, and is faster in comparison with the GKM clustering. In this paper a modified version of the fast GKM is introduced. A fuzzy entropy relation is used to guide the choice of the new cluster center in each epoch. To some extent, it can be comparable with the FCM as both improve the k-means using fuzzy principals, but there are some differences; FCM starts with c clusters while the proposed method starts with one cluster. In FCM all data points have a degree of membership in all clusters but in the proposed method, like the k-means, any data point is associated with only one cluster. The results show that the proposed method is more accurate and more robust in comparison with
the k-means, the global k-means, and the fast global k -means methods. The rest of the paper is as follows: in the next section the details of the k-means, the GKM, and the fast GKM algorithms are presented. In section 3 the modified GKM is introduced. Section 4 includes the experimental results and section 5 concludes this paper.
2. K-MEANS AND THE GLOBAL K-MEANS
One of the well-known and basic partitional clustering algorithms is the k-means algorithm. Having influence on many other clustering methods, this algorithm is one of the staple and very popular clustering algorithms. Suppose that a finite set of data points
1 2
{ , ,..., N}
X = x x x in the f dimensional space is given,
where f
i
x ÎR . k-means is an iterative clustering algorithm and successively seeks for the optimal clusters by minimizing the sum-of-squared-error criterion function below:
2
1 1
( , ) K N
k ij i j
j i
J W M w x m
= =
=å å - (1)
In which:
{ ij}
W = w ,
1 0
i ij
if x cluster j w
otherwise
Î ì
= í î
,
1
1 K
ij j
w i
= = "
å
,1 2
[ , ,..., K]
M = m m m , is the cluster center matrix, and
1
(1 ) N
j j ij i
i
m N w x
=
=
å
is the center of the j-th cluster with Nj objects. The k-means algorithm proceeds as follows:v Choose K arbitrary data points for the K cluster centers, (not necessarily belonging to X).
v Allocate data points to their nearest cluster center and produce K clusters from X.
v Recompute the cluster centers, using the criterion function, and go back to step 2 and continue until no more data points change their clusters.
Using a hill-climbing approach for finding the clusters, k-means suffers from some drawbacks such as easy getting in to the local minima, and sensitivity to the initialization. Requiring the number of clusters to be predetermined is another drawback of the k-means.
number of the clusters. Details of the GKM are as follows:
v Set c = 1 and compute the mean of the set X :
1 1
1 N
i i
i
m x x X
N =
=
å
Îv Let c = c + 1, if c > K then stop, otherwise go to the next step.
v Consider the c – 1 previously made cluster centers
1, 2,..., c1
m m m- , check all the data points
1 2
( ,x x ,...,xN) as a candidate for the c-th cluster
center. Apply the k-means algorithm to each of them and choose the best clusters and their centers
,1, ,2, ..., ,( 1), ,
new new new c new c
m m m - m .
v Set mi =mi new, and go back to step 2.
As in the GKM, in each epoch, every data point is considered as the k-th cluster center; a near global solution is expected [17]. However, because of the application of the k-means in a couple of times, in each iteration, this algorithm is very time consuming and is not efficient for high dimensional datasets. Two methods have been proposed to reduce the computational time. We describe here only one of them, the fast GKM method, which is applicable for high dimensional datasets.
Consider the c – 1 clusters obtained so far, and the corresponding value of the criterion function
*
1 ( ,[ ,1 2,..., 1])
c c c
J - =J W m m m- in Equation (1). Instead of
applying the k-means for each data point, the fast GKM method computes an upper bound on *
c
J :
* *
1
c c i
J £J - -r (2)
where:
2 1
1
max{0, }, 1, 2,...,
N
j
i c i j
j
r l- x x i N
=
=
å
- - = (3)The j1 c
l - is the distance between j-th data point and its
nearest cluster center among the c – 1 cluster centers which are obtained so far. For each data point,
r
i is computed.r
i shows the value by which the criterion function defined in Equation (1) decreases ifx
i is chosen as the c-th cluster center. The data point with maximumr
i is chosen as the c-th cluster center.3. THE MODIFIED GKM METHOD FOR GENE EXPRESSION DATA CLUSTERING
The main contribution of this paper is a modification to improve the cluster validity of the fast GKM method clustering. As it is known, proceeding of the k-means, the global k-means, and the fast global k-means are all based on solving the optimization problem defined in Equation 1. This optimization is based on minimizing the distance between within cluster objects. When applied to gene expression datasets for dimensionality reduction purposes, the fast GKM method easily and rapidly find a predefined number of clusters of genes. The genes in each cluster are similar to each other, but there is no guarantee that they are able to be effective and informative for further classification tasks. In Figure1, two of the ten clusters containing four genes which are found by the fast GKM method, are shown. As can be seen, in these clusters, genes are very coherent and similar in terms of their expression levels. However, they are not differentially expressed across the output classes to be efficient and effective for the classification.
0 10 20 30 40 50 60 70 80 -1000
0 1000 2000 3000 4000 5000 6000 7000 8000 9000
Data Point
E
x
pr
e
ss
ion
Le
v
el
,
O
ut
pu
t
C
la
ss
es
gene 1 gene 2 gene 3 gene 4 Class Lables
0 10 20 30 40 50 60 70 80 -200
0 200 400 600 800 1000 1200 1400 1600
Data Point
E
x
pr
es
si
on
L
ev
el
,
O
u
tp
ut
C
la
ss
es
gene 1 gene 2 gene 3 gene 4 Class Lables5
Figure 1. Two clusters found by the fast GKM method for Leukemia dataset. It may be considerable that in each cluster, there are
To improve the ability of the fast GKM method to be able to produce the clusters with sufficiently differentially expressed features, in this regard genes, a modification based on a fuzzy entropy relation is proposed [18]. The only parameter that has to be adjusted is a fuzzy neighborhood distance,α , which can be derived automatically from the dataset.
3. 1. Fuzzy Relation Matrix Let X be a nonempty
finite set of N real-valued data points with F features as in (4). A fuzzy entropy relation matrix M(R) on X is proposed as follows:
1
1 1
1
F
F
N N
x x
X
x x
æ ö
ç ÷
= ç ÷
ç ÷
è ø
K M O M
L
(4)
1
1 1
1
( )
F
F
N N
e e
M R
e e
æ ö
ç ÷
= ç ÷
ç ÷
è ø
K M O M
L
(5)
In which:
0 ,
1 ,
1, 2,..., , 1, 2,...,
f f f
j i j
f f f
i i j f f f
j i j
j
x x x
e x x
x x x
f F i j N
a
a a
ì " - ³
ïï
=í æ - ö
ç - ÷ " - <
ï ç ÷
ï è ø
î
= =
å
(6)where α is a predefined fuzzy neighborhood parameter. Feature f is sufficiently differentially expressed feature, if for each i and all j of between class data points, f
i
e is close to zero and for each i and all j of the within class data points it is close to one. For every feature, the sums of f
i
e of between class, Efb , and within class data points, Efw are computed as follows:
1
1, 2,..., w
N f
fw i
i
E e f F
=
=
å
= (7)1
1, 2,..., b
N f
fb i
i
E e f F
=
=
å
= (8)The number of within class data points is Nw, and Ef w is the sums of f
i
e over all of them. The number of beetween class data points is Nb, and Efb is the sums of
f i
e over all of them. It is clear that N =Nb +Nw. Features with higher value of Efw and smaller value of
fb
E are significant choices for the classification.
3. 2. Modiied Fast GKM Given a gene expression
data matrix containing N data points and F genes as in Equation (4), the proposed method proceeds as follows:
Step 1: Set c = 1 and compute the mean of all genes in the set X as the first cluster center:
1 1
1 F
i i
i
m x x X
F =
=
å
ÎStep 2: Let c = c + 1, if c > K then stop, otherwise go to the next step. (K is a predefined number of clusters)
Step 3: Consider the c – 1 cluster centers obtained so far, m m1, 2,...,mc-1. For each gene, calculate the rf defined in Equation 3. Then for each
gene, compute the Erf as follows:
f w
f f
f w f b
E
E r r
E E
æ ö
=ç + ÷´
è ø (9)
Compute Ermax =max(Erf ),f =1, 2, ...,F and
choose the gene with the largest value of Erf for
the next cluster center.
Step 4: Refine the clusters by applying the k-means algorithm to solve the k-partition problem. Take the refined cluster centers:
,1, ,2, ..., ,( 1), ,
new new new c new c
m m m - m .
Step 5: Set mi =mi new, and go back to step 2.
4. EXPERIMENTS ON GENE EXPRESSION DATASETS
The performance evaluation of the proposition is done, using three published micro array datasets: Leukemia [19], Colon [20], and Prostate [21]. Details of the datasets are presented in Table 1.
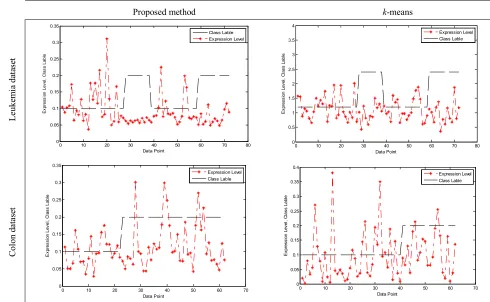
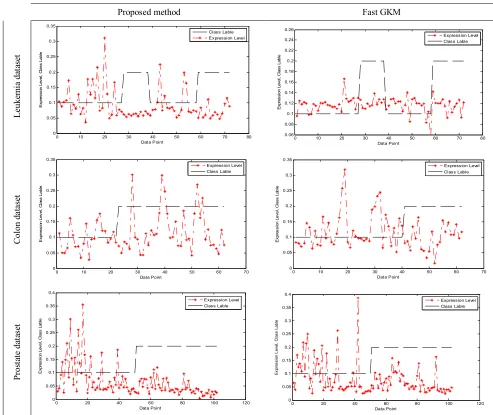
After running the proposed clustering method on the datasets, K (a predefined parameter) clusters are obtained. From each cluster, five top genes are selected (five genes with minimum distance to their cluster centers). As a result, the dimensionality of the datasets was reduced significantly. In Figure 2 and 3, one of the top genes selected with the proposed clustering method is compared with that of the k-means and the fast GKM methods. As can be observed, in the proposed method, there is a meaningful correlation between the top gene and the output class labels. It is expected because of imposing theterm Efw (Efw +Efb) in to the searching
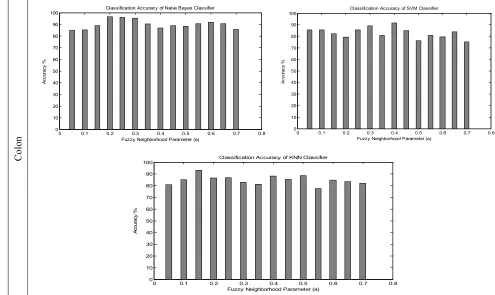
implied that, changing α has little influence on the classification performance of the Leukemia dataset. For the prostate and colon datasets the classification performance of the Naïve Bayesian and SVM classifiers are somehow sensitive to α. Naïve Bayesian classifier discriminates the samples based on maximum a posteriori probability, while considering the features independent. Thus, dependency among features can increase the number of misclassified samples. The proposed clustering method doesn’t absolutely and directly seek the independent features. Its search procedure to find a cluster center is based on two different and maybe independent criteria: rf and
( )
fw fw fb
E E +E . Among them rf doesn’t take in to
consideration the independency of features. It shows the amount one can reduce the criterion function defined in Equation 1, if f is chosen as the k-th cluster center. Therefore, using the Naïve Bayesian classifier, some misclassified data points are expected. There is no difference taking a large or small value for α. SVM classification is based on searching for the optimal separating hyper plane which maximizes the margin between two classes. A small value of α means that the between class separation and within class correlation is stronger. Taking a proper value for α, the reduced dataset would be a linearly separable set. SVM classifier
can find a unique optimal hyper plane for which the margin between the projections of the training points of the two different classes is maximized. KNN classifier has a similar reaction to changing α. KNN classifies the data points using a majority voting procedure of the K
nearest neighbors data points. Thus, a proper value for α can produce features considerably compatible to the ability of KNN to find the output classes. Table 2 contains the simulation results of the comparison between the proposed method, k-means, and the fast GKM methods. It can be seen that the proposed clustering method can outperform the previous similar methods.
TABLE 1. Summary of the gene expression datasets used for
classification
Gene expression dataset # Samples # Features # Classes
Leukemia 72 7129 2
Prostate 102 12600 2
Colon 62 2000 2
Proposed method k-means
L
euk
em
ia
d
at
as
et
0 10 20 30 40 50 60 70 80
0 0.05 0.1 0.15 0.2 0.25 0.3 0.35
Data Point
E
xpres
si
on
Le
ve
l,
Cla
ss
Lable
Class Lable Expression Level
0 10 20 30 40 50 60 70 80
0 0.5 1 1.5 2 2.5 3 3.5 4
Data Point
E
xp
re
ss
ion
Le
ve
l,
C
la
ss
La
b
le
Expression Level Class Lable
C
ol
on
d
at
as
et
0 10 20 30 40 50 60 70
0 0.05 0.1 0.15 0.2 0.25 0.3 0.35
Data Point
E
xp
ress
ion
L
eve
l,
C
la
ss
L
ab
le
Expression Level Class Lable
0 10 20 30 40 50 60 70
0 0.05 0.1 0.15 0.2 0.25 0.3 0.35 0.4
Data Point
E
xp
re
ss
ion
Le
ve
l,
C
lass
L
a
ble
Pr os ta te d at as et
0 20 40 60 80 100 120
0 0.05 0.1 0.15 0.2 0.25 0.3 0.35 0.4 Data Point E xp re s si on Le ve l, C la ss La b le Expression Level Class Lable
0 20 40 60 80 100 120
0 0.05 0.1 0.15 0.2 0.25 Data Point E xp re ss ion Le ve l, C la s s Lab le
Express ion Level Class Lable
Figure 2. Nearest gene to the first cluster center, found by the k-means, right, and found by the proposed method, left. The
gene which is selected using the k-means doesn’t change significantly in the time spots, while the selected gene of the proposed
method has a meaningful correlation with the output classes and therefore can be effective for classification procedure. (The expression levels are being normalized.)
Proposed method Fast GKM
L euk em ia d at as et
0 10 20 30 40 50 60 70 80
0 0.05 0.1 0.15 0.2 0.25 0.3 0.35 Data Point E xp ress ion Le ve l, C lass L a ble Class Lable Expression Level
0 10 20 30 40 50 60 70 80
0.06 0.08 0.1 0.12 0.14 0.16 0.18 0.2 0.22 0.24 0.26 Data Point E xp re s si o n Le ve l, C la ss Lab le Expression Level Class Lable C ol on d at as et
0 10 20 30 40 50 60 70
0 0.05 0.1 0.15 0.2 0.25 0.3 0.35 Data Point E xp re ss ion Le v el, C la ss L a ble Expression Level Class Lable
0 10 20 30 40 50 60 70
0 0.05 0.1 0.15 0.2 0.25 0.3 0.35 Data Point E xp re s si on L eve l, C lass La b le Expression Level Class Lable Pr os ta te d at as et
0 20 40 60 80 100 120
0 0.05 0.1 0.15 0.2 0.25 0.3 0.35 0.4 Data Point E xp re s si on Le ve l, C la ss La b le Expression Level Class Lable
0 20 40 60 80 100 120
0 0.05 0.1 0.15 0.2 0.25 0.3 0.35 0.4 Data Point E xp re ss ion L ev el, C la ss Lab le Expression Level Class Lable
Figure 3. Nearest gene to the first cluster center, found by the fast GKM, right, and the proposed method, left. (The expression
Le
uk
emia
0 0.1 0.2 0.3 0.4 0.5 0.6 0.7 0.8
0 10 20 30 40 50 60 70 80 90 100
Fuzzy Neighborhood Parameter (a)
A
cc
ur
acy
%
Classification Accuracy of Naive Bayes Classifier
0 0.1 0.2 0.3 0.4 0.5 0.6 0.7 0.8
0 10 20 30 40 50 60 70 80 90 100
Fuzzy Neighborhood Parameter (a)
A
cc
ur
ac
y
%
Classification Accuracy of SVM Classifier
0 0.1 0.2 0.3 0.4 0.5 0.6 0.7 0.8
0 10 20 30 40 50 60 70 80 90 100
Fuzzy Neighborhood Parameter (a)
A
cc
ur
acy
%
Classification Accuracy of KNN Classifier
Pro
sta
te
0 0.1 0.2 0.3 0.4 0.5 0.6 0.7 0.8
0 10 20 30 40 50 60 70 80 90 100
Fuzzy Neighborhood Parameter (a)
A
cc
ur
acy
%
Classification Accuracy of Naive Bayes Classifier
0 0.1 0.2 0.3 0.4 0.5 0.6 0.7 0.8
0 10 20 30 40 50 60 70 80 90 100
Fuzzy Neighborhood Parameter
A
cc
u
ra
cy
%
Classification Accuracy of SVM Classifier
0 0.1 0.2 0.3 0.4 0.5 0.6 0.7 0.8 0
10 20 30 40 50 60 70 80 90 100
Fuzzy Neighborhood Parameter (a)
A
cc
ur
acy %
Co
lon
0 0.1 0.2 0.3 0.4 0.5 0.6 0.7 0.8
0 10 20 30 40 50 60 70 80 90 100
Fuzzy Neighborhood Parameter (a)
A
cc
ur
acy
%
Classification Accuracy of Naive Bayes Classifier
0 0.1 0.2 0.3 0.4 0.5 0.6 0.7 0.8
0 10 20 30 40 50 60 70 80 90 100
Fuzzy Neighborhood Parameter (a)
A
cc
ur
acy
%
Classification Accuracy of SVM Classifier
0 0.1 0.2 0.3 0.4 0.5 0.6 0.7 0.8
0 10 20 30 40 50 60 70 80 90 100
Fuzzy Neighborhood Parameter (a)
A
cc
ur
acy
%
Classification Accuracy of KNN Classifier
Figure 4. Classification performance of the proposed method, using Naïve Bayes, SVM, and KNN classifiers.
TABLE 2. Classification accuracy of SVM, Naïve Bayes, and KNN classifiers.
Method / Dataset Leukemia Prostate Colon
k-means
KNN 80.75 70 75
SVM 85.53 76 85.23
NB 84.28 73.27 66
Fast GKM
KNN 90.35 64.5 77.3
SVM 90 78.43 82.68
NB 87.32 73.32 83.64
Proposed method
KNN 100 (α=0.1) 100 (α=0.1) 93 (α=0.15)
SVM 100 (α=0.2) 92 (α=0.55) 95.23 (α=0.4)
NB 100 (α=0.2) 91.5 (α=0.55) 97.12 (α=0.2)
5. CONCLUSION
A modified version of the fast global k-means (fast GKM) clustering method for clustering the gene expression datasets is proposed. The fast GKM algorithm is a modified version of the k-means algorithm. It is an iterative algorithm which starts with one cluster containing the whole data points. Its
datasets. Genes with no considerable changes during the experiments are often redundant because of having no interesting information. In this paper a modified version of the GKM is proposed. A fuzzy entropy relation is used to control the selection of new cluster centers in each epoch. The experimental results are found accurate and robust in comparison with some similar clustering methods.
6. REFERENCES
1. Xu, R. and Wunsch, D.C., "Clustering algorithms in biomedical research: A review", IEEE Reviews in Biomedical
Engineering, Vol. 3, (2010), 120-154.
2. Newman, A.M. and Cooper, J.B., "AutoSOME: A clustering method for identifying gene expression modules without prior knowledge of cluster number", BMC Bioinformatics, Vol.11(117),(2010), 1-48.
3. Au, W.H., Chan, K.C.C., Wong, A.K.C. and Wang, Y., "Attribute clustering for grouping, selection, and classification of gene expression data", IEEE Transactions on Computational
Biology and Bioinformatics, Vol.2, (2004), 83-101.
4. Baya, A.E. and Granitto, P.M., "Clustering gene expression data with a penalized graph-based metric", BMC Bioinformatics, Vol.12(2), (2011), 1-18.
5. Kohane, I.S., Kho, A.T. and Butte, A.J., "Microarrays for an integrative genomics", Londo, The MIT Press, (2003).
6. Cheng, Q., Zhou, H. and Cheng, J., "The Fisher-Markov selector: Fast selecting maximally separable feature subset for multiclass classification with application to high-dimmensional data", IEEE Transactions on Pattern Analysis and Machine
Intelligence,Vol.33(6), (2011), 1217-1233.
7. Montazer, G.A., "A new approach for knowledge-based systems reduction using rough sets theory", International Journal of
Engineering (IJE Transaction A), Vol.16(2),(2003), 157-162.
8. Duda, R.O., Hart, P.E. and Stork, D.G., "Pattern classification", New York, Wiley, (2001).
9. Hartigan, J., "Clustering algorithms", New York, Wiley, (1975). 10. Wang, H., Zheng, H. and Azuaje, F., "Poisson-based self-organizing feature maps and hierarchical clustering for serial
analysis of gene expression data", IEEE/ACM Transactions on
Computational Biology and Bioinformatics, Vol.4(2), (2007),
163-175.
11. Zhang, B. and Pham, T.D., "Phenotype recognition with combined features and random subspace classifier ensemble",
BMC Bioinformatics,Vol.12(128), (2011), 1-13.
12. Handl, J. and Kell, D.B., "Computational cluster validation in post genomic data analysis", BMC Bioinformatics, Vol.21, (2005), 3201-3212.
13. Tan, T.Z. and Quek, Ch., "A novel biologically and psychologically inspired fuzzy decision support system: hierarchical complementary learning", IEEE Transactions on
Computational Biology and Bioinformatics, Vol.5(1), (2008),
67-79.
14. Du, Z., Wang, Y. and Ji, Z., "PK-means: A new algorithm for gene clustering", Computational Biology,Vol.32, (2008), 243-247.
15. Bezdek, J., "Pattern recognition with fuzzy objective function algorithms", New York, Plenum, (1981).
16. Likas, A., Vlassis, M. and Verbeek, J., "The global k-means clustering algorithm", Pattern Recognition,Vol.36, (2003), 451-461.
17. Bagirov, A.M., "Modified global k-means algorithm for minimum sum-of-squares clustering problems", Pattern
Recognition,Vol.41, (2008), 3192-3199.
18. Hu, Q., Yu, D. and Xie, Z., "Information-preserving hybrid data reduction based on fuzzy-rough techniques", Pattern
Recognition letters,Vol.27, (2005), 414-423.
19. Golub, T.R., Slonim, D.K., Tamayo, P., Huard, C., Gaasenbeek, M., Mesirov, J.P., Coller, H., Loh, M.L., Downing, J.R., Caligiuri, M.A. and Bloomfield, C.D., "Molecular classification of cancer: class discovery and class prediction by gene expression monitoring", Science,Vol.286, (1999), 531-537. 20. Alon, U., Barkai, N., Notterman, D.A., Gish, K., Ybarra, S.,
Mack, D. and Levine, A.J., "Broad patterns of gene expression revealed by clustering analysis of tumor and normal colon tissues probed by oligonucleotide arrays", National Academy of
Sciences of the United States of America, Vol.96, (1999),
6745-6750.
Modification of the Fast Global
K
-means Using a Fuzzy Relation with Application in
Microarray Data Analysis
Z. Shaeiri a, R. Ghaderib
a Department of Electrical and Computer Engineering, Babol Nooshirvani University of Technology, Babol, Iran b Department of Electrical and Computer Engineering, Babol Nooshirvani University of Technology, Babol, Iran
P A P E R I N F O
Paper history:
Received 6 June 2012
Accepted in revised form 30 August 2012
Keywords:
Gene Expression Data Clustering Global K-means Algorithm Fuzzy Entropy Measure
هﺪﯿﮑﭼ
نژﻦﯿﯿﻌﺗ
ﻪﻧﻮﻤﻧردﻪﮐﯽﯾﺎﻫ
ﯽﻣ،ﺪﻨﺘﺴﻫﯽﻗاﺮﺘﻓانﺎﯿﺑيارادﻒﻠﺘﺨﻣيﺎﻫ
يرﺎﻤﯿﺑنﺎﻣردوﺺﯿﺨﺸﺗ،يﺮﯿﮔﻮﻠﺟردﺪﻧاﻮﺗ
ردﺎﻫ
دﻮﺷﻊﻗاوﺪﯿﻔﻣﯽﻧژﺢﻄﺳ
.
ﻢﺘﯾرﻮﮕﻟا،ﻪﻟﺎﻘﻣﻦﯾارد
Global k-means (GKM)
ﻪﺷﻮﺧياﺮﺑ،ﻊﯾﺮﺳ
هداديﺪﻨﺑ
نﺎـﯿﺑيﺎﻫ
ﺒﻬﺑﯽﻧژ
ﯽﻣهداددﻮ
دﻮﺷ
.
يﺪﻨﺑﻪﺷﻮﺧ
GKM
ﻪﺨﺴﻧزاﯽﮑﯾﻊﯾﺮﺳ
ﻪﺘﻓﺎﯾدﻮﺒﻬﺑيﺎﻫ
ﻪﺷﻮﺧي
يﺪﻨﺑ
k-means
ﺖﺳا
. ﻦـﯾارد
ﯽﻣﻒﯾﺮﻌﺗﻪﺷﻮﺧﮏﯾلوامﺎﮔردهﺪﻧﻮﺷراﺮﮑﺗﻢﺘﯾرﻮﮕﻟا
دﻮﺷ
.
ﯽﻣﻪﻓﺎﺿاﻪﺷﻮﺧﮏﯾيﺪﻌﺑمﺎﮔﺮﻫرد
ددﺮﮔ
.
ياﺮﺑمﺎﮔﺮﻫرد
ﻪﺷﻮﺧﺰﮐﺮﻣبﺎﺨﺘﻧا
ﻪﻧﻮﻤﻧمﺎﻤﺗيﺪﻌﺑي
هداديﺎﻀﻓيﺎﻫ
رﺮﺑﺎﻫ
ﯽﻣﯽﺳ
ﺪﻧﻮﺷ
.
ﻪﺑﮏﯾدﺰﻧﯽﺨﺳﺎﭘيارادﻢﺘﯾرﻮﮕﻟاﻦﯾاﻦﯾاﺮﺑﺎﻨﺑ
ﻪﻨﯿﻬﺑﺦﺳﺎﭘ
ﺖﺳاﯽﻠﮐي
.
ﻪﺷﻮﺧﺚﺤﺑرد
نژيﺪﻨﺑ
نژ،ﺎﻫ
ﻪﻧﻮﻤﻧنﺎﯿﻣردﻪﮐﯽﯾﺎﻫ
ﻪﻧﻮﻤﻧﺎﯾوﻢﻟﺎﺳورﺎﻤﯿﺑيﺎﻫ
عاﻮـﻧاﺎـﺑيﺎﻫ
ﯽﻣﺖﯿﻤﻫاياراد،ﺪﻨﺘﺴﻫﯽﻬﺟﻮﺗﻞﺑﺎﻗﯽﻗاﺮﺘﻓانﺎﯿﺑحﻮﻄﺳياراد،يرﺎﻤﯿﺑﮏﯾﻒﻠﺘﺨﻣ
ﺪﻨﺷﺎﺑ
.
ﻪﺟﻮﺗﺎﺑ
ﻦﯾارد،عﻮﺿﻮﻣﻦﯾاﻪﺑ
ﻪﺷﻮﺧدﻮﺒﻬﺑﺖﻬﺟﻪﺘﺷﻮﻧ
يﺪﻨﺑ
GKM
ﻪﻄﺑارﮏﯾ،ﻊﯾﺮﺳ
ﯽﻣهدﺎﻔﺘﺳايزﺎﻓﯽﭘوﺮﺘﻧآي
دﻮﺷ
.
ﻪﺷﻮﺧترﺪﻗشورﻦﯾاﺎﺑ
يﺪﻨﺑ
GKM
ﻪﻣﺎﻧﺮﺑ،رﻮﺑﺰﻣدﺮﺑرﺎﮐﺖﻬﺟردﻊﯾﺮﺳ
ﯽﻣﺖﯾاﺪﻫويﺰﯾر
دﻮﺷ
.
هدادﻪﻋﻮﻤﺠﻣﻪﺳ،ﺞﯾﺎﺘﻧندادنﺎﺸﻧﺖﻬﺟ
نژنﺎﯿﺑي
ﯽﻣراﺮﻗهدﺎﻔﺘﺳادرﻮﻣﻦﻟﻮﮐوتﺎﺘﺳوﺮﭘ،ﯽﻤﮐﻮﻟ
ﺪﻧﺮﯿﮔ
.
ﻪﻘﺒﻃﺞﯾﺎﺘﻧسﺎﺳاﺮﺑ،يدﺎﻬﻨﺸﯿﭘشوريراﺪﯾﺎﭘوﺖﻗددﻮﺒﻬﺑ
ﺎﺑيﺪﻨﺑ
لواﺪﺘﻣشورﻪﺳ
SVM
،
Naïve Bayesian
و
KNN
شورﻪﺑﺖﺒﺴﻧ
ﯽﻣﻪﺟﻮﺗﻞﺑﺎﻗ،ﻦﯿﺸﯿﭘﻪﺑﺎﺸﻣيﺎﻫ
ﺪﺷﺎﺑ
.
doi:10.5829/idosi.ije.2012.25.04c.03