Abstract—To better understand the regulatory role of nucleosomes, it is important to pinpoint their positions in the DNA sequence. In this paper, we present a pattern recognition algorithm to predict the locations of nucleosomes. Based on a number of features of the nucleosomal architecture, a computational framework based on the probabilistic relaxation labeling technique is developed to infer the nucleosome centers along the DNA sequence of simian virus 40 (SV40). Using this method, we can detect about 70% of the SV40 nucleosome locations with high probability (> 0.9). The proposed algorithm improves the flexibility and efficiency in nucleosome positioning, and makes it easy to analyze nucleosome structure without expensive wet-lab biological experiments. Our results show that the framework is practicable and has potential in its applications. In fact, only the significant periodicity of DNA dinucleotides is employed in our current algorithm as a nucleosomal feature. We believe that more pattern recognition techniques can be developed to improve the prediction accuracy of nucleosome positions by employing more sequence features.
Index Terms—DNA sequence analysis, sequence periodicity, nucleosome positioning, pattern recognition, relaxation labeling, simian virus 40 (SV40) chromatin.
I. INTRODUCTION
DNA in a eukaryotic cell is packaged repetitively into nucleosomes by means of extensive association with histone proteins. Each nucleosome is composed of about 147 base-pairs (bp) of DNA, which are sharply bent and tightly wrapped around a histone octamer. This sharp bending occurs at every DNA helical repeat (~10.5 bp). In this structure, the major groove of the DNA faces inwards towards the histone octamer, while in the opposite direction and ~5 bp away, the major groove faces outward. DNA sequence bending in each direction is facilitated by specific dinucleotides. Neighboring nucleosomes are separated from each other by10 to 50 bp long stretches of unwrapped linker DNA. Thus, 75–90% of genomic DNA is wrapped in nucleosomes [1]. Nucleosome positioning can affect the accessibility of the underlying DNA to the nucleosome environment and as such may play an essential role in
Manuscript received January 28, 2009. This work is supported in part by the Hong Kong Research Grant Council (Project 123408).
Hongya Zhao is with the Department of Electronic Engineering, City University of Hong Kong, Tat Chee Avenue, Kowloon, Hong Kong (e-mail: [email protected]).
Hong Yan is with the Department of Electronic Engineering, City University of Hong Kong, Tat Chee Avenue, Kowloon, Hong Kong, and the School of Electrical and Information Engineering, University of Sydney, NSW 2006, Australia (e-mail: [email protected]).
protein-DNA recognition, DNA replication, and gene regulation in cellular processes. Nucleosome formation and positioning depend on intrinsic properties of the DNA sequence such as flexibility or natural bending of the adjacent base pairs [2].
Recently, much research has been carried out to elucidate the nucleosome positioning that determines the preference of a particular region to bind to histones and form a nucleosome [2-7]. For example, the CA dinucleotide has been shown to be important for nucleosome positioning, and the decamer TATAAACGCC has a high affinity for histones [3]. TGGA repeats impair nucleosome formation, and poly (dA:dT) has been shown to increase the accessibility of transcription factors bound to nearby sequences [8]. It is well known that DNA containing short AT-rich sequences spaced by an integral number of DNA turns is the easiest to bend around the nucleosome (Alberts 2002). There is evidence of a periodic repeat every 10.2 bases of the dinucleotides AA and TT in nucleosome forming sequences, and a ~10-bp periodicity of AA/TT/TA dinucleotides that oscillate in phase with each other and out of phase with ~10-bp periodic GC dinucleotides has been demonstrated [2].
Based on the features of nucleosomal structure, we map the positioning problem to a relaxation labeling framework.
Relaxation labeling processes are widely used in many different domains including image processing, pattern recognition, and artificial intelligence [9-12]. They are iterative procedures that aim to reduce the ambiguity and noise effect to select the best labels for all objects. In the proposed algorithm for the prediction of nucleosome positions, we label the nucleosomal centers based on the periodicity of the dinucleotides in high resolutions (5 bp). The method is applied to the SV40 chromatin to identify nucleosome positions [13]. In comparison with the results obtained in many biological experiments published in the literature, our computational studies show that the algorithm is effective and efficient with high accuracy for the prediction of nucleosome positions.
II. PATTERN MATCHING BASED ON PROBABILISTIC RELAXATION LABELING
To estimate the nucleosome positions, the mathematical and computational framework based on the probabilistic relaxation labeling is established in this section. We first review the basic formulation of the relaxation labeling technique and then present the algorithm in combination with the typical features of nucleosomes.
Computational Analysis of Nucleosome
Positioning Signals in the Simian Virus 40
Chromatin
The relaxation labeling technique was first proposed for pattern classification in [9]. In a relaxation procedure, the contextual information is employed to classify a set of interdependent objects by allowing interactions among the possible classifications of related objects. Probabilistic relaxation has been successfully applied to many image processing tasks, such as scene labeling, pixel labeling, shape matching, line and curve enhancement, noise reduction, and handwritten character recognition [9-10]. The labeling process can also be regarded as a recurrent dynamical system [11]. Relaxation labeling also can also have useful applications to bioinformatics, similar to other pattern recognition techniques [12].
A nonlinear probabilistic relaxation model can be described as follows. In general, there are five parts in a labeling problem:
(1) A set of n objects: A = {a1, …, an} to be labeled or classified.
(2) A set of m labels: Λ = {λ1, …, λm}. A label is assigned to each object.
(3) The weight of influence on one object from other objects. We use dij to denote the influence coefficients of aifrom aj. These coefficients are normalized and satisfy the equation
1 1
n ij
j=d =
∑
.(4) For each pair of objects ai and aj, a compatibility coefficient matrix Rij with size m×m is defined. The element rij(λ, λ´) (λ, λ´∈Λ) of Rij represents the compatibility of labeling λ on object ai with λ´on object aj, which satisfies the condition
0 < rij(λ, λ´) ≤ 1 λ and λ´ are compatible;
rij(λ, λ´) = 0 λ and λ´ are independent; (1) −1 ≤ rij(λ, λ´) < 0 λ and λ´ are incompatible.
That is, the compatibility coefficient is positive if the labels are compatible and negative otherwise. (5) For each object ai, there is a set of initial probability
pi(0)(λ) (λ∈Λ) satisfying
∑
λ∈Λpi(0)( )
λ =1 where 0≤pi(0)(λ) ≤ 1.
A relaxation scheme, corresponding to a recurrent dynamical system, depends on the updating rule of the system [11]. In general, the updated probability for λ of ai at the (k+1)th iteration is
∑
∈Λ+ + + = ' ) ( ) ( ) ( ) ( ) 1 ( )] ' ( 1 )[ ' ( )] ( 1 )[ ( ) (
λ λ λ
λ λ λ k i k i k i k i k i q p q p
p
(2)
where ⎟ ⎠ ⎞ ⎜ ⎝ ⎛ =
∑
∑
Λ ∈ = ( , ') ( ') ) ( ( ) ' 1 )( λ λ λ λ
λ k j ij n j ij k
i d r p
q (3)
is called the updating correction.
The key factors in the relaxation scheme are the initial probability estimate pi(0)(λ) for label assignment and the calculation of the compatibility coefficients rij(λ, λ´). However, there are no general methods to solve these problems. We have mapped the procedure of nucleosome positioning into a relaxation framework that can deal with a high level of noise effectively. We have developed a robust method for the estimation of initial probabilities and
adjustment of compatibility coefficients. The strategies are described below.
In our framework, the nucleosomal centers {Ci: i=1, …, N} are considered as objects. Obviously, two possible labels λ0
and λ1 are assigned to each object and the objects labeled λ1
are inferred to be nucleosome centerswhile those labeled λ0
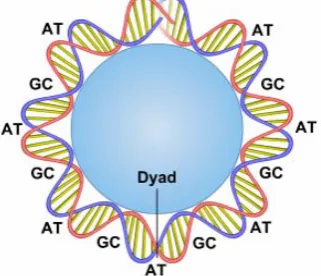
[image:2.595.356.517.304.442.2]are not. As prior knowledge, in the nucleosome structure, the length of a nucleosome is ~147 bp and the unwrapped linker DNA is ~10-50 bp. One of the most significant features in nucleosome positioning is the analysis of dinucleotides. They are the simplest sequence elements that can be used to capture the sequence-dependent mechanics of DNA bending that are essential for histone-DNA association [8]. All nucleosome and DNA interaction models exhibit distinctive sequence motifs that occur periodically along the DNA double helix and are known to facilitate the sharp bending of DNA around the protein histone. These include ~10-bp periodic AA/TT/TA dinucleotides that oscillate in phase with each other and out of phase with ~10-bp periodic GC dinucleotides, as illustrated in Figure 1.
Figure 1. A DNA sequence is wrapped around the protein histone to form a nucleosome.
For sequence-dependent modulations of nucleosomes, the periodicity of some dinucleotides should be closer to the real value f0 in a nucleosome. Therefore, it is reasonable to
employ the difference di between the experimental periodicity f1 and f0 as the measurement in the labeling
algorithm. One center may be labeled λ1 with a higher
probability than others if the periodicity of the dinucleotides in the nucleosome is closer to f0; and vice versa. More details
of the algorithm are discussed in the following application to SV40.
In the relaxation scheme, the initial probabilities of every object should be estimated first. However, there is no general method to calculate the probabilities. Base on the periodicity of dinucleotides in the sequence, we employ an empirical estimation of the difference di initial probabilities of the object Ci
( )
( )
( )
(
)
0 0 0 1 0 1 1 1 1 , i i Ti i j
j
p p
p H d d
T λ λ λ = ⎧ = − ⎪ ⎨ = ⎪ ⎩
∑
(4) where(
)
1 , 0 i j i j i j d dH d d
d d
< ⎧⎪
= ⎨ ≥
and T is the total number of objects in the sequence. Obviously according to Equation (4), the smaller the difference di is, the higher the initial probability
( )
0 1
i
p λ of
the gene labeled λ1.
When the initial probabilities of each object determined, we can calculate the compatibility coefficients based on statistical correlation [11]:
(
)
,(
( )
( ) ( )
( )
)
(
( )
'( )
')
, ''
i i i j j
i j ij
p p p p
r
λ λ λ λ
λ λ
σ λ σ λ
∈Γ − −
=
∑
(5)where pi(λ) is the initial probability of the ith object with label λ, pi
( )
λ and σ λ( )
are the mean and standarddeviation of pi
( )
λ respectively for all objects. Let Γi be theset of objects close to the ith object. Then, the jth object in Γi cannot be inferred as a nucleosomal center if ith object is already considered as a center because two nucleosome centers must be at least 147bp apart from each other.
Given the initial probabilities and compatibility coefficients, we can summarize the modified relaxation algorithm as follows:
Probabilistic relaxation labeling algorithm for nucleosome position prediction
Input: Seq: DNA sequence with the length N.
L: the half length of a nucleosome.
e_bp: error bases of centers in nucleosome positioning. f0: the real periodicity value of dinucleotides in the
literature.
K: the maximum number of iterations allowed in the labeling process.
P: the probability that the Ci can be inferred to be the nucleosomal center.
Output:Ω, the set of the nucleosomal centers with the error base e_bp.
Steps:
(1)Compute the periodicity value fiof the dinucleotides in the 2L sequence with the center at position Ci using the Fourier method.
(2)Compute difference di= | fi− f0 |.
(3)Estimate the initial probabilities pi(λ0) and pi(λ1) for each
object Ci in Seqaccording to Equation (4).
(4)Set ΓI = {j: i − L − e_bp: 1: i + L + e_bp } and compute the compatibility coefficients according to Equation (5). (5)For k = 1 to K ,
For i = 1 to N,
Compute the updating correction in Equation (3) with dij= (N +2e_bp)−1 for each object according to the following equation
(
, ')
( ') _ 2 1 ) ( ( ) ' )( λ λ λ λ
λ k i j ij k
i r p
bp e N q i
∑∑
Γ ∈ − =where k is the current number of iterations (1
≤
k
≤
K
).
Then update the labeling probabilities for each object as
∑
∈Λ+ + + = ' ) ( ) ( ) ( ) ( ) 1 ( )] ' ( 1 )[ ' ( )] ( 1 )[ ( ) (
λ λ λ
λ λ λ k i k i k i k i k i q p q p p
(6)Compute the mean of pi( )λ1 >1
(
i∈Wi)
where{
_ :1: _}
i
W = −i e bp i+e bp is the sliding window of length 2e_bp with the center Ci;
(7) _ : ( )1
i
i i W
i e bp mean p λ P
∈
⎧ ⎫
Ω = ±⎨ > ⎬
⎩ ⎭ is the output.
III. PREDICTION OF NUCLEOSOME POSITIONS IN THE SV40 CHROMATIN
We apply the algorithm proposed above to the DNA sequence of Simian Virus 40 Chromatin (SV40), which can be downloaded from the EMBL nucleotide Sequence Database http://www.ebi.ac.uk/ [13]. In the early research on nucleosome positioning, the structure of the SV40 chromatin is particularly intriguing since this system is often used as a model for eukaryotic chromosomes and since in the late phase of the infection cycles, a fraction of the mini-chromosomes, contains a nuclease-hypersensitive regulatory region that appears to be nucleosome-free [14]. Therefore, a number of SV40 nucleosomal experiments have been carried out [14-16]. There are many results in the literature related to SV40 such as the sequence periodicities, nucleosome locations and distributions. Therefore, the performance of our algorithm can be evaluated based on published experimental results.
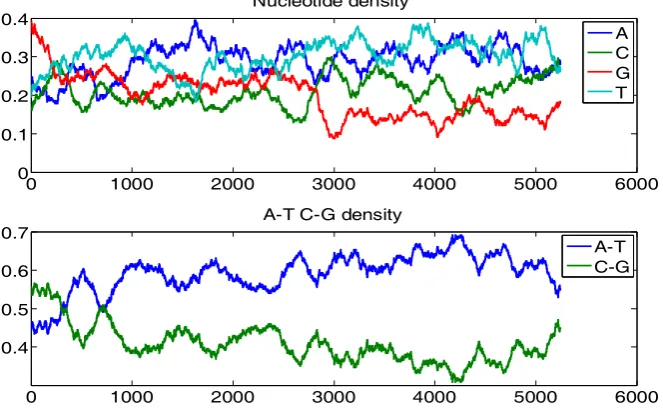
The entire sequence of SV40 contains N = 5243 base pairs, including 1518 As, 1100 Cs, 1039 Gs and 1586 Ts. Figure 2 shows the graphs of monomer densities and A – T and G – C. The x-axis is the nucleotide position and the y-axis the density of a monomer or the difference between two monomers. Obviously, the SV40 chromatin is A/T rich as known from the literature and observed from the diagrams [14].
Based on a number of conclusions from previous research of SV40, we perform our labeling algorithm with f0 = 10.2bp
periodic dinucleotide of AA/TT/TA and GC, L = 147, e_bp = 5, K = 5 and P = 0.95. First the fast Fourier transform (FFT) are used to calculate the periodicity of the dinucleotides [8]. The occurrences of the dinucleotides at each position are obtained by direct counting After the FFT, we only focus on the periodicities of 8 to 13 bp, which is the most significant range for the analysis [8]. The optimal periodicity of the dinucleotides is calculated by detecting the peak in the Fourier power spectrum. Figure 3 shows a demonstration of the FFT applied to a part of SV40 sequence to calculate the optimal periodicity of dinucleotides AA/TT/TA. The upper graph shows the power density as a function of frequency. The highest power density is attained at the frequency equal to 0.094 and thus the optimal periodicity is about 10.6 as demonstrated in the lower graph.
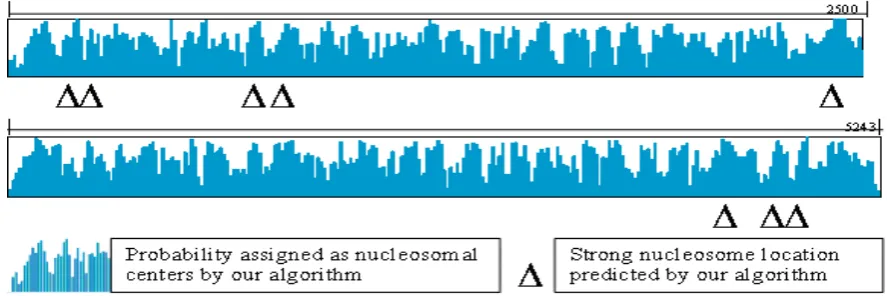
strong SV40 nucleosome location sites in [15], eight are located within 10-bp error with high probability (> 0.9) as shown in Figure 4. About 70% of nucleosomes are detected with high probability (> 0.9) for 29 weak SV40 nucleosome location sites. In fact, the strong and weak location sites have been determined based on the statistical results of the 400 cloned nucleosomal DNA fragments obtained from the shotgun cloning approach and digestion of SV40 chromatin with microacoccal nuclease [15]. The above results are very encouraging since they demonstrate that the nucleosome positions predicted from our computational approach agree well with those obtained experimentally. However, currently our computational algorithm only makes use of several well-known features of nucleosomes with the labeling technique to predict the nucleosomal centers. It may be possible to improve the prediction accuracy if more features are added to the method.
IV. CONCLUSION
We have developed a relaxing labeling framework for nucleosome position detection. The algorithm incorporates the nucleosome features with the technique of pattern recognition to predict the nucleosomal centers. In comparison with most methods in nucleosome positioning, our approach is developed based on computational analysis and does not require expensive wet-lab biological experiments. The proposed algorithm improves the flexibility and efficiency in nucleosome positioning research, and makes it easy to analyze nucleosome structures. Our results show that the computational framework is practicable and can have useful applications to other tasks of DNA sequence data analysis in general.
0 1000 2000 3000 4000 5000 6000
0 0.1 0.2 0.3
0.4 Nucleotide density
A C G T
0 1000 2000 3000 4000 5000 6000
0.4 0.5 0.6
0.7 A-T C-G density
[image:4.595.137.469.267.473.2]A-T C-G
Figure 2. Upper diagram: the normalized densities of monomers A, C, G and T. Lower diagram: the normalized densities of A− T and G − C. These diagrams show that the SV40 sequence is A/T rich.
0.1 0.2 0.3 0.4 0.5
0 100 200 300
8 9 10 11 12 13
0 100 200
[image:4.595.126.472.537.729.2]Figure 4. Nucleosome positions in the SV40 chromatin detected using our algorithm and comparison of the results with strong locations reported in literature.
REFERENCES
[1] T. J. Richmond, and C. A. Davey, “The structure of DNA in the nucleosome core,” Nature, vol. 423, 2003, pp. 145–150. [2] E. Segal, Y. Fondufe-Mittendorf, L. Chen, A. Thastrom, Y. Field,
I. K. Moore, J. Z. Wang, and J. Widom, “A genomic code for nucleosome positioning,” Nature, vol. 442, 2006, pp. 772–778. [3] H. E. Peckham, R. E., Thurman, Y. Fu, J. A. Stamatoyannopoulos,
W. S. Noble, K. Struhl, and Z. Weng, “Nucleosome positioning signals in genomic DNA,” Genome Research, vol.17, 2007, pp. 1170–1177.
[4] G. C. Yuan, Y. J. Liu, M. F. Dion, M. D. Slack, L. F. Wu, S. J. Altschuler, and O. J. Rando, “Genome-scale identification of nucleosome positions in S. cerevisiae,” Science, vol. 309, 2005, pp. 626–630.
[5] I. P. Ioshikhes, I. Albert, S. J. Zanton, and B. F. Pugh, “Nucleosome positions predicted through comparative genomics,”
Nature Genetics, vol. 38, 2006, pp. 1104–1105.
[6] V. Miele, C. Vaillant, Y. d'Aubenton-Carafa, C. Thermes, and T. Grange, “DNA physical properties determine nucleosome occupancy from yeast to fly,” Nucleic Acids Research, vol. 36, 2008, pp. 3746 –3756.
[7] M. Yassour, T. Kaplan, A. Jaimovich, and N. Friedman, “Nucleosome positioning from tiling microarray data,”
Bioinformatics, vol. 24, 2008, pp. 139–146.
[8] S. C. Satchwell, H. R. Drew, and A. A. Travers, “Sequence periodicities in chicken nucleosome core DNA,” J. Molecular Biology, vol. 191, 1986, pp. 659–675.
[9] A. Rosenfeld, R. Hummel, and S. Zucker, “Scene labeling by relaxation operations,” IEEE Trans. System Man Cybernetics, vol. 6, 1976, pp. 420–433.
[10] J. Kittler, and J. Illingworh, “A review of relaxation labeling, algorithm,” Image Vision Computing, vol. 3, 1985, pp. 158–189. [11] A. M. N. Fu, and H. Yan, “A new probabilistic relaxation method
based on probabilistic space partition,” Pattern Recognition, vol. 30, 1997, pp. 1905–1917.
[12] A. W. C. Liew, H. Yan, H., and M. Yang, “Pattern recognition techniques for the emerging field of bioinformatics: A review,”
Pattern Recognition, vol. 38, 2005, pp. 2055–2073.
[13] I. Ioshikhes, and E. Trifonov, “Nuclesomal DNA sequence database,” Nucleic Acids Research, vol. 21, 1993, pp. 4857–4959. [14] C. Ambrose, A. Rajadhyaksha, H. Lowman, and M. Bina,
“Locations of nucleosomes on the regulatory regions of simian virus 40 chromatin,” J. Molecular Biology, vol. 209, 1989, pp. 255–263.
[15] C. Ambrose, H. Lowman, A. Rajadhyaksha, V. Blasquez, and M. Bina, “Location of nucleosomes in simian virus 40 chromatin,” J. Molecular Biology, vol. 214, 1990, 875–884.