Proceedings
Growth mixture modeling as an exploratory analysis tool
in longitudinal quantitative trait loci analysis
Su-Wei Chang*
1, Seung Hoan Choi
1, Ke Li
1, Rose Saint Fleur
1,
Chengrui Huang
1, Tong Shen
1, Kwangmi Ahn
2, Derek Gordon
3,
Wonkuk Kim
4, Rongling Wu
2, Nancy R Mendell
1and Stephen J Finch*
1Addresses:1Department of Applied Mathematics and Statistics, Stony Brook University, 100 Nicolls Road, Stony Brook, New York 11794, USA, 2Department of Public Health Sciences, Pennsylvania State College of Medicine, Pennsylvania 17033, USA,3Department of Genetics, Rutgers University, 145 Bevier Road, Piscataway, New Jersey 08854, USA and4Department of Mathematics and Statistics, University of South Florida, 4202 East Fowler Avenue, Tampa, Florida 33620, USA
E-mail: Su-Wei Chang* - [email protected]; Seung Hoan Choi - [email protected]; Ke Li - [email protected]; Rose Saint Fleur - [email protected]; Chengrui Huang - [email protected]; Tong Shen - [email protected]; Kwangmi Ahn - [email protected]; Derek Gordon - [email protected]; Wonkuk Kim - [email protected];
Rongling Wu - [email protected]; Nancy R Mendell - [email protected]; Stephen J Finch* - [email protected] *Corresponding author
fromGenetic Analysis Workshop 16 St Louis, MO, USA 17-20 September 2009
Published: 15 December 2009
BMC Proceedings2009,3(Suppl 7):S112 doi: 10.1186/1753-6561-3-S7-S112
This article is available from: http://www.biomedcentral.com/1753-6561/3/S7/S112
©2009 Chang et al; licensee BioMed Central Ltd.
This is an open access article distributed under the terms of the Creative Commons Attribution License (http://creativecommons.org/licenses/by/2.0), which permits unrestricted use, distribution, and reproduction in any medium, provided the original work is properly cited.
Abstract
We examined the properties of growth mixture modeling in finding longitudinal quantitative trait loci in a genome-wide association study. Two software packages are commonly used in these analyses: Mplus and the SAS TRAJ procedure. We analyzed the 200 replicates of the simulated data with these programs using three tests: the likelihood-ratio test statistic, a direct test of genetic model coefficients, and the chi-square test classifying subjects based on the trajectory model’s posterior Bayesian probability. The Mplus program was not effective in this application due to its computational demands. The distributions of these tests applied to genes not related to the trait were sensitive to departures from Hardy-Weinberg equilibrium. The likelihood-ratio test statistic was not usable in this application because its distribution was far from the expected asymptotic distributions when applied to markers with no genetic relation to the quantitative trait. The other two tests were satisfactory. Power was still substantial when we used markers near the gene rather than the gene itself. That is, growth mixture modeling may be useful in genome-wide association studies. For markers near the actual gene, there was somewhat greater power for the direct test of the coefficients and lesser power for the posterior Bayesian probability chi-square test.
Background
Growth mixture modeling (GMM) is an important tool for analyzing longitudinal data [1-3]. GMM hypothesizes that there is a fixed but unknown number of trajectory pattern components observed in a population. GMM applies mixture analysis methods to estimate the number of trajectory components and the probability that a trait variable (such as a genotype) affects the probability of trajectory component membership. The procedure allows for controlling for time-varying covari-ates (TVCs) as well. Two popular software packages for GMM are the SAS TRAJ procedure [4-6] and the Mplus program [7-9]. We analyze simulated data on the coronary artery calcification (CAC) measurements taken at the three visits [10]. We apply GMM software to assess whether genotypes appear to be associated with trajectory component membership, and hence identify longitudinal quantitative trait loci (QTL). We compare the empirical distribution of three measures of associa-tion for genes not in the genetic model for CAC to the usual chi-squared distributions. We compare the power of GMM analyses that explicitly incorporate genotype measurements of the genes in the genetic model for CAC into the mixture modeling to GMM analyses that assess genetic association with post hoc tests. Finally, we also report the reduction in power using genes close to the true gene rather than the gene itself.
Methods
Analysis softwareWe use the SAS TRAJ procedure [6] and the Mplus program [11] to perform GMM and to identify long-itudinal QTLs. Each SAS TRAJ analysis reports the maximized log-likelihood, the maximum-likelihood estimates (MLEs) of the trajectory group parameters, the t-statistics of the trajectory group parameters, the estimated frequency of each trajectory group, the Bayesian posterior probability (BPP) that each subject is a member of each trajectory component and the Bayesian information criterion (BIC) statistic, which is used to assess the number of trajectory components. Mplus also reports these statistics.
Genes used in the analysis
For each gene considered, we create the two indicator variables, whether the subject’s genotype is the more common homozygote and whether the subject’s geno-type is the less common homozygote. We study 17 single-nucleotide polymorphisms (SNPs): τ1, ..., τ5, j1,
j2 and 10 SNPs v1, v2, ..., v10 on human chromosome (HC) 22 that were not in the genetic mechanism determining the simulated CAC and myocardial infarc-tion (MI) events. The genesτ1, ...,τ5determined the CAC level, and the genes j1, j2 determined MI but not the
CAC level [10]. The results forv1,v2, ...,v10are the basis of the empirical null distribution of our test statistics. The distribution for j1, j2 should be similar to the empirical null distribution. We also report PROC TRAJ results for four SNPs near τ5 and τ2 that had a minor allele frequency (MAF) greater than 0.1 and were in Hardy-Weinberg equilibrium (HWE) to demonstrate the applicability of this procedure for genome-wide associa-tion studies (GWAS).
CAC analyses
We consider two sets of analyses applied to the 200 replicates. For each of the 17 SNPs, the first uses the longitudinal CAC measures with the two genetic indicator variables used as traits but without any TVCs. The second is the longitudinal CAC with the TVCs cholesterol (CHOL) and high-density lipoprotein (HDL) level and with the two genetic indicator variables as traits. We use a quadratic trend function and set the number of components to two and three. The dataset consists of subjects with genotypes and simulated phenotypes (n = 6,476). We treat the subjects as independent observations.
Measures of association with a gene
In an analysis that identifies c trajectory groups, there are 2(c-1) indicator variables associated with genei,iŒ {τ1, ...,τ5,j1,j2,v1, ...,v10}. For example, for theτ5gene (which has homozygous genotypes AA and GG), there are estimated coefficients for the two homozygous indicators in Groups 2 throughc. Group 1 is a reference group with coefficients of trait variables set to 1 identically in the SAS TRAJ procedure. With τ5, we
calculate S TAA j TGG j
null distribution with the empirical distribution for v1, v2, ...,v10. We call this the“direct coefficient test”(DCT) and use level of significance 0.05 with the empirical critical value from the distribution forv1,v2, ...., v10.
Our second procedure is the BPP chi-squared test on the three genotype rows by c trajectory group column contingency table. We classify each subject into the trajectory group that has the largest BPP. A significant value of the chi-square test for independence (p < 0.05 based on the empirical distribution of the chi-square test forv1,v2, ....,v10) indicates association with the gene.
the distribution of the chi-square test forv1,v2, ....,v10) indicates association with the gene.
Results
We ran the Mplus software on Replicates 1 through 11 with two and three trajectory groups specified, with subject’s age as individually varying times of observa-tions for the outcome CAC. The software either failed to converge or failed to identify the solution due to excessive numbers of local maxima. We used at least 500 sets of starting values in the initial stage and 100 optimizations in the second stage. Computation times were between 67 and 75 hours for each replicate to fit the two-group models without any time-invariant or time-varying covariates. The Mplus software was not considered any further.
The distribution of the results from the three procedures using the SAS TRAJ procedure had greater means and standard deviations for the five SNPs fromv1,v2, ....,v10 that were not in HWE than for the five in HWE as shown in Table 1. We used the 95th percentile for the five markers in HWE as the critical value for our tests. Use of TVC appeared to increase the mean and standard deviation of the distribution.
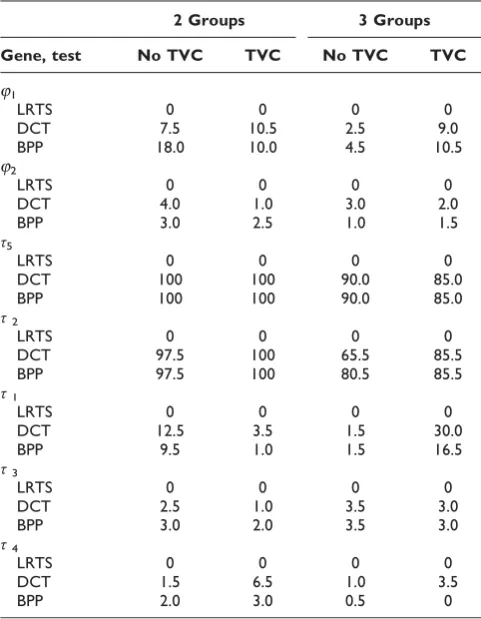
Forj1,j2andτ1, ...,τ5, we studied either two- or three-trajectory components, with and without TVCs. Table 2 contains rejection rates by gene for the three tests using the two- and three-trajectory group models. For j1 and
j2, which are genes associated with MI but not CAC, the DCT and BPP rejection rates are roughly consistent with 5% level of significance. The LRTS rejection rates are 0, suggesting that the test is not well defined for this application, and we did not consider the LRTS further. For τ5, the rejection rate was 100% for both DCT and BPP using the two-trajectory group model. The
corresponding rejection rate for τ2 is 97.5% for DCT and BPP. For τ1, τ3, and τ4, the rejection rates for DCT and BPP are not substantially above 5%, the level of significance.
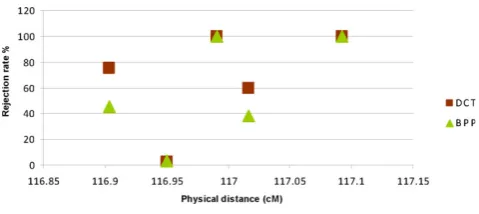
Figure 1 shows the rejection rate of DCT and BPP for four SNPs nearτ5(116.99 cM). The rejection rate for one of the nearby SNPs was 100% for both DCT and BPP, and
Table 1: Summary test statistics for the HC22 SNPs, 200 replicates
Mean (SD)
Test Group TVC In HWE Not in HWE In HWE, 95thpercentile
LRTS 2 no 699.07 (929.04) 20112.96 (9897.54) 2547.31 LRTS 2 yes 14284.71 (921.18) 32726.20 (9359.47) 16184.79 LRTS 3 no 698.58 (925.06) 20044.89 (9853.60) 2535.54 LRTS 3 yes 14722.74 (928.14) 32905.40 (9241.30) 16618.77
DCT 2 no 1.22 (1.24) 2.87 (3.06) 3.81
DCT 2 yes 1.62 (1.52) 3.40 (3.74) 4.72
DCT 3 no 3.48 (3.17) 4.24 (3.31) 9.27
DCT 3 yes 4.04 (5.82) 3.97 (3.17) 10.48
BPP 2 no 2.20 (2.27) 4.82 (5.52) 6.64
BPP 2 yes 2.95 (2.80) 8.07 (15.13) 8.46
BPP 3 no 6.32 (5.14) 8.88 (7.12) 16.74
BPP 3 yes 9.26 (10.10) 14.91 (19.20) 22.42
Table 2: Rejection rates of tests by gene, 200 replicates
2 Groups 3 Groups
Gene, test No TVC TVC No TVC TVC
j1
LRTS 0 0 0 0
DCT 7.5 10.5 2.5 9.0 BPP 18.0 10.0 4.5 10.5 j2
LRTS 0 0 0 0
DCT 4.0 1.0 3.0 2.0 BPP 3.0 2.5 1.0 1.5 τ5
LRTS 0 0 0 0
DCT 100 100 90.0 85.0 BPP 100 100 90.0 85.0 τ2
LRTS 0 0 0 0
DCT 97.5 100 65.5 85.5 BPP 97.5 100 80.5 85.5 τ1
LRTS 0 0 0 0
DCT 12.5 3.5 1.5 30.0 BPP 9.5 1.0 1.5 16.5 τ3
LRTS 0 0 0 0
DCT 2.5 1.0 3.5 3.0 BPP 3.0 2.0 3.5 3.0 τ4
LRTS 0 0 0 0
DCT 1.5 6.5 1.0 3.5
the rejection rate was greater than 50% for DCT for two nearby SNPs. The rejection rate for the remaining SNP was very low. The rejection rate for BPP was somewhat less than the rejection rate for DCT. Similar results held for τ2(data not shown).
Discussion and conclusion
The Mplus software was not effective in analyzing this data due to computational instability and lengthy computing time. Computational instability also affected the SAS TRAJ procedure. For example, about 17% of the replicates did not have a solution when three groups were specified with TVCs. One effect of this instability was that using TVCs did not increase the overall power as expected. The LRTS was not usable, possibly due to the dependence of subjects within pedigree and the non-normality of the distribution of CAC, especially for the first visit. The empirical distribution of the DCT and BPP for genes not associated with CAC values appeared to depend on whether the gene was apparently in HWE. Because violation of HWE is often used as a test for large genotyping error rates [12], a question yet to be resolved is the robustness of these procedures to genotyping error. A second approach to calculating thep-value of the DCT or BPP is to use a permutation method.
Specifically, one can generate a large number of random permutations of the n vectors (here n = 6,476 partici-pants) of CAC values. The fraction of permutations that yield a value of the statistic larger than the one observed is the permutationp-value.
The analyses based on the SAS TRAJ procedure have power to detect genes associated with longitudinal for CAC QTLs. For CAC, the SAS TRAJ analysis of unadjusted CAC values with two trajectory groups and no TVCs had excellent power (100% rejection rate) to detect the τ5 association and good power (97.5% rejection rate) to detect the τ2 association using either DCT or BPP. The
associations with τ1, τ3, and τ4 were not detected with this approach. The rejection rates at a marker near τ5 could be as large as the τ5 rejection rate. The rejection rate for DCT was high for most markers nearτ5. The BPP had somewhat lower rejection rates than the DCT. Similar results held forτ2.
We conclude that the SAS TRAJ procedure is useful in GWAS to identify longitudinal QTLs. In an actual genetic analysis, one should follow Maclean et al. and consider multiple transformations of the data to reduce the chances that skewness of the data would result in an apparent genetic association [13]. Procedures to find the most effective transformation should be developed to enhance the applicability of GMM analysis. The chi-square test using the Bayesian posterior probability classification of subjects seems to be slightly less powerful than the direct test of the coefficients.
List of abbreviations used
BIC: Bayesian information criterion; BPP: Bayesian posterior probability; CAC: Coronary artery calcification; DCT: Direct coefficient test; GMM: Growth mixture modeling; GWAS: Genome-wide association studies; HC: Human chromosome; HWE: Hardy-Weinberg equi-librium; LRTS: Likelihood-ratio test statistic; MAF: Minor allele frequency; MI: Myocardial infarction; MLE: Max-imum likelihood estimate; QTL: Quantitative trait loci; SNP: Single-nucleotide polymorphism; TVC: Time-vary-ing covariate.
Competing interests
The authors declare that they have no competing interests.
Authors
’
contributions
S-WC developed the methodology, carried out the statistical and genetic analyses, organized the group, and drafted the manuscript. SHC, KL, RSF, CH, and TS participated in the data mining and statistical analyses. KL was also in charge of the data distribution and management. KA, DG, WK, RW, NRM, and SJF conceived of statistical theories and possible applications. NRM and SJF also participated in the study design, group coordination, and manuscript drafting. All authors read and approved the final manuscript.
Acknowledgements
We thank Genetic Analysis Workshop 16 organizers and participants for their inspiring talks and discussions that led to the perfection of this paper. Dr. Mendell’s research was supported by NIH grant MH071523. In particular, we thank So-Youn Shin, Ti Zhou, Chrisnel Lamy, Songjie Li, and Qilong Yuan for their time and efforts in this project.
Figure 1
Rejection rate of DCT and BPP for SNPs near τ5by
This article has been published as part of BMC Proceedings Volume 3 Supplement 7, 2009: Genetic Analysis Workshop 16. The full contents of the supplement are available online at http://www.biomedcentral.com/ 1753-6561/3?issue=S7.
References
1. Muthén B and Shedden K: Finite mixture modeling with mixture outcomes using the EM algorithm.Biometrics 1999, 55:463–469.
2. Li F, Duncan TE and Hops H: Examining developmental trajectories in adolescent alcohol use using piecewise growth mixture modeling analysis. J Stud Alcohol Drugs2001, 62:199–210.
3. Colder CR, Mehta P, Balanda K, Campbell RT, Mayhew K, Stanton WR, Pentz MA and Flay BR:Identifying trajectories of adolescent smoking: an application of latent growth mixture modeling.Health Psychol2001,20:127–135.
4. Nagin D: analyzing developmental trajectories: a semi-parametric, group-based approach. Psychol Methods 1999, 4:139–177.
5. Nagin D and Tremblay RE: Analyzing developmental trajec-tories of distinct but related behaviors: a group-based method.Psychol Methods2001,6:18–34.
6. Jones B, Nagin D and Roeder K: A SAS procedure based on mixture models for estimating developmental trajectories. Sociol Methods Res2001,29:374–393.
7. Muthén B and Muthén L: Integrating person-centered and variable-centered analyses: growth mixture modeling with latent trajectory classes.Alcohol Clin Exp Res2000,24:882–891. 8. Muthén B, Brown CH, Masyn K, Jo B, Khoo ST, Yang CC, Wang CP, Kellam S, Carlin J and Liao J:General growth mixture modeling for randomized preventive interventions. Biostatistics 2002, 3:459–475.
9. Kreuter F and Muthén B:Longitudinal modeling of population heterogeneity: methodological challenges to the analysis of empirically derived criminal trajectory profiles. Advances in Latent Variable Mixture ModelsCharlotte, Information Age Publishing: Hancock GR, Samuelsen KM 2008, 53–75.
10. Kraja AT, Culverhouse R, Daw EW, Wu J, Van Brunt A, Province MA and Borecki IB:The Genetic Analysis Workshop 16 Problem 3: simulation of heritable longitudinal cardio-vascular phenotypes based on actual genome-wide single-nucleotide polymorphisms in the Framingham Heart Study. BMC Proc2009,3(suppl 7):S4.
11. Muthén B:Latent variable analysis: growth mixture modeling and related techniques for longitudinal data. Handbook of Quantitative Methodology for the Social SciencesThousand Oaks, Sage: Kaplan D 2004, 345–368.
12. Leal MS:Detection of genotyping errors and pseudo-SNPs via deviations from Hardy-Weinberg equilibrium.Genet Epidemiol 2005,29:204–214.
13. Maclean CJ, Morton NE, Elston RC and Yee S: Skewness in commingled distributions.Biometrics1976,32:695–699.
Publish with BioMed Central and every scientist can read your work free of charge
"BioMed Central will be the most significant development for disseminating the results of biomedical researc h in our lifetime."
Sir Paul Nurse, Cancer Research UK
Your research papers will be:
available free of charge to the entire biomedical community peer reviewed and published immediately upon acceptance cited in PubMed and archived on PubMed Central yours — you keep the copyright