R E S E A R C H
Open Access
Improvements for electromechanical
oscillation mode estimation via subspace
identification methods
Sheng Ding
1and Hongliang Huang
2*Abstract
Two improvements of power system electromechanical oscillation estimation via subspace identification are proposed in this paper. Singular value-based criteria are introduced not only to improve the computation efficiency for determining the model order of the estimated system but also to improve the accuracy of the estimates. A mode matching method based on the characteristics of accurate mode shape estimates is proposed to ensure the correctness of the estimates. Numerical results from three different scale power systems illustrate the feasibility of the proposed methods.
Keywords:Electromechanical oscillation; Subspace identification methods; Model order selection; Mode matching; Singular value criterion
1 Introduction
Electromechanical oscillations in power system are becoming a serious factor to limit power transfer in inter-connected power systems in China. The Southern Grid as well as the North China Grid is often reported to be suf-fering from inter-area oscillations [1,2]. Many blackouts either directly or indirectly caused by low-frequency oscil-lation or occurrences of low-frequency osciloscil-lation have been reported worldwide [3]. Among them, blackouts that occurred across Western Canada, the Western United States, and Northwest Mexico on 10 August 1996 [4] and in the eastern United States and parts of Canada on 14 August 2003 [5] are well known. These two outages show the potential hazards that inter-area oscillation modes might bring to the whole power grid.
Many efforts have been focusing on the electromech-anical oscillation analysis so far. Since analysis based on first-principle modeling is not accurate enough [4], iden-tification methods are preferred to estimate the proper-ties of the modes. Among them, subspace methods are becoming attractive not only because the state space form of the system is very convenient for estimation,
prediction, and control [6] but also because they have numerical simplicity and robustness and are suitable for multiple-input and multiple-output (MIMO) system, such as large power system. In [7], subspace methods are applied to estimate the electromechanical modes using ambient data. In [8], the Monte Carlo simulation results show that compared with Prony method and Yule-Walker method, canonical variate analysis (CVA) as well as numerical algorithms for Subspace State Space System Identification (N4SID), two subspace methods, are more accurate in estimating frequencies and damp-ing ratios of low-frequency oscillation modes. In [9], N4SID is also more accurate using ring-down data. Sub-space methods are also developed to estimate mode shapes. It is concluded that the mode shapes obtained by subspace methods are more accurate compared with the ones obtained by other methods such as transfer function (TF), spectral frequency domain decomposition (FDD) [10]. Furthermore, no extra algorithm is required to calculate the mode shapes if the subspace method is applied.
However, there may still have some important consid-erations neglected when subspace methods are applied to estimate the electromechanical oscillations. The two main problems will be investigated in this paper. One is how to determine the proper order of the estimated
* Correspondence:[email protected]
2College of Electrical Engineering, Zhejiang University, Hangzhou 310027, China
Full list of author information is available at the end of the article
system matrix both efficiently and accurately. Over-parameterization or under-Over-parameterization could result in inaccurate estimates. As yet, two information criteria have been widely used to determine the system order: Akaike’s information criterion (AIC) [11] and Bayesian information criterion (BIC) [12]. Both criteria can be used to solve model order selection problem for autoregressive-moving-average (ARMA) model or other identification methods successfully [13]. In [8] and many other refer-ences, AIC is also applied to determine the model order for subspace identification method. However, the model order should be determined after a sequence of tests for each order if AIC or BIC is applied [14]. An efficient com-putation way for model order selection for subspace methods can be based on the singular values of the Hankel matrix which are estimated in the algorithm of subspace identification methods. In this paper, singular value-based criteria are introduced to improve computa-tion efficiency and the accuracy of the estimates.
The other is the mode matching problem. The fre-quency range of an electromechanical oscillation mode is about 0.2 ~ 2.5 Hz. It can be noted that often there are several modes of interest whose frequencies are quite close. For example, in [15] the author shows that the oscillation modes existing in the WECC among the fre-quencies of two modes are 0.78 and 0.8 Hz. Further-more, the estimated mode will be interfered with other frequency-neighboring modes. In this content, the cor-rectness of the estimated mode should be ensured. In this paper, a method of mode matching is proposed for subspace identification methods. By extracting the char-acteristic information from the estimated mode shape, the estimated mode can be determined to which mode it corresponds. It is also shown that the aggregation method can help simplify the extraction.
The paper is organized as follows: A general procedure of estimation based on subspace identification methods are described systematically in Section 2. Model order selection is discussed in Section 3. A method of mode matching via mode shapes is shown in Section 4. The simulation results are shown in Section 5. Conclusions are drawn in Section 6.
2 Mode estimation via subspace identification methods
Many identification methods as well as signal processing techniques are used to estimate the electromechanical oscillation modes based on the measurements [16]. Among them, subspace identification methods are more popular due to the following reasons:
1. State space form of the identified system is very convenient for estimation, prediction, and control
[6]. Also, subspace identification methods have
numerical simplicity and robustness and are suitable for MIMO system, such as large power system. Several oscillation modes of interests can be estimated accurately.
2. Subspace methods are able to obtain accurate modal properties (frequency and damping ratio)
using ambient and ring-down data [9].
Ambient data correspond to stationary normal operating condition with small variations due to random load variations in the whole system, while ring-down data are observed when some radical changes occur in the system, e.g., a transmission line tripping or a
generator tripping [17]. So subspace
identification methods have a better tracking ability for a practical power grid monitoring with both of the two types of data generated by a real power system.
3. Subspace methods can also give accurate estimates of mode shapes giving more information about the oscillation modes like the dominant oscillation paths and the source. This is due to the fact that there is no approximation when mode shapes are
calculated [10].
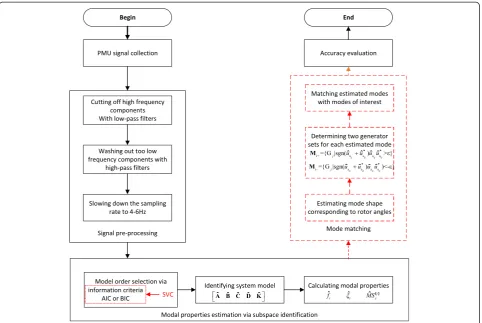
According to the above advantages, subspace identifica-tion methods are becoming more attractive in electro-mechanical oscillation mode estimation. Usually, according to [8] and [18], the procedure of electromechanical modes estimation via subspace identification methods includes phase data collection, signal pre-processing, modal proper-ties via subspace identification methods, and accuracy evaluation (shown in Figure 1). All these steps will be in-troduced in the following sections. Two improvements are also shown in red dashed line block in Figure 1. Singular value criterion (SVC), instead of information criteria like AIC and BIC, will efficiently give a more proper model order to make the estimates more accurate. Mode match-ing can help match the estimated modes with the ones of interest. Both the improvements will be introduced detailedly in Section 3 and Section 4.
2.1 Phase data collection
2.2 Signal pre-processing
The aim of pre-processing PMU data is to extract the features of electromechanical modes whose frequency covers the range from 0.2 to 2.5 Hz. Thus, more accur-ate estimaccur-ates can be obtained. Several steps should be taken into consideration [8]. First, several low-pass filters can cut off frequency components. Second, high-pass filters should be used to wash out components with too low frequencies. Last but not the least, decimation should be conducted to slow down the sampling rate (20 ~ 30 samples/s) to the optimum. This is due to the fact that high sampling rate will make the discrete poles sensitive to noise and the poles closer to each other ac-cording to [20]. Too low sampling rate will, however, make the signal distorted according the Shannon Sampling Theorem. An optimal sampling rate is usually about 4 ~ 6 Hz for electromechanical modes estimation.
2.3 Modal properties estimation via subspace identification
The aim of subspace identification is to identify a reduced-order linear model for power system. Electro-mechanical oscillation modes can thus be estimated from this model. In this paper, since only ambient data
are used, i.e., the system is perturbed by small load varia-tions, the identified linearized power system via sub-space identification methods can be written as [10] follows:
_^
x kð þ1Þ ¼A^^x kð Þ þKeð Þk y kð Þ ¼C^^x kð Þ þeð Þk
(
ð1Þ
where ^x is the state vector. y is the output vector. e is the input noise. Ab, Cb, andK are the estimated system matrix, the output matrix, and the input noise gain matrix, respectively.
IfẐiis the estimate of the discrete eigenvalue, one can obtain the corresponding continuous eigenvalue:
^
λi¼fslnð Þzi^ ð2Þ
where fs is the sampling rate. The corresponding esti-mated frequency and damping ratio can be calculated by the following:
^fi ¼Im λ^i
2π ð3Þ
^
Once the corresponding right eigenvector ^ui is found,
the relative mode shape of measured output can be de-fined as [21] follows:
b
MSð Þi
y ¼C^^ui ð5Þ
2.4 Accuracy evaluation
Load variations can be seen following Gaussian distribu-tion [22]. Based on this assumpdistribu-tion, the accuracy of the estimates has been evaluated. Bootstrap method has been applied to determine the uncertainties in subspace identification methods by resampling residuals [23]. For electromechanical oscillation estimation, since the length of measured data is limited, some Monte Carlo methods like bootstrap are preferred to evaluate the estimates [24-26].
In this paper, the model order selection will be investi-gated. An efficient method, SVC, instead of AIC and BIC, gives more accurate estimates. A step of mode matching is also added into the procedure to find out the corresponding mode from all the estimated modes (shown in Figure 1).
3 Model order selection for subspace identification method
Model order has great influence on the accuracy of estimated modal properties. Higher order or lower order usually results in over-parameterization or under-parameterization. Both situations will make the estimates inaccurate. Usually, AIC [11,27] and BIC [12] are used to determine the model order for ARMA or ARMAX model. For subspace identification methods, however, AIC or BIC might not work quite efficiently. An efficient computation way to determine the model order is based on the singular values of the weighted Hankel matrix. Two singular value-based methods for model order selection are thus adopted for subspace identifica-tion methods to improve the computaidentifica-tion efficiency in this section. SVC is suggested for subspace identification methods.
3.1 Information criteria
Information criteria (IC) are referred to as penalized log-likelihood criteria where the penalty term depends on the number of free parameters in the model and the number of observations [13]. They can be written in a general form:
C(N) is an increasing function of the observations num-ber N, and θ^n is the estimator for the unknown model parameter based on the observations. d(n) is the number of the parameters in θ^n. The optimal order choice is such that n^IC¼argminICð Þn . The widely used
informa-It is stated in [13] that BIC can be used in ARMA model. In [8] and many other references, AIC is applied to choose the order for the system model identified by subspace methods. Noting that from (7) and (8), one can see that before calculating AIC(n) and BIC(n),θ^nshould be obtained.
3.2 Singular value-based criteria
Recall the state space model (1), for open loop system, the observability matrix can be written as follows:
Γf¼ CT ATCT ⋯ Af−1
T
CT
T
ð9Þ
Also, the controllability matrix can be written as follows:
Lρ¼B AB ⋯ Aρ−1B ð10Þ
The Hankel matrix Hfpis the product of the observ-ability matrix and controllobserv-ability matrix:
Hfp≜ΓfLp¼
then a new matrix with lower rank bn can be
approxi-where Wf and Wp are the weight matrices. They vary with different subspace identification methods. One can find Wf and Wp for CCA, MOESP, and N4SID in [14].
Suppose there aremoutputs and no input in the sys-tem. There are min(fm,pm) singular values inbΣ, andbσiis
the ith largest singular value in Σ^ . The difference
between UbΣbVbT and Ub^nbΣn^VbTn^ can be defined in both
Frobenius norm and Eulclidean norm:
^
Similar to AIC and BIC, combining the penalty term which punishes the high model orders, novel informa-tion criterion (NIC) and SVC can be defined as [28] follows: AIC and BIC, the computation efficiency of NIC and SVC is highly improved due to the fact that the singular values are estimated in the algorithm in subspace methods. Note that NIC and SVC use Frobenius and Eulclidean norm to measure the difference between b
UΣbVbT and U^bnΣb^nVbT^n. In comparison with NIC, SVC is
less influenced by the row and column indices of the Hankel matrix f and p since SVCð Þn takes the largest neglected singular value σ^nþ1 into consideration while NICð Þn takes all the neglected singular values [28]. In this paper, SVC is preferred in the following discussion.
Recall that f and p are the row and column indices of the Hankel matrix respectively. The accuracy of the estimation of the model order bn heavily depends on the values of f and p. It is required that index p tend to infinity for consistency of the estimates [14]. Fortunately, p can reduce to bpAIC, the estimated
order of autoregressive (AR) model according to AIC, which is the well-known high-order AR model
in the asymptotic methods [29]. Usually, we have the following:
f¼p¼bpAIC ð17Þ
Mathematically, the optimal model order can be described as follows:
is the order of the reduced system. An obvious ad-vantage of SVC over information criteria is that the system order can be determined by calculating the singular values of WfHbf pWp which is already con-ducted in subspace identification methods. Many de-tails about SVC can be found in [14].
So far, three information criteria are introduced in this section. By SVC, the computation efficiency of model order selection has been highly improved. The accur-acies of the three criteria will be examined with simula-tion examples and one may find that SVC also improves the accuracy of the estimates.
4 Mode matching
There are many electromechanical oscillation modes with similar frequency in inter-connected power sys-tems. Practically, only several lightly damped modes which can be found by first-principle modeling are of interest. However, many estimated modes are quite closer so that one cannot determine the mode corre-sponding to the one of interest. The importance of mode matching is to ensure the correctness of the estimates, i.e., the estimated mode should correspond to the mode of interest.
The mode matching method proposed for subspace identification method in this paper is based on the esti-mated mode shape, i.e., the relative magnitude and phas-ing, of the oscillation throughout the system [30]. The right eigenvector gives the‘mode shape’, i.e., the relative activity of the state variables when a particular mode is excited [31]. The amplitude of the mode shape indicates how much the generators participate in the mode. The angle of the mode shape indicates the two swing-against groups. In this paper, two sets containing mainly swing-ing against generator groups can be determined by the estimated mode shape. Furthermore, inertia aggregation method is accurate enough to aggregate the coherent generators in the system for calculation simplicity.
4.1 Modal analysis
Suppose there are m generators and nbbuses in the
system outputs. The electromechanical model can be linearized at the operating point and written as a state space form [30]: the rotor angle deviation vector in electrical radians,
Δω¼½Δω1 ⋯ ΔωmT is the per unit speed
devi-ation vector, and y is the bus voltage phase angle vector.
The system matrixAis as follows:
A¼ 0 ω0I −M−1Ks −M−1KD
ð20Þ
where M¼diagð2H1;⋯;2HmÞ is the matrix of
aggre-gated generators’ inertias. KS and KD are called syn-chronizing and damping torque coefficient matrices, respectively. InAppendix 1, it is shown how to find the entry ofKS.
For simplicity, damping terms are neglected ðKD≈0Þ. Rewrite the system matrix:
~
whereλi is theitheigenvalue ofA;ui is the corresponding
eigenvector. Rearranging (4–4), one can obtain:
ω0M−1Ksui2 ¼−λ2iui2
Thus, −λi2 and ui2 are eigenvalue and eigenvector of ω0M−1K
s, respectively. From (23), ui1, mode shapes of
low-frequency oscillation corresponding to generators’ power angles can thus be found. Note that the main os-cillatory characteristics for the mode shapes from (21) are maintained for the mode shapes of (20) [21]. All the elements in ui1 are real, while the elements would be
complex if damping terms are not neglected. To this ex-tent, (21) will give an easy way to find the oscillatory characteristics.
In most cases, voltage phase angles of the buses are taken as output signals for electromechanical oscillation
estimation. Suppose the outputs of the system are volt-age phase angles, one will have the following:
C¼½Cθδ 0 ð24Þ
4.2 Mode matching method
Obviously, the estimated mode shape bui1 can be
deter-mined as follows:
ui1 can be scaled by dividing the largest amplitude of
its entries. Note the normalized vector asbus
i and the jth
entry in busi as busij;j¼1;…;m. The amplitude of busij Figure 2Schematic diagram of Four-Machine System.
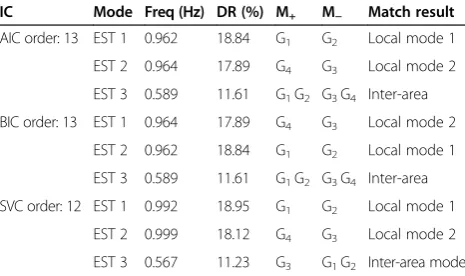
Table 1Estimated modes corresponding to different criteria
provides the information on the magnitude of the ith mode in the stateΔδj [16] i.e., the amplitude ofbusij
indi-cates how much the jth generator participating the ith mode. The angle of busij provides the information on the
phase of theith mode in the stateΔδj [16] i.e., the angle of busij indicates the pattern of generator swings for
the ith mode. In this paper, the sign of the real part of busij can help divide generators into one of the two
swinging-against groups. Thus, two sets Miþ and Mi−
containing mainly swinging against generators can be determined by busij
Miþ¼ Gjjsgn busijþbu sij
b
usijbu sij >ε
n o
ð27Þ
Mi−¼ Gjsgn busijþbu sij
b
usijbu sij
<−ε
n o
ð28Þ
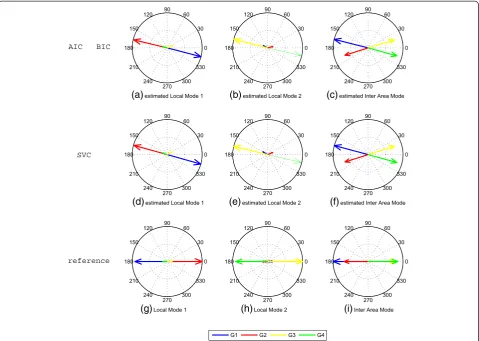
Figure 3Estimated and reference mode shapes of oscillation modes. (a)Estimated local model 1 via AIC or BIC.(b)Estimated local mode 2 via AIC or BIC.(c)Estimated inter-area mode via AIC or BIC.(d)Estimated local mode 1 via SVC.(e)Estimated local mode 2 via SVC.(f)Estimated inter-area mode via SVC.(g)Local mode 1.(h)Local mode 2.(i)Inter-area mode.
Table 2Accuracy of estimates corresponding to three criteria
Mode Reference value AIC BIC SVC
Uncertainty RMSE Uncertainty RMSE
Local mode 1 Freq (Hz) 1.056 0.962 ± 0.021 0.094 0.992 ± 0.020 0.065
DR (%) 19.87 18.86 ± 3.88 2.18 18.87 ± 3.68 2.13
Local mode 2 Freq (Hz) 1.071 0.964 ± 0.021 0.108 0.999 ± 0.020 0.073
DR (%) 19.57 18.13 ± 4.16 2.41 18.39 ± 4.12 2.26
Inter-area Freq (Hz) 0.565 0.589 ± 0.018 0.025 0.567 ± 0.018 0.009
where sgnð Þ: is the sign function and bus
ij is the
conju-gate complex of bus
ij. Gj refers to the jth generator. The
positive numberƐis the threshold. In this paper,Ɛis set to be 0.3. Thus, the conclusion can be drawn that the ith estimated mode is mainly caused by the generators in Μiþ swinging against generators in Μi−. Comparing the
conclusion with the results of modal analysis on first-principle modeling, one can determine which mode the estimated mode corresponds to.
Note that the mode matching method proposed in this paper can be simplified via aggregation model since an inter-area oscillation mode involves many generators. These generators can be divided into several coherent groups. Actually, coherence and aggregation, as a method of model reduction, is commonly used to analyze large power system dynamics. This kind of method is based on the relationship between the coher-ent areas and the slow inter-area modes [32]. It is not necessary to model the entire inter-connected power systems in detail to each generator when only several modes are of interest. One who has interest in the de-tails may refer to [32] and [15].
5 Simulation
In this section, three test systems are used to illustrate the two improvements. Numerical algorithm for N4SID, one of the subspace identification methods, is applied in the simulation. In a steady state, a power system oper-ates at an equilibrium point. The system is perturbed by load variations. These load variations can be regarded to follow Gaussian distribution. In [33], the loads of Nordic system are investigated statistically and it can be con-cluded that the loads are Gaussian distributed. In [34],
power system disturbance behavior is also suggested to be modeled via Gaussian approach. In simulation tests, loads are modeled to follow the Gaussian distribution. Thus, the dynamic system with ambient noises is simu-lated. Measurement noises with 20-dB signal-to-noise ratio (SNR) are also taken into consideration.
5.1 Four-Machine System
The Four-Machine Test System shown in Figure 2 is used to demonstrate the accuracy of the improvements. There are 4 generators with governors and power system stabilizers (PSS) and 13 buses in this system. There are three low-frequency oscillation modes in the system. One is the inter-area mode with generators G1 and G2
swinging against generators G3 and G4. The other two
are local mode 1, the oscillation between generators G1
and G2and local mode 2, the oscillation between
gener-ators G3and G1.
Voltage angles of buses 1, 2, 10, and 20 are measured as system outputs. The sampling frequency is 0.2 Hz and data length N equals 3,000. Model order is first de-termined by AIC, BIC, and SVC, respectively. From Table 1, one can see that AIC and BIC determine the same system order so that the estimating results are the same while SVC suggests a small model order. One may find that the two local modes have very similar frequen-cies. Thus, the estimated modes cannot be decided to which modes of interest they correspond respectively. To this content, the proposed mode matching method can help tell the frequency neighboring modes apart. Mode shapes of each estimated mode are shown and compared with the reference ones in Figure 3. The match results are also shown in Table 1. From Figure 3
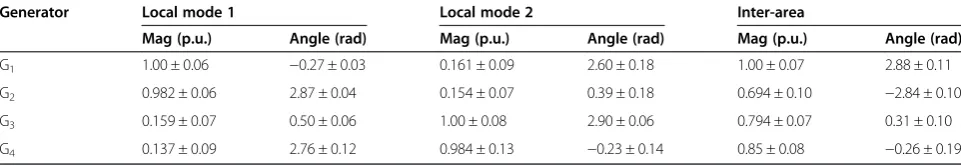
Table 3Estimates of mode shapes with uncertainty
Generator Local mode 1 Local mode 2 Inter-area
Mag (p.u.) Angle (rad) Mag (p.u.) Angle (rad) Mag (p.u.) Angle (rad)
G1 1.00 ± 0.06 −0.27 ± 0.03 0.161 ± 0.09 2.60 ± 0.18 1.00 ± 0.07 2.88 ± 0.11
G2 0.982 ± 0.06 2.87 ± 0.04 0.154 ± 0.07 0.39 ± 0.18 0.694 ± 0.10 −2.84 ± 0.10
G3 0.159 ± 0.07 0.50 ± 0.06 1.00 ± 0.08 2.90 ± 0.06 0.794 ± 0.07 0.31 ± 0.10
G4 0.137 ± 0.09 2.76 ± 0.12 0.984 ± 0.13 −0.23 ± 0.14 0.85 ± 0.08 −0.26 ± 0.19
Figure 5Inter-are mode shapes of aggregation model. (a)Reference from aggregation model.(b)Estimated via aggregation model.
and Table 1, it can be found that the modes can be cor-rectly matched by proposed method.
Bootstrap method is applied to evaluate the accuracy of the estimates [8]. One thousand trials are generated for evaluation of model order selection. Table 2 shows the error bounds with 95 % uncertainty of the estimates (mean
± 2*standard deviation). Root mean square error (RMSE) is also calculated. From Table 2, it can be concluded that the uncertainties of the frequency and damping ratio estimates corresponding to AIC, BIC, and SVC are similar. But esti-mates corresponding to SVC have smaller RMSE which means SVC can give more accurate estimates.
Table 4Results of modal analysis for New England System
Mode Freq (Hz) Eigenvectors of electromechanical oscillation modes
G1 G2 G3 G4 G5 G6 G7 G8 G9 G10
Local 1 1.021 +† − − − − − − + + +
Local 2 1.139 + + + +† +† −† −† + + −
Local 3 1.071 + +† −† + + + + + − −
Local 4 1.170 −† − − − − − − + +† −
Local 5 1.134 + +† +† − − − − + + −
Local 6 1.311 − − − + − − − +† − −
Local 7 1.236 + − − + − − +† − − −
Local 8 1.390 + − − +† −† + − − − +
Inter-area 0.636 +† +† +† +† +† +† +† +† +† −†
Also, the accuracy of mode matching is also evaluated. Table 3 shows the uncertainty of the estimated mode shapes in polar coordinates. One can see that the uncer-tainty of the estimates have no influence on the elements inΜiþandΜi−. Thus, the correctness of mode matching
can be validated.
Practically, only several critical oscillation modes are of interest in some complicated systems. These modes are usually lightly damped inter-area mode in which many generators are involved. It would be very compli-cated to calculate the mode shapes on all the generators in the system. In this situation, the inertia aggregation method of coherent generators [32] can be applied to simplify the mode matching. The accuracy of mode matching for inter-area mode via aggregation method is also evaluated. The inertia aggregation method is applied to aggregate coherent generators G1and G2as generator
G1and coherent generators G3and G4as generator G2,
respectively. The aggregated system is shown in Figure 4. The estimated and reference mode shapes of inter-area mode of aggregation system are shown in Figure 5.
From Figure 5a, one can obtainΜþ¼n oG02 andΜ−¼
G01
n o
. This means that the estimated mode is caused by
G1swinging against G2. Comparing the two figures, one
can find that the estimated mode holds the same oscilla-tion informaoscilla-tion as the inter-area mode, i.e., generators G1
and G2 (generator G1) swings against generators G3 and
G4(generator G2). This means that the estimated mode is
the inter-area mode. This sheds light on the fact that even by aggregation model, the mode matching method is still effective.
In Four-Machine System, the simulation results show that SVC can give more proper model order on which the accurate estimates of frequency and damping ratio are based. The estimated mode shapes are also accurate enough for mode matching. Furthermore, by aggregation methods, the proposed mode matching method can be both correct and simple.
5.2 New England System
For security analysis, there are only several modes of interest among many electromechanical oscillation modes in real power systems. The modes of interest will be interfered with some similar frequency modes out of interest. In order to show the flexibility of the improve-ments proposed in this paper, several modes of interest are shown to be estimated in the New England System
Figure 8Reference and estimated mode shapes. (a)Estimated mode 1.(b)Estimated mode 2.(c)Estimated mode 3.(d)Estimated mode 4.
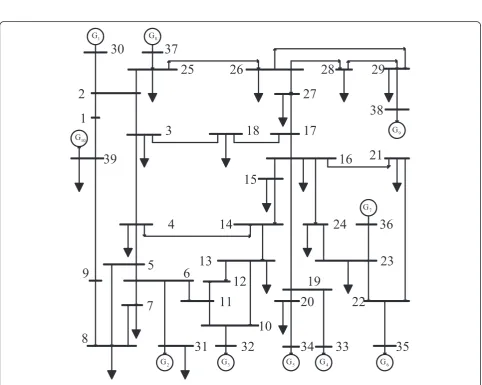
interfered with other frequency neighboring modes. The New England 39-bus system, shown in Figure 6, is com-posed of 39 buses and 10 generators. Generator G10 is
the equivalent external grid generator. The results of modal analysis are presented in Table 4. The ‘+’and‘−’ symbols indicate that the generators swing against each other. The symbol‘†’indicates that the generator mainly participates in the oscillation. For example, the first row indicates that local mode 1 is caused by generators G1,
G8, G9, and G10 swinging against generators G2 to G7
and G1is mainly participated.
Local mode 1, local mode 5, and the inter-area mode are of interest. Note that local mode 1 and local mode 3 have similar frequencies and so are local mode 5 and local mode 4 (see Table 4). This means that the esti-mated frequencies can be of local mode 3 and local mode 4 or of local mode 1 and local mode 5. How to correctly find out the modes corresponding to the ones of interest is shown. Take voltage angles of buses 1, 3, 5, and 15 as system outputs at a data length of N(=1,500). Four pre-processed signals are illustrated in Figure 7.
Table 4 indicates that G10swings against the others in
the inter-area mode, while G1, G9and G10swing against
the others in local mode 1; G1, G2, G3, G8, and G9swing
against G4, G5, G6, G7 and G10 in local mode 5. Thus,
one can aggregate generators in this way: (G1, G8, G9),
(G2, G3), (G4, G5, G6, G7) and G10can be aggregated to
groups G1, G2, G3, and G4, respectively.
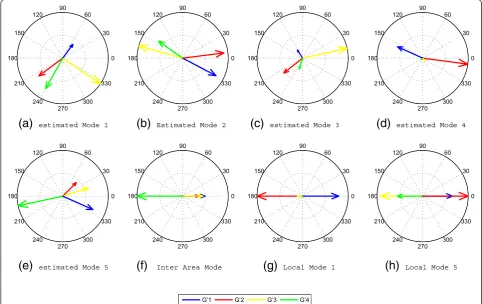
The model order is chosen to be 30 by SVC. Fre-quency, damping ratio, and corresponding mode shapes are estimated. There are five estimated modes whose fre-quencies are in between 0.4 and 1.5 Hz. The proposed mode matching method is used to find out the modes corresponding to the ones of interest. Figure 8 illustrates the mode shapes of the five estimated modes as well as
three reference ones. Mode matching results are shown in Table 5. From Table 5 and Figure 8, one can correctly match estimated mode 2, estimated mode 4, and esti-mated mode 5 with local mode 5, local mode 1, and inter-area mode, respectively. Thus, the estimate results can be determined in Table 5.
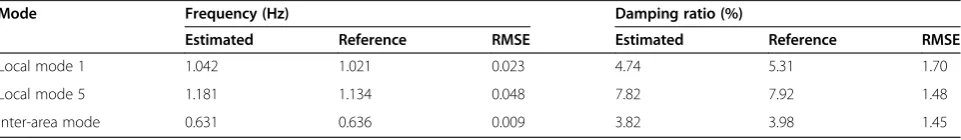
Table 6 shows the estimates of local mode 1, local mode 5, and inter-area mode. The RMSE of the estimates are also calculated by bootstrap method and the results are listed in Table 6. From Tables 5 and 6, it can be con-cluded that the estimates are both correct and accurate.
5.3 NPCC 48-machine system
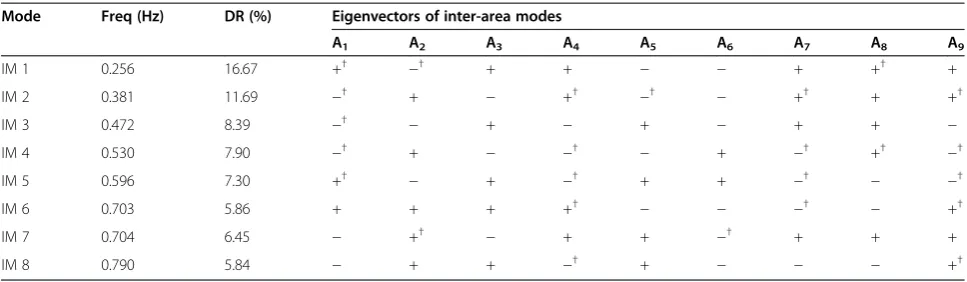
The proposed method can also be applied into a much lar-ger power system, NPCC, containing many inter-area os-cillation modes. The accuracy and flexibility will be shown in the system. The NPCC 48-machine system is composed of 140 buses and 48 machines in the system. The results of modal analysis show that there are eight inter-area modes and the whole system can be partitioned into nine areas. More details about the system description and coherent analysis can be found in [35]. The results of modal analysis are presented in Table 7 in which‘IM’stands for inter-area mode while ‘Ai’stands for the generators in theith Area.
The‘+’and ‘−’symbols are also used to indicate that the generators swing against each other.
IM 6, IM 7, and IM 8 are the modes of interest due to their less damping ratios (see Table 7). Note that IM 7 and IM 8 have similar frequencies and one cannot tell the esti-mates apart only by the frequencies. Take voltage angles of buses 13, 22, 25, 92, 97, 120, 122, 133, and 139 as system outputs at a length of N(=3,000). The model order is chosen to be 26 by SVC. There are three estimated modes with frequencies between 0.65 and 0.90 Hz. The proposed mode matching method is used to match the modes with the ones of interest, and the results of mode matching are shown in Table 8. From Table 8, one can find that the esti-mated modes 1, 2, and 3 are the estiesti-mated IM 6, IM 7, and IM 8, respectively. The estimate results can thus be deter-mined in Table 8. It can be concluded that the estimates are correct and accurate.
6 Conclusions
Two improvements, model order selection and mode matching for estimating the frequencies, damping ratios and mode shapes of electromechanical oscillations via
Table 6Estimates of local mode 1, local mode 5, and inter-area mode
Mode Frequency (Hz) Damping ratio (%)
Estimated Reference RMSE Estimated Reference RMSE
Local mode 1 1.042 1.021 0.023 4.74 5.31 1.70
Local mode 5 1.181 1.134 0.048 7.82 7.92 1.48
Inter-area mode 0.631 0.636 0.009 3.82 3.98 1.45
Table 5Results of mode matching
Mode Information from mode shapes Matching result
Μ+ Μ−
EST 1 G01G03 G02G04 N/A
EST 2 G03G04 G01G02 Local mode 5
EST 3 G03 G01G02G04 N/A
EST 4 G01G04 G02G03 Local mode 1
subspace identification methods have been presented in this paper. Based on theoretical analysis, both the two improvements are applied to simulation systems with ambient data. The results demonstrate that SVC works better than traditional information criteria in finding a proper system model order on which the accurate esti-mates of modal properties are based. The accuracy of the estimates has been investigated via bootstrap method. Also, with the help of aggregation model, the proposed mode matching method can easily help ensure the correctness of the estimates, even for larger power system. The emphasis of future work is placed upon in-vestigating the influence of data length on the improved subspace identification methods and electromechanical mode tracking via subspace methods.
7 Appendices
7.1 Appendix 1: Evaluation of entry of KS
The complex power S~i for the ith generator in
multi-machine power system is as follows:
~
Si¼Ui_ _Ii
¼−X
j¼1
j≠i
N E0i
j jE0jYredij cos δij−αij
þjsin δij−αij
þX
j¼1
j≠i
N E0i
j j2Y
redij
cosαij−jsinαij
ð29Þ
where E0i is the voltage behind the transient reactance
which is assumed to be constant.δijis the difference be-tweenδiandδj.δiis the rotor angle of theith generator.
Yredijis the admittance between the generators.αijis the phase angle of the Yredij. Yred can be calculated as follows:
Yred¼Ymm−YmnbYn−1bnbYnbm ð30Þ
Therefore, the electromagnetic power for the ith gen-erator is as follows:
Pei¼Re S~i
n o ¼−X
j¼1
j≠i
N E0i
j jE0j Yredijcos δij−αij
þX
j¼1
j≠i
N E0i
j j2 Y
redij
cosαij
ð31Þ
After simplification
Pei¼−
X
j¼1
j≠i
N E0i
j jE0j Yredijcos δij−αij
þj jE0i2Gii
ð32Þ
Table 8Results of mode matching
Mode Information from mode shapes Matching result Frequency (Hz) Damping ratio (%)
M+ M− Estimated RMSE Estimated RMSE
EST 1 A4A9 A7 IM 6 0.702 0.013 6.74 2.18
EST 2 A6 A2 IM 7 0.705 0.012 7.51 2.28
EST 3 A4 A9 IM 8 0.788 0.014 4.82 1.82
Table 7Results of modal analysis for NPCC 48-machine system
Mode Freq (Hz) DR (%) Eigenvectors of inter-area modes
A1 A2 A3 A4 A5 A6 A7 A8 A9
IM 1 0.256 16.67 +† −† + + − − + +† +
IM 2 0.381 11.69 −† + − +† −† − +† + +†
IM 3 0.472 8.39 −† − + − + − + + −
IM 4 0.530 7.90 −† + − −† − + −† +† −†
IM 5 0.596 7.30 +† − + −† + + −† − −†
IM 6 0.703 5.86 + + + +† − − −† − +†
IM 7 0.704 6.45 − +† − + + −† + + +
Consequently,Ksij, the value in the ith row and jth
col-7.2 Appendix 2: Computation of entry ofCθδ
Referring to m generators as internal voltage nodes, one can get:
where~Im is the generator injection current matrix; E~
0
m
is the generator internal voltage matrix; V~nb is the node voltage matrix. Hence:
Finally, one can conclude the following:
∂θi
Both authors declare that they have no competing interests.
Acknowledgment
This research was supported in part by Prof Y M Shi of Zhejiang University.
Author details
1The state key laboratory of industrial control technology, Institute of
Cyber-Systems and Control, College of Control Science and Engingeering, Zhejiang University, Hangzhou 310027, China.2College of Electrical
Engineering, Zhejiang University, Hangzhou 310027, China.
References
1. X Zhou, J Yi, R Song, X Yang, Y Li, H Tang, An overview of power transmission systems in China. Energy35(11), 4302–4312 (2010). doi:10.1016/j.energy.2009.04.016
2. Z Liang, M Xiao, K Zhang, J Zhou, J Wu, Discussion on control strategy for low frequency oscillation in China Southern Power Grid. Automation of Electric Power Syst35(11), 54–58 (2011)
3. Canadian Electrical Association Report,Investigation of low frequency inter-area oscillation problems in large inter-connected power systems, Ontario Hydro, 1993 4. P Kundur, Power system security in the new industry environment: challenges
and solutions. (IEEEE Toronto Section, 2003), http://www.ewh.ieee.org/r7/ toronto/events/oct0303/prabha.ppt
5. Final Report on the August 14, 2003 Blackout in the United States and Canada: causes and recommendations (U.S.-Canada Power System Outage Task Force, Tech. Rep., 2004)
6. SJ Qin, An overview of subspace identification. Comput Chem Eng30(10–12), 1502–1513 (2006). doi:10.1016/j.compchemeng.2006.05.045
7. N Zhou, JW Pierre, RW Wies, Estimation of low-frequency electromechanical modes of power systems from ambient measurements using a subspace method, inProceedings of the 35th North American Power Symposium, Rolla, 2003
8. N Zhou,Dissertation(University of Wyoming, Laramie, 2005)
9. DJ Trudnowski, JW Pierre, N Zhou, JF Hauer, M Parashar, Performance of three mode-meter block-processing algorithms for automated dynamic stability assessment. IEEE Trans Power Syst23(2), 680–690 (2008). doi:10.1109/TPWRS.2008.919415
10. L Dosiek, N Zhou, JW Pierrre, Z Huang, DJ Trudnowski, Mode shape estimation algorithms under ambient conditions: A comparative review. IEEE Trans Power Syst28(2), 779–787 (2013). doi:10.1109/ TPWRS.2012.2210570
11. R Shibata, Selection of the order of an autoregressive model by Akaike’s information criterion. Biometrika63(1), 117–126 (1976). doi:10.1093/ biomet/63.1.117
12. G Schwarz, Estimating the dimension of a model. Ann Statist6(2), 461–464 (1978). doi:10.1214/aos/1176344136
13. C Wu, C Lu, Y Han, New algorithm for mode shape estimation based on ambient signals considering model order selection. EURASIP Journal on Advances in Signal Processing.2013(8), (2013). doi: 10.1186/1687-6180-2013-8 14. D Bauer,Dissertation(TU Wien, Vienna, 1998)
15. L Wang, M Klein, S Yirga, P Kundur, Dynamic reduction of large power systems for stability studies. IEEE Trans on Power Syst12(2), 889–895 (1997). doi:10.1109/59.589749
16. IEEE Task Force Report,Identification of electromechanical modes in power systems (The Institute of Electrical and Electronics Engineers, Inc, 2012 17. G Liu, VM Venkatasubramanian, JR Carroll, Oscillation monitoring system
using synchrophasors, inIEEE Proceeding of PES General Meeting, Calgary, 2009, pp. 1-4
18. L Dosiek,Dissertation(University of Wyoming, Laramie, 2010)
19. JY Cai, Z Huang, JW Hauer, K Martin, Current status and experience of WAMS implementation in North America, inIEEE Proceeding of Transmission and Distribution Conference and Exhibition: Asia and Pacific, Dalian, 2005, pp. 1–7 20. AG Place, GH Allen, Generalized pole sensitivity analysis due to parameter
perturbation. IEEE Trans Circuits Syst II, Analog Digit Signal Process 44(10), 869–873 (1997). doi:10.1109/82.633448
21. L Vanfretti,Dissertation(Rensselaer Polytechnic Institute, Troy, 2009) 22. TJ Turunen, J Thambirajah, M Larsson, BC Pal, NF Thornhill, LC Haarla,
WW Hung, AM Carter, T Rauhala, Comparison of three electromechanical oscillation damping estimation methods. IEEE Transactions on Power Syst26(4), 2398–2407 (2011). doi:10.1109/TPWRS.2011.2155684 23. S Bittanti, M Lovera, Bootstrap-based estimates of uncertainty in subspace
identification methods. Automatica36(11), 1605–1615 (2000). doi: 10.1016/ S0005-1098(00)00081-9
24. MG Anderson, N Zhou, JW Pierre, RW Wies, Bootstrap-based confidence interval estimates for electromechanical modes from multiple output analysis of measured ambient data. IEEE Trans Power Syst20(2), 943–950 (2005). doi:10.1109/TPWRS.2005.846125
25. L Dosiek, JW Pierre, An improved bootstrap method for electromechanical mode estimation using multivariate probability distributions, inIEEE Proceeding of PES General Meeting, San Diego, 2011, pp. 1-8
26. N Zhou, JW Pierre, D Trudnowski, A bootstrap method for statistical power system mode estimation and probing signal selection, inIEEE Proceeding of PES General Meeting, Montreal, 2006, pp. 1-7
27. H Akaike, Information theory and an extension of the maximum likelihood principle, inProceeding of 2nd International Symposium on Information Theory, Tsahkadsor, 1971, pp.267–281
28. D Bauer, Order estimation for subspace methods. Automatica37(10), 1561–1573 (2001). doi: 10.1016/S0005-1098(01)00118-2
29. L Ljung,System Identification: Theory for the User, 2nd edn. (Prentice-Hall, Inc., Englewood Cliffs, NJ, 1987)
30. P Kundur,Power System Stability and Control(McGraw Hill, New York, 1994) 31. P Kundur, GJ Rogers, DY Wong, L Wang, MG Lauby, A comprehensive
computer program package for small signal stability analysis of power systems. IEEE Trans Power Syst5(4), 1076–1093 (1990). doi:10.1109/59.99355 32. JH Chow,Power System Coherency and Model Reduction(Springer, New
York, 2013)
33. J Turunen, M. Larsson, J. Thambirajah, LC. Haarla, T. Rauhala, Recent Developments in Modal Estimation of Power System Electromechanical Oscillations, inIEEE Proceeding of PowerTech, Trondheim, 2011, pp. 1-7 34. DN Ewart, Power: whys and wherefores of power system blackouts: an
examination of the factors that increase the likelihood and the frequency of system failure. IEEE Spectr15(4), 36–41 (1978). doi:10.1109/MSPEC.1978.6367667
35. J Chow, PV Kokotovic, RJ Thomas (eds.),Systems and Control Theory for Power Systems(Springer, New York, 1995)
Submit your manuscript to a
journal and benefi t from:
7 Convenient online submission 7 Rigorous peer review
7 Immediate publication on acceptance 7 Open access: articles freely available online 7 High visibility within the fi eld
7 Retaining the copyright to your article