© 2018, IRJET | Impact Factor value: 7.211 | ISO 9001:2008 Certified Journal | Page 2975
EFFECT OF PROCESS PARAMETERS ON MECHANICAL PROPERTIES OF
LASER BEAM WELDED JOINTS
B.Govardhan
1, P. Rama Murty Raju
2, S.Rajesh
31
M. Tech. (CAD/CAM) PG student, S.R.K.R Engineering College, Bhimavaram-534204
2
Professor, Department of mechanical engineering,
S.R.K.R. Engineering College Bhimavaram-534 204
3
Associate Professor, Department of mechanical engineering,
S.R.K.R. Engineering College Bhimavaram-534 204
---***---Abstract-
In the present study stainless steel material 304 grade was chosen for joining using laser beam welding process. Tensile strength and bending strength are considered as output responses. Empirical modeling of output responses in terms of process parameters is established and the effect of process parameters on the output variables has been studied. The effect of each parameter has been studied. Analysis of Variance (ANOVA) has been used for finding the contribution of each factor on the output parameters. The main effects plots and the interaction effect plots have been plotted in order to understand the actual effect of input on the output. The responses have been predicted by regression analysis using MINITAB..Keywords:
ANOVA, CO2 laser welding, MINITAB.1. INTRODUCTION
The acronym “LASER” stands for Light Amplification by Simulated Emission of Radiation is a coherent and amplified beam of electromagnetic radiation. The key element in making a practical laser is the light amplification achieved by stimulated emission due to the incident photons of high energy. Laser comprises of three components namely lasing medium, lasing energy source and optical delivery or feedback system. The laser medium may be a solid, liquid or gas. Laser light differs from ordinary light because it has photons of same frequency, wavelength and phase, laser beams are highly directional, have high power density and better focusing characteristics. Among different types of lasers Nd:YAG and CO2 are most widely used now a day’s. In this process material is joined by focusing highly intense laser beam on the work piece. Welding is a process of joining the surfaces of two work-pieces (usually metals) through localized coalescence. It is a precise, reliable, cost-effective, and high-tech method for joining materials. No other technique is as widely used by manufacturers to join metals and alloys efficiently and to add value to their products. Most of the familiar objects in modern society, from buildings and bridges, to vehicles, computers, and medical devices, could not be produced without the use of welding.
Nowadays, welding goes well beyond the bounds of its simple description. This technique is applied to a wide variety of materials and products, using advanced technologies, such as lasers and plasma arcs. The future of welding holds even greater promise as methods are devised
for joining dissimilar and non-metallic materials, and for creating products of innovative shapes and designs. Lot of researchers are investigation to deal with the estimation of weld bead geometry, Heat affected zone, hardness and microstructure. Balasubramaniam (1) Investigated that beam power and weld speed are major process parameters influencing on depth of penetration and bead width. This thesis tries to clarify the various background issues concerning the laser beam welding of stainless steels.Codigo Do Tradalho (2) has carried out investigation to weld joint gap on 304L stainless steel using CO2 laser welded joints to
characterize weld bead geometry.
2. Literature Review
Alexandra et.al (2003) has worked on laser beam welding hard metals to steel. They have examined Laser beam weld ability of hard metals to steel with high power (cw) CO2
laser, (cw) Nd: YAG laser and (pw) Nd: YAG laser.
They have deduced that the laser beam welding process has the overall advantage of producing small beads and HAZ and minimizing residual stresses. Continuous Nd: YAG laser was found to present the best results.
Ribolla et.al (2005) has investigated the use of Nd: YAG laser weld for large scale volume assembly of automotive body in white. They have suggested some advantages in laser welding as a variety of benefits over other types of welding. Deep penetration of precise narrow welds, small heat affected zone, low heat input, fast weld times, minimum part distortion, no secondary processing and high repeatability can be mentioned as great advantages.
Balasubramanian et.al(2006) has worked on Mathematical and ANN Modeling of Nd: YAG laser welding of thin SS Sheets. The effect of laser power (0.6-1.4 kW), welding speed (0.8-2 m/min) and shielding gas flow rate (5 - 15 l/min) on the weld-bead geometry i.e. depth of penetration (DOP), weld bead width (BW) was investigated. The experiment was designed on three levels Box-Behnken design with replication. Modeling was done using artificial neural network and multiple regression analysis. Comparison of neural network model and multiple linear regression model was made.
© 2018, IRJET | Impact Factor value: 7.211 | ISO 9001:2008 Certified Journal | Page 2976 stainless steels. They have studied the influence of the laser
beam position, with respect to the joint, on weld characteristics. The joints were examined in an optical microscope for cracks, pores and to determine the weld geometry. The microstructure of the weld and the heat affected zones were observed in a scanning electron microscope. Vickers microhardness testing and tensile testing were carried out to determine the mechanical properties of the weld.
Glowski et.al(2009) have studied the characteristics of Nd: YAG laser welded joints of dual phase steel. They have presented the examination results of microstructure, mechanical properties, fatigue strength and residual stresses of Nd: YAG laser welded joints in dual phase HDT580X steel. They have concluded that the laser welding parameters were appropriate to obtain sound welds. They have indicated that it was possible to achieve good quality welds by the application of proper welding parameters.
Padmanaban et.al (2010) has worked on an optimization of laser beam welding process parameters to attain maximum tensile strength in AZ31B magnesium alloy. An empirical relationship was developed to predict tensile strength of the laser beam welded AZ31B magnesium alloy by incorporating process parameters such as laser power, welding speed and focal position. The experiments were conducted based on a three factor, three level, central composite face centered design matrix with full replications technique. The empirical relationship can be used to predict the tensile strength of laser beam welded AZ31B magnesium alloy joints at 95% confidence level. The results indicate that the welding speed has the greatest influence on tensile strength, followed by laser power and focal position.
Ruggiero et.al (2011) have investigated weld-bead profile and costs optimization of the CO2 dissimilar laser welding process of low carbon steel and austenitic steel AISI316. The effect of laser power (1.1–1.43kW), welding speed (25– 75 cm/min) and focal point position (- 0.8 to - 0.2 mm) on the weld-bead geometry (i.e. weld-bead area, A; upper width, Wu; lower width, Wl and middle width, Wm) and on the operating cost C was investigated using response surface methodology (RSM). The results indicate that the proposed models predict the responses adequately within the limits of welding parameters being used. They have used regression equations to find optimum welding conditions for the desired geometric criteria. They have concluded that the welding speed is the parameter that most significantly influences the main weld bead dimensions.
Sathiya et.al (2012) have worked on optimal design for laser beam butt welding process parameter using artificial neural networks and genetic algorithm for super austenitic stainless steel. In that study, the weld bead geometry such as depth of penetration (DP), bead width (BW) and tensile strength (TS) of the laser welded butt joints made of AISI 904L super austenitic stainless steel were investigated. They have developed Artificial Neural networks (ANN) program in
Matlab software to establish the relationships between the laser welding input parameters like beam power, travel speed and focal position and the three responses DP, BW and TS in three different shielding gases(Argon, Helium and Nitrogen).
Yang dongxia et.al (2012) has worked on Optimization of weld bead geometry in laser welding with filler wire process using Taguchi’s approach. In their work, laser welding with filler wire was successfully applied to joining a new-type Al– Mg alloy. Welding parameters of laser power, welding speed and wire feed rate were carefully selected with the objective of producing a weld joint with the minimum weld bead width and the fusion zone area.
This paper aimed to examine the influence of weld speed, power and focusing distance on the welded joint performance. The effect of each parameter has been studied. Analysis of Variance (ANOVA) has been used for finding the contribution of each factor on the output parameters. The main effects plots and the interaction effect plots have been plotted in order to understand the actual effect of input on the output. The responses have been predicted by regression analysis using MINITAB.
3. DESIGN OF EXPERIMENT, EXPERIMENT
WORK AND MEASUREMENT
This is a non- contact process that requires access to the weld zone from one side of the parts being welded. The weld is formed as the intense laser light rapidly heats the material typically calculated in milliseconds. Laser welding is a joining process where laser are used as a heating source for joining the two metal parts. Many advantages of laser welding technology such as high speed and noncontact welding make the use of the technology more attractive in the automotive industry. Quit a number of researchers work has been studied on CO2 laser welding. used 20 kW CO2 laser for welding of mild steel to determine the plasma absorption in the keyhole based on photodiode measurements and spectroscopic measurements. They observed that the plasma absorption of the laser beam can’t neglect in certain welding conditions and plasma studied on the welding of low carbon steel by using the 4KW CO2 laser. The welding parameters were laser power 4KW, welding speed 1.2m/min, shielding gas Helium and Argon its flow rate 11L/min.
© 2018, IRJET | Impact Factor value: 7.211 | ISO 9001:2008 Certified Journal | Page 2977 welded should be very smooth. So the surfaces are finished
in grinding machine. To remove the bur filing was done.
[image:3.595.318.558.71.171.2]In finishing operation the stainless steel sheet should be continued with very slowly and steadily. So precaution was taken. After converting the big sheets of stainless steel in to small sheets of dimension the small sheets are aligned on the table of the welding machine. The machine used to weld the two sheets of metal.
3.1 welding process
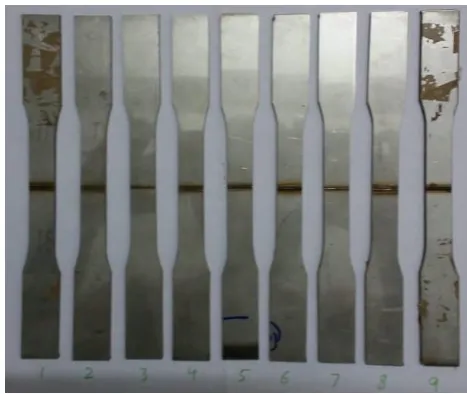
Welding takes place by placing two 304L SS material of 100*100*3mm size are first placing both faces to ensure that the joint must in ZERO-gap. First operator place the specimen holder with the two specimens to be joined and then pass a low powered LASER beam up on the joint to check the position and direction .spot three high power beam on the joint to ensure that line of direction, after that specified parameters laser beam passed over the specimen for weld and then cool down the welded joint with the help compressed air. Repeat the 9 joints as per given parameter sheet shown in parameter table 1.Figure 1 consist of laser welded joint
Figure1
Laser welded joint
The above figure shows LASER beam welded joint specimen the dimension was 200*100*3mm total 9 specimen are prepared
3.2 sub specimen preparation
The welded samples are machined with water jet cutting to obtain the required sub sample because in this machining HAZ and lubricant are absent which effect on output parameters.
As per ASTM E8M standards sample dimensions are chosen for TENSILE test and BENDING test dimensions are given in below fig 2
Figure 2 specimen dimension
[image:3.595.322.556.234.431.2]For bending 200*20*3mm sub-samples are machined by using water jet cutting to obtain specified design shape.
Figure 3 Tensile test specimens
[image:3.595.308.565.527.745.2]Tensile test the 200*100 mm laser weld blanks were machined into standard ASTM E8 sheet type sub size transverse weld tensile specimens are shown in fig 3.
Table 1 Parameter Sheet
Input Parameters Output Parameters
Exp No.
power
(W)
Weld
speed (m/min )
Focal
position
(mm)
Tensile
Strength
(MPa)
Bending
Strength
(MPa)
% of
© 2018, IRJET | Impact Factor value: 7.211 | ISO 9001:2008 Certified Journal | Page 2978 From the table 1, it is identified that the minimum ultimate
tensile strength value 596 Mpa is obtained at the value of 1.7 KW Power, 1.0 mm/min travelling speed and +2 mm focal position, zero position length is 200 mm. The maximum ultimate tensile strength value 741 Mpa is obtained at the value of 2.25 KW Power, 2000 mm/min travelling speed and -2 mm focal position.
[image:4.595.313.556.200.400.2]Figure 4 and 5 shows specimen after testing is tensile tested specimen and bending tested specimen.
Figure 4 Tensile specimens after testing , Figure 5 Bending specimens after testing
4 Results & Discussion
Taguchi approach is an effective approach for optimization. There have been plenty of recent applications of Taguchi approach to various mechanical engineering fields for process optimization. Hence, in this work optimization of LBW process parameters and statistical analysis of the experimental data was carried out. Initially Taguchi technique was applied to the L9 orthogonal array experiments in order to identify the optimal values for strength characteristics such as Tensile Strength (TS) and Bending strength (BS) in LBW process. In addition to it linear regression analysis was performed in order to establish a relationship between process parameters and output responses using MINITAB software. Later, ANOVA was performed to observe the parameters which affect significantly the mechanical strength characteristics of LBW joints.
4.1 Main Effects of Process Parameters on
Output Responses
4.1.1 Direct effect of process parameters on
Tensile strength
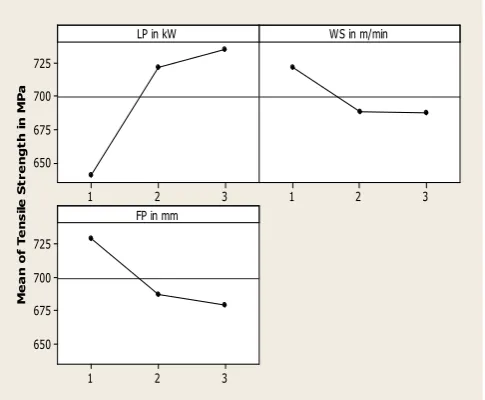
Figure 6 shows the main effects plots for the means of tensile strength values. It indicates the variation of tensile strength values with respect to various process parameters. As seen in Figure 6, tensile strength increases with the increase in Laser Power (LP). Increase in laser power increases the level of discharge energy and which subsequently causes more powerful explosion and results in more melting occurs from the work piece. Hence higher values of Laser power leads to greater amount of weld joint efficiency. On the contrary,
from the same plot it was observed that tensile strength decreases with the increase in weld speed. This happens as the time for contact between laser beam and work piece decreases then less amount of time period gets to weld it lead poor weld. Tensile strength is decreased with the change in type of laser used. Almost similar pattern was observed with change in weld speed, as depicted in Figure 6, Tensile strength is slightly decreased with increase in focal point
.
M
e
a
n
o
f
T
e
n
s
ile
S
tr
e
n
g
th
i
n
M
P
a
3 2 1
725
700
675
650
3 2 1
3 2 1
725
700
675
650
LP in kW WS in m/min
FP in mm
Figure 6 Effect of process parameters on tensile strength
4.1.2 Direct effect of process parameters on
bending strength
[image:4.595.40.284.206.327.2]© 2018, IRJET | Impact Factor value: 7.211 | ISO 9001:2008 Certified Journal | Page 2979
M
e
a
n
o
f
B
e
n
d
in
g
S
tr
e
n
g
th
in
M
P
a
3 2
1 650
625
600
575
550
3 2
1
3 2
1 650
625
600
575
550
LP in kW WS in m/min
FP in mm
[image:5.595.295.566.51.338.2]Main Effects Plot (data means) for Bending Strength in MPa
Figure 7 Effect of process parameters on bending strength
4.2 ANOVA for output responses
4.2.1 ANOVA for Tensile Strength
In order to investigate the significantly affecting parameters on tensile strength, ANOVA of experimental data was performed for analyzing the influence of laser power (LP); weld speed (WS) and focal point (FP) on the total variance of the results. In addition, the Fisher’s F-test can also be used to determine the parameters which have a significant effect on the response variable when F is large. The results of ANOVA for tensile strength are shown in Table 2. The last column of the tables indicates the percentage contribution of each factor on the total variation, thus indicating the degree of influence on the tested result. From the analysis of Table 2, it can be observed that the parameters laser power (61.38%) and focal distance (17.14%) influence the tensile strength, whereas the weld speed (8.7%) had lesser then error so no influence on tensile strength. Especially the laser power has greater influence when compared to rest of the factors.
The influence of each control parameter on tensile strength was represented in Figure 8 graphically. The factors present a physical significance when a percentage of contribution of LP and FP parameter is greater than error associated except weld speed. From the ANOVA results, it is clear that the error associated is approximately 12.76% for tensile strength.
Table 2 Results of the ANOVA for tensile strength
Predictor SS DF Variance Fcalculated Percentage contribution
Laser power
KW 15587 2 7793.5 4.81 61.38
Weld speed
m/min 2211 2 1105.5 0.68 8.7
Focal distance
mm 4354 2 2177 1.34 17.14
Error 3241 2 1620.5 12.76
Total 25393 8 100.00
Figure 8 Percentage contributions of process factors on tensile strength
Hence in this study, it was found that laser power and focal distance had physical significant effect on the tensile strength.
4.2.2 ANOVA for bending strength
Table 3 shows the ANOVA results for bending strength. From this table it can be depicted that parameters laser power (30.06%) and focal distance (24.88%) influence the bending strength, whereas the parameter weld speed (21.20%) had no
influence on the bending strength. Especially the laser power
has greater influence on bending strength when compared to rest of the factors. The influence of each control parameter on bending strength was represented in Figure 9 graphically. From the ANOVA results, it is clear that the error associated is approximately 23.84% for bending strength. In this study, it was found that laser power have physical significant effect on bending strength.
Table 3 Results of the ANOVA for bending strength
Predictor SS DF Variance F-calculated Percentage contribution
Laser power
KW 15541 2 7770.5 1.26 30.06
Weld speed
[image:5.595.40.286.57.251.2]© 2018, IRJET | Impact Factor value: 7.211 | ISO 9001:2008 Certified Journal | Page 2980 Focal
distance
mm 12867 2 6433.5 1.04 24.88
Error 12326 2 6163 23.84
[image:6.595.35.293.73.373.2]Total 51696 8 100
Figure 9 Percentage contributions of process factors on bending strength
4.3 Regression Analysis of Output Responses
Mathematical models for Tensile strength (TS) and bending strength (BS) responses in terms of control variables were developed in the preliminary stage with the regression technique. In the secondary stage Taguchi technique was applied to the L9 orthogonal array experiments in order to identify the optimal values for TS and BS. Using a Minitab version 9 analysis of the influence of each control factors on TS and BS has been performed with SNR response. Experimental layout and their results with calculated SNR for the TS and BS of the composite are furnished in Table 1.8. Considering the TS and BS as response variables and the control factors as inputs, it is possible to develop a mathematical model expressing the relationship between the output and input. The correlations between the main factors and their interactions with TS and BS of the LBW joints were obtained by performing regression analysis. The following Equations 1 and 2 were developed with an R-Sq 83.9% and 80.9% for TS and BS response variables respectively using method of least squares.
TS in MPa = 688+47.1 LP in KW -16.7 WS in m/min -25.0 FP in mm (Eq. 1)
(R-Sq = 83.9% R-Sq (adj) = 78.2%)
BS in MPa = 679+46.8 LP in KW – 36.3 WS in m/min -41.7 FP in mm (Eq. 2)
(R-Sq = 80.9% R-Sq (adj) = 77.5%
The adequacy of the models as represented by Equations 1 and 1 are checked using the normal probability plot of residuals for TS and BS as shown in Figure 10 and Figure 11 It can be observed that the points are close to the normal probability line and thus evidencing the model adequacy. Another way of ascertaining about the models adequacy is by plotting the residuals against fitted values of TS and BS. It can be observed that the points representing the residuals are randomly scattered. Thus, the mathematical models formulated for prediction of TS and BS as represented by Equations 1 and 2 are adequate. The values of the TS and BS can be predicted by. Substitute the coded values of the variables in the equation 1 and 2 respectively.
Residual P e rc e n t 80 40 0 -40 -80 99 90 50 10 1 Fitted Value R e si d u a l 760 720 680 640 600 50 25 0 -25 -50 Residual F re q u e n cy 40 20 0 -20 -40 3 2 1 0 Observation Order R e si d u a l 9 8 7 6 5 4 3 2 1 50 25 0 -25 -50
Normal Probability Plot of the Residuals Residuals Versus the Fitted Values
Histogram of the Residuals Residuals Versus the Order of the Data
Figure 10 Residual Plots for Tensile strength
Residual P e rc e n t 100 50 0 -50 -100 99 90 50 10 1 Fitted Value R e si d u a l 700 650 600 550 500 50 0 -50 -100 Residual F re q u e n cy 60 40 20 0 -20 -40 -60 -80 2.0 1.5 1.0 0.5 0.0 Observation Order R e si d u a l 9 8 7 6 5 4 3 2 1 50 0 -50 -100
Normal Probability Plot of the Residuals Residuals Versus the Fitted Values
[image:6.595.310.564.245.434.2]Histogram of the Residuals Residuals Versus the Order of the Data
Figure 11 Residual Plots for bending strength
4.4
SNR Analysis of Output Responses
[image:6.595.310.565.471.657.2]© 2018, IRJET | Impact Factor value: 7.211 | ISO 9001:2008 Certified Journal | Page 2981 quality characteristics of the product/process to be
[image:7.595.39.277.338.504.2]optimized. The standard SNRs generally used are as follows: nominal-is-best (NB), lower-the-better (LB), and higher-the-better (HB). The optimal setting is the parameter combination, which has the highest SNR. In this investigation higher-the-better (HB) is used for TS and lower-the-better (LB) SNR ratio is employed for BS response functions.
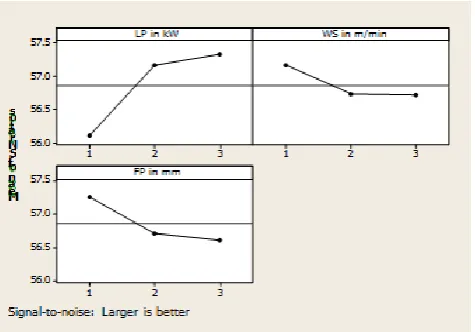
Figure 12 and Figure 13 shows the main effects plots for the TS and BS for SNR mean values. It can be observed form Figures that the greater the SNR, smaller is the variance of the TS around a desired value. It can also be observed that the optimal testing conditions of the control factors can easily be determined. The plot shows the change in SNR when the setting of the control factor was changed form one level to other. The best value is found to be at higher SNR value. From Figures it can also be seen for tested samples the optimum condition for tensile strength becomes LP1 WS1 and
FP1 whereas for bending strength the optimum conditions
observed are LP1 WS1 and FP1 for main control factors
[image:7.595.40.282.542.726.2]respectively.
Figure 12 SNR Analyses for Tensile Strength
Figure 13 SNR Analyses for Bending Strength
5 Conclusions
Experiments were conducted on LBW to evaluate the strength characteristics of 304 stainless steel welded joints .Laser power, welding speed and focal point distance were considered as process parameters while tensile strength and bending strength were considered as output responses. Conclusions derived by application of Regression and Taguchi analysis of experimental results are as follows:
Empirical linear regression equations are developed for predicting the bending test errors and tensile test errors respectively within selected experimental conditions.
The Taguchi method was applied in order to identify the optimized values of process parameters by taking maximum Tensile strength and maximum bending strength.
Based on the ANOVA results for tensile strength, it was depicted that the process parameters, laser power, weld speed and focal point distance have more influence on the strength.
In case of bending strength laser power, Focal point exert a significant effect, whereas the parameters weld speed and have less significant effect on the bending strength.
Referances
(1) Balasubramanian, K. R., Buvanashekaran, G., Sankaranarayanasamy, K. (2010). Modeling of laser beam welding of stainless steel sheet butt joint using neural networks, CIRP Journal of Manufacturing Science and Technology, Vol. 3, No. 1, 80-84
(2) Codigo Do Trabalho: 021018171. (2009). Characterization of Nd:YAG pulsed laser welded austenitic AISI 304L stainless steel, V congresso brasileiro de engenharia de fabricação 14 a 17 de abril de 2009, Belo Horizonte, Minas
Gerais, Brasil. Online
http://www.ipen.br/biblioteca/2009/eventos/14600.pdf.
(3) Alexandra, P. Costa, Luisa Quintino, Martin, Greitmann (2003). Laser beam welding hard metals to steel. Journal of Materials Processing Technology 141 163–173.
(4) Ribolla, A., Damoulis, G.L., Batalha G.F. (2005). The use of Nd: YAG laser weld for large scale volume assembly of automotive body in white Journal of Materials Processing Technology 164–165 1120–1127.
(5) Balasubramanian, K. R., Buvanashekaran G. and Sankaranarayanasamy K. (2006). Mathematical and ANN Modeling of Nd: YAG Laser Welding of Thin SS Sheets. International Journal for the Joining of Materials, Volume 18 No. 3/4 , December 2006, pp 99-104. ISSN 0905-6866.
© 2018, IRJET | Impact Factor value: 7.211 | ISO 9001:2008 Certified Journal | Page 2982 960– 966.
(7) Wglowski, M.S., Kwieciski, K. Krasnowski, K., Jachym, R. (2009). Characteristics of Nd: YAG laser welded joints of dual phase steel. Archives of civil and mechanical engineering, Vol. IX No. 4.
(8) Padmanaban, G. and Balasubramanian, V. (2010). An Optimization of laser beam welding process parameters to attain maximum tensile strength in AZ31B magnesium alloy Optics & Laser Technology 42 (2010) 1253–1260.
(9) Sathiya, P., Panneerselvam, K. and Soundararajan, R. (2010). Optimal design for laser beam butt welding process parameter using artificial neural networks and genetic algorithm for super austenitic stainless steel / Optics & Laser Technology 44.1905–1914
(10) Minitab 16 software for quality improvement by MINITAB
(11) A Hussain, A H Hamdani and R Akhter 1 Pakistan Institute of Lasers & Optics, P.O. Box 505, Rawalpindi, Pakistan