Investigating the Impact of Co-located and Distributed
Collaboration Using Multi-touch Tables
ALGHANIM, FIRAS,LOTFI
How to cite:
ALGHANIM, FIRAS,LOTFI (2013) Investigating the Impact of Co-located and Distributed Collaboration Using Multi-touch Tables, Durham theses, Durham University. Available at Durham E-Theses Online:
http://etheses.dur.ac.uk/7383/
Use policy
The full-text may be used and/or reproduced, and given to third parties in any format or medium, without prior permission or charge, for personal research or study, educational, or not-for-prot purposes provided that:
• a full bibliographic reference is made to the original source • alinkis made to the metadata record in Durham E-Theses • the full-text is not changed in any way
The full-text must not be sold in any format or medium without the formal permission of the copyright holders. Please consult thefull Durham E-Theses policyfor further details.
Academic Support Oce, Durham University, University Oce, Old Elvet, Durham DH1 3HP e-mail: [email protected] Tel: +44 0191 334 6107
Distributed Collaboration Using Multi-touch
Tables
Firas Lotfi Alghanim
2013
PhD Thesis
A thesis presented for the degree of a Doctor of Philosophy
School of Engineering and Computing Sciences
Technology Enhanced Learning Research Group SynergyNet Project
With the intention to study the role of new interfaces in multi-user applications, multi-touch tabletops are investigated to examine if they effectively aid their users in working together synchronously. Multi-player games are selected as a case of collaborative work. Early studies of distributed multi-touch tabletops did not cover the HCI related aspects associated with multi-player games, especially in distributed configuration. The performance, collaboration, and usability aspects of HCI are studied in this research. A simple multi-player maze game has been designed and implemented over two connected and physically separated multi-touch tabletops. The aim of this work is to investigate the effects of distribution on players performance, collaboration, and usability of multi-player games over multi-touch tabletops, compared to playing in a co-located condition. Groups of participants have been randomly selected and assigned to play the game in pairs under two conditions: co-located where two players are playing the game on the same table, and distributed where they are playing the game but on separate tables. The collected data is statistically analysed to test for differences between the two conditions, as well as the differences of the strength of the correlation between the underlying factors. The results indicate that, in general, the differences are not significant for such type of applications if a simple and efficient communication mechanism is provided for the players in the distributed condition. Players expressed almost the same level of usability engagement and enjoyment for the two conditions. This may have a strong impact on the HCI aspects when designing such type of applications on the future.
This thesis is lovingly dedicated to my sons, Faisal and Khalid, who came into my life while I was doing this research.
It would not have been possible to write this doctoral thesis without the help and support of the kind people around me, to only some of whom it is possible to give particular mention here.
Above all, I would like to thank my father who introduced me to the joy of science and knowledge since my childhood, and my mother who constantly and passionately motivated me. No words are enough to say to my wife,Hanan, who was a great source for encouragement, endurance, and love; her support and patience were invaluable.
I am extremely grateful to my supervisor, Prof. Liz Burd, she was an amazing source of support, guidance, and motivation in all aspects, technical and personal.
I would like to acknowledge the financial and administrative support of Durham University, in the UK, and Princess Sumaya University for Technology, in Jordan, who gave me this opportunity to complete my PhD.
I am also grateful to my Father-in-Law who helped me in the complicated procedures of getting the required approvals for this scholarship.
I also thank my colleagues and friends in Technology Enhanced Learning Research Group, Durham University, for their help and share of information; in particular, Iyad Alagha for his insightful suggestions and ideas, and James McNaughton for his technical assistance.
I, also, would like to acknowledge that the hardware and software framework for this research were provided by the ESRC under grant research number RES-139-25-0400.
Finally, I would like to thank all my friends inside and outside the UK for their support and help all the way.
Copyright © 2013 Firas Alghanim
The copyright of this thesis rests with the author. No quotation from it should be published without the author’s prior written consent and information derived from it should be acknowledged.
Declaration
No part of the material provided has previously been submitted by the author for a higher degree in Durham University or in any other university. All the work presented here is the sole work of the author and no one else.
Contents Overview
List of Figures xv
List of Tables xvii
1 Introduction 19
1.1 Motivation and Context of Work . . . 20
1.2 Objectives . . . 21
1.3 Approach . . . 21
1.4 Criteria for Success . . . 23
1.5 Thesis Outline . . . 25
2 Literature Review 27 2.1 Human Computer Interaction (HCI) . . . 27
2.2 Collaborative Group Work . . . 49
2.3 Chapter Summary . . . 65
3 Method 66 3.1 Study Design . . . 66
3.2 Data Analysis Approaches . . . 73
3.3 Data Sources . . . 77
3.4 Answering Research Questions . . . 83
3.5 Analysis Framework . . . 87 3.6 Threats to Validity . . . 88 3.7 Experiment Sessions . . . 90 3.8 Chapter Summary . . . 93 4 System Design 95 4.1 The Game . . . 95
4.2 High Level Architecture . . . 100
CONTENTS OVERVIEW
5 Data, Analysis, and Results 109
5.1 Results Interpretation . . . 109
5.2 Group Performance . . . 110
5.3 Group Members Collaboration . . . 138
5.4 System Usability . . . 158
5.5 General Correlation Analysis . . . 170
5.6 Chapter Summary . . . 174
6 Discussion 176 6.1 Hypotheses Test Briefing . . . 176
6.2 Performance . . . 177 6.3 Collaboration . . . 182 6.4 Usability . . . 188 6.5 Relationships In General . . . 192 6.6 Chapter Summary . . . 196 7 Conclusions 198 7.1 Investigation Implications . . . 198 7.2 Contributions of Thesis . . . 201 7.3 Limitations of Study . . . 203 7.4 Future Work . . . 204
A Detailed Questionnaires Results 206 A.1 General Questions . . . 206
A.2 Comparative Questions . . . 211
A.3 Participants Additional Notes . . . 214
B Questionnaires 217 C System Log Sample 226 D Video Timeline Sample 227 D.1 Co-Located Video . . . 228
D.2 Distributed Videos . . . 229
D.3 Output Sheet . . . 230
E Ethics and Consent Forms 231
Contents
List of Figures xv
List of Tables xvii
1 Introduction 19
1.1 Motivation and Context of Work . . . 20
1.1.1 Assumptions . . . 21
1.2 Objectives . . . 21
1.3 Approach . . . 21
1.4 Criteria for Success . . . 23
1.4.1 Research questions . . . 24
1.5 Thesis Outline . . . 25
2 Literature Review 27 2.1 Human Computer Interaction (HCI) . . . 27
2.1.1 Towards GUI tabletop metaphor . . . 30
2.1.1.1 WIMP interfaces . . . 32
2.1.1.2 Post-WIMP interfaces . . . 35
2.1.2 Interaction styles . . . 38
2.1.2.1 Direct manipulation interaction . . . 41
2.1.3 Reality based interaction . . . 43
2.1.4 Multi-touch groupware usability . . . 45
2.1.5 Multi-touch Tabletops . . . 46
2.2 Collaborative Group Work . . . 49
2.2.1 Cognition in CSCW . . . 51
2.2.2 How people work around tabletops . . . 52
2.2.3 Group awareness . . . 53
2.2.4 The role of artefact orientation . . . 54
Contents
2.2.5.1 Collaboration styles . . . 56
2.2.6 Effects of users distribution . . . 58
2.2.6.1 Collaboration with distributed remote tabletops . . . 60
2.2.7 Computer games . . . 62
2.2.7.1 What can games teach us about HCI and Collaboration? 63 2.2.7.2 Games and multi-touch tabletops . . . 64
2.3 Chapter Summary . . . 65
3 Method 66 3.1 Study Design . . . 66
3.1.1 Overview of design techniques . . . 68
3.1.1.1 Between-group design . . . 69
3.1.1.2 Within-subjects design . . . 69
3.1.2 Variables . . . 71
3.2 Data Analysis Approaches . . . 73
3.2.1 Null hypothesis . . . 74
3.2.2 Parametric tests assumptions . . . 74
3.2.2.1 Testing for normality of data distribution . . . 74
3.2.2.2 Testing for homogeneity of variances . . . 75
3.2.3 Paired-samples t-test . . . 76 3.2.4 Correlation . . . 76 3.2.5 Gini coefficient . . . 77 3.3 Data Sources . . . 77 3.3.1 Participants . . . 78 3.3.2 Data preparation . . . 78
3.3.2.1 Extracting data from questionnaires . . . 79
3.3.2.2 Extracting data from system logs . . . 80
3.3.2.3 Extracting data from video recordings . . . 80
3.3.3 Dealing with outliers . . . 81
3.3.3.1 Outliers detection . . . 81
3.3.3.2 Outcomes . . . 82
3.4 Answering Research Questions . . . 83
3.4.1 Investigation 1: Users performanceanalysis . . . 84
3.4.2 Investigation 2: Users collaborationanalysis . . . 85
3.4.3 Investigation 3: System usability analysis . . . 86
3.5 Analysis Framework . . . 87
3.6 Threats to Validity . . . 88
3.7 Experiment Sessions . . . 90
3.7.1 Pilot experiment . . . 90
3.7.2 Experiment theatre layout . . . 90
3.7.3 Experiment session procedure . . . 91
3.8 Chapter Summary . . . 93
4 System Design 95 4.1 The Game . . . 95
4.1.1 Supporting the aspects of the research . . . 96
4.1.2 Application specifications . . . 96
4.1.2.1 Game start . . . 97
4.1.2.2 Selecting a link . . . 97
4.1.2.3 Panels . . . 98
4.1.2.4 Distributed assistance . . . 99
4.2 High Level Architecture . . . 100
4.2.1 SynergyNet framework . . . 100
4.2.2 The application . . . 102
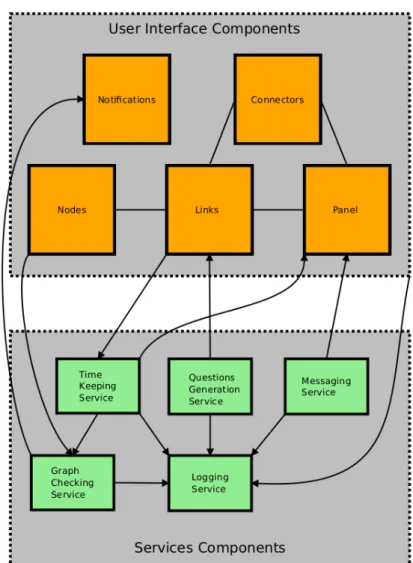
4.2.2.1 User interface components . . . 103
4.2.2.2 Services components . . . 105
4.2.2.3 Connecting two tables . . . 106
4.3 Chapter Summary . . . 108
5 Data, Analysis, and Results 109 5.1 Results Interpretation . . . 109
5.1.1 Basic descriptive statistics . . . 109
5.1.2 Graphs . . . 110
5.2 Group Performance . . . 110
5.2.1 Efficiency . . . 111
5.2.1.1 Basic descriptive findings . . . 112
5.2.1.2 Investigating differences . . . 113
5.2.1.3 Sub-factors correlation . . . 115
5.2.2 Accuracy . . . 120
5.2.2.1 Basic descriptive findings . . . 121
5.2.2.2 Investigating differences . . . 121
Contents
5.2.3 Performance factors correlation . . . 128
5.2.3.1 Co-located . . . 129
5.2.3.2 Distributed . . . 132
5.2.3.3 Comparison . . . 135
5.2.4 Summary . . . 137
5.3 Group Members Collaboration . . . 138
5.3.1 Collaboration styles . . . 138
5.3.1.1 Basic descriptive findings . . . 139
5.3.1.2 Investigating differences . . . 140
5.3.2 Players communication . . . 144
5.3.2.1 Basic descriptive findings . . . 145
5.3.2.2 Investigating differences . . . 146
5.3.3 Contribution balance . . . 151
5.3.3.1 Basic descriptive findings . . . 152
5.3.3.2 Investigating differences . . . 153
5.3.4 Summary . . . 157
5.4 System Usability . . . 158
5.4.1 Basic descriptive findings . . . 159
5.4.1.1 Central tendency interpretation . . . 159
5.4.1.2 General findings . . . 159
5.4.1.3 Comparative findings . . . 161
5.4.2 Investigating differences . . . 162
5.4.2.1 Satisfaction . . . 163
5.4.2.2 Ease of use and learn . . . 164
5.4.2.3 Physical and cognition demand . . . 165
5.4.3 Sub-factors correlations . . . 166
5.4.3.1 Co-located . . . 166
5.4.3.2 Distributed . . . 167
5.4.3.3 Comparison . . . 168
5.4.4 Summary . . . 170
5.5 General Correlation Analysis . . . 170
5.5.1 Correlation test results . . . 170
5.5.2 Comparison . . . 171
5.5.3 Summary . . . 174
6 Discussion 176
6.1 Hypotheses Test Briefing . . . 176
6.2 Performance . . . 177 6.2.1 Efficiency . . . 177 6.2.2 Accuracy . . . 180 6.2.3 Correlations . . . 181 6.2.4 Summary . . . 182 6.3 Collaboration . . . 182 6.3.1 Collaboration styles . . . 182 6.3.2 Participants communication . . . 184 6.3.3 Contribution balance . . . 186 6.3.4 Summary . . . 188 6.4 Usability . . . 188 6.4.1 Satisfaction . . . 188
6.4.2 Ease of use and learn . . . 189
6.4.3 Physical and cognitive demand . . . 190
6.4.4 Correlations . . . 190
6.4.5 Summary . . . 191
6.5 Relationships In General . . . 192
6.5.1 Performance and collaborationrelationship . . . 192
6.5.2 Performance and usabilityrelationship . . . 194
6.5.3 Collaboration and usabilityrelationship . . . 195
6.5.4 Summary . . . 196 6.6 Chapter Summary . . . 196 7 Conclusions 198 7.1 Investigation Implications . . . 198 7.1.1 Performance . . . 198 7.1.2 Collaboration . . . 199 7.1.3 Usability . . . 200 7.2 Contributions of Thesis . . . 201
7.2.1 Impacts on tabletop interface software design . . . 201
7.3 Limitations of Study . . . 203
7.4 Future Work . . . 204
A Detailed Questionnaires Results 206 A.1 General Questions . . . 206
Contents
A.2 Comparative Questions . . . 211 A.3 Participants Additional Notes . . . 214
B Questionnaires 217
C System Log Sample 226
D Video Timeline Sample 227
D.1 Co-Located Video . . . 228 D.2 Distributed Videos . . . 229 D.3 Output Sheet . . . 230
E Ethics and Consent Forms 231
List of Figures
1.1 Two different collaboration scenarios . . . 22
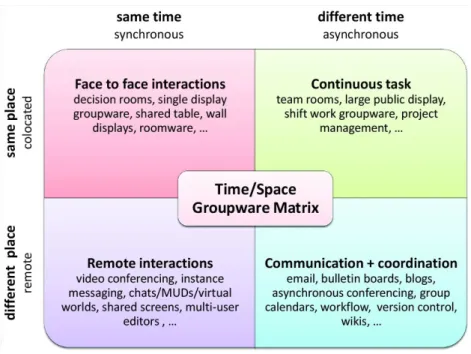
2.1 CSCW Matrix . . . 50
2.2 Collaboration styles and coupling as identified by Isenberg . . . 58
3.1 Co-located scenario (same table) . . . 67
3.2 Distributed scenario (two separate tables) . . . 67
3.3 Visually checking normality using Q-Q plots . . . 75
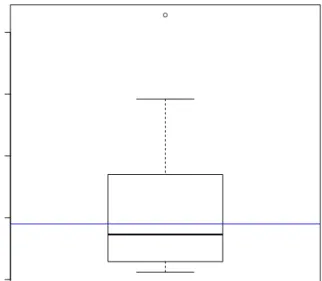
3.4 Outlier detected ineffort variable . . . 82
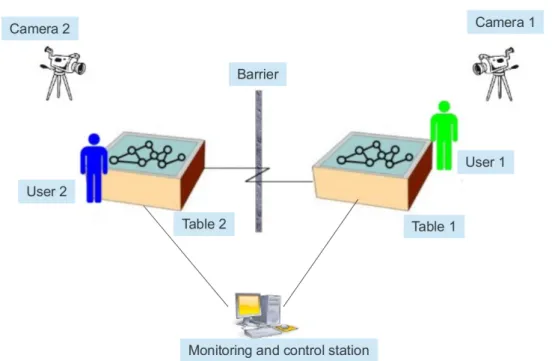
3.5 Abstract layout of the experiment space . . . 91
4.1 Players can change their physical position around the table . . . 97
4.2 Game start . . . 98
4.3 A link attached to one panel . . . 98
4.4 Two links attached . . . 99
4.5 A link attached to both panels . . . 99
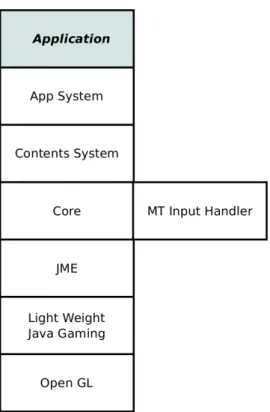
4.6 SynergyNet framework architecture . . . 101
4.7 Application structure . . . 102
4.8 Visual components . . . 103
4.9 The panel component . . . 104
4.10 Connecting two tables protocol . . . 107
5.1 Duration differences between the two conditions . . . 113
5.2 Effort differences between the two conditions . . . 114
5.3 Speed differences between the two conditions . . . 115
5.4 Efficiency sub-factors correlation in co-located scenario . . . 117
5.5 Efficiency sub-factors correlation in distributed scenario . . . 119
5.6 Incorrectness ratio differences between the two conditions . . . 122
5.7 Added Difficulty ratio differences between the two conditions . . . 123
List of Figures
5.9 Accuracy sub-factors correlation in co-located scenario . . . 126
5.10 Accuracy sub-factors correlation in distributed scenario . . . 127
5.11 Performancesub-factors correlation in co-located scenario . . . 130
5.12 Performancesub-factors correlation in distributed scenario . . . 134
5.13 CH Collaboration Style differences between the two conditions . . . 141
5.14 VE Collaboration Style differences between the two conditions . . . 142
5.15 SGP Collaboration Style differences between the two conditions . . . 143
5.16 SSP Collaboration Style differences between the two conditions . . . 144
5.17 Communication Frequency differences between the two conditions . . . 146
5.18 Communication Start Time differences between the two conditions . . . . 147
5.19 Communication Interval differences between the two conditions . . . 148
5.20 Communication Help Initiate differences between the two conditions . . . 149
5.21 Communication Help Response differences between the two conditions . . 150
5.22 Communication Response Time differences between the two conditions . . 151
5.23 Work contribution differences between the two conditions . . . 154
5.24 Gini Index for Work contribution differences between the two conditions . 155 5.25 Communication contribution differences between the two conditions . . . 156
5.26 Gini Index for Communication contribution differences between the two conditions . . . 157
5.27 Total User Satisfaction differences between the two conditions . . . 163
5.28 Total System Ease of Use and Learn differences between the two conditions164 5.29 Total Physical and Cognition Demand differences between the two conditions165 5.30 Usability sub-factors correlation in co-located scenario . . . 167
5.31 Usability sub-factors correlation in distributed scenario . . . 169 5.32 Significant sub-factors correlations in co-located (blue) and distributed (red)175
List of Tables
3.1 Groups and scenarios . . . 78
3.2 Mapping basic information to groups and members . . . 79
3.3 Investigations to answer the research questions . . . 84
5.1 Basic descriptive results for Efficiency sub-factors . . . 112
5.2 Efficiency sub-factors for each group in both scenarios . . . 116
5.3 Efficiency sub-factors r-coefficients in co-located scenario . . . 117
5.4 Efficiency coefficient of determination in co-located scenario . . . 118
5.5 Efficiency sub-factors r-coefficients in distributed scenario . . . 118
5.6 Efficiency coefficient of determination in distributed scenario . . . 119
5.7 Efficiency r-coefficient that are statistically significant . . . 119
5.8 Basic descriptive results for Accuracy sub-factors . . . 121
5.9 Accuracy sub-factors for each group in both scenarios . . . 125
5.10 Accuracy sub-factors r-coefficients in co-located scenario . . . 126
5.11 Accuracy coefficient of determination in co-located scenario . . . 126
5.12 Accuracy sub-factors r-coefficients in distributed scenario . . . 127
5.13 Accuracy coefficient of determination in distributed scenario . . . 128
5.14 Performancesub-factors r-coefficients in co-located scenario . . . 129
5.15 Performancesub-factors coefficient of determination in co-located scenario131 5.16 Performance sub-factors mean and standard deviation in co-located scenario . . . 131
5.17 Performancesub-factors r-coefficients in distributed scenario . . . 133
5.18 Performance sub-factors coefficient of determination in distributed scenario . . . 133
5.19 Performance sub-factors mean and standard deviation in distributed scenario . . . 135
5.20 Basic descriptive results for Collaboration Styles . . . 140
List of Tables
5.22 Basic descriptive results for Contribution Balance . . . 152
5.23 Gini Coefficient for all the groups . . . 153
5.24 usability three areas questions grouping . . . 159
5.25 Basic results for general questions . . . 160
5.26 Basic results for comparative questions . . . 161
5.27 Detailed t-test results for comparative questions . . . 162
5.28 Usability sub-factors r-coefficients in co-located scenario . . . 166
5.29 Usability coefficient of determination in co-located scenario . . . 167
5.30 Usability sub-factors r-coefficients in distributed scenario . . . 168
5.31 Usability coefficient of determination in distributed scenario . . . 168
5.32 Strong sub-factors correlations in co-located scenario . . . 171
5.33 Strong sub-factors correlations in distributed scenario . . . 171
5.34 Significant sub-factors correlations coefficients in co-located and distributed scenarios . . . 174
6.1 Performance hypotheses briefing . . . 177
6.2 Collaboration hypotheses briefing . . . 178
6.3 Usability hypotheses briefing . . . 179
6.4 Correlation hypothesis briefing . . . 179
6.5 Performanceand collaborationcorrelation coefficients . . . 192
6.6 Performanceand usability correlation coefficients . . . 194
1
Introduction
“If you want to go fast, go alone. If you want to go far, go together.” — African proverb
T
he topic of distribution of computer system’s users has been widely studied by researchers in a variety of academic disciplines such as learning, information management, human-computer interaction, and computer supported collaborative work. Distribution of users means that a system’s users are not in the same physical place, as oppose to being co-located, though they are using the same system at the same time. There are many software environments that support multi-users to work collaboratively together in co-located and distributed conditions. The majority of these software require the users to use the traditional interaction techniques of mouse-keyboard-monitor to perform tasks [7]. The co-located condition of users sitting around a single desktop computer to work collaboratively came across well documented problems such as inadequate space for collaborators to perform their task in various parts of the workspace [87]. These problems get more complicated when adding the distribution factor of users being physically separated and using more than one connected computer to work remotely and collaboratively [101]. Efforts to maintain remote collaboration tended to exploit conventional interaction of the traditional mouse-keyboard-monitor to facilitate common workspaces, however, these projects revealed the same problems as in the co-located condition in addition to the problem of users losing awareness of each other’s activities [87, 90].Multi-touch tabletops are investigated for they effectively aid their users in working collaboratively as they intuitively provide a natural multi-user interface [150]. The user interface of conventional software applications is designed traditionally as a single user system that presents other users and their activities in an unclear manner [7, 151]. Performing a certain task collaboratively needs a clear computerised support with a
1.1 Motivation and Context of Work
good user-centred interface that should allow and assist the collaborative interactions among users [142, 134]. Multi-touch interfaces can accommodate more than one user concurrently, which is particularly useful for collaborative work.
Adding the distribution factor has its implications on any software regardless of the platform [101]. Maintaining awareness and facilitating communication among collaborating users are two of the most significant obstacles that face remote collaborative software designers. Several studies have shown how multi-touch tables can be used in distributed configuration, and have reported the discovered problems and some proposed solutions for them (e.g. VideoArms [133]).
One interesting topic in collaborative work is multi-player games. They offer enormous potential for collaborative activities and shared experiences [81]. Furthermore, they provide the users (players) a more flexible and creative set of actions. Implementing multi-player games over multi-touch surfaces is not widely studied as other fields. That is the main reason of selecting this field of software as the instrument for this research.
1.1 Motivation and Context of Work
The proposed research shall consider some HCI (human-computer interaction) aspects that are inherent in remote collaboration when using multi-touch tabletops. These aspects fall in three main areas of study: performance,collaboration, andusability. These areas shall be the major criteria of comparison between the co-located and distributed conditions (or scenarios)1. Some of the aspects being studied are efficiency, accuracy,
equity of participation, and satisfaction. A multi-player game is designed and implemented to work in both configurations: co-located and distributed. Users participated in a two part experiment to analyse the differences between the two conditions.
Studying these HCI aspects can reveal interesting findings about how users interact with such applications in co-located and distributed scenarios, and that can help in suggesting recommendations and guidelines for multi-user applications designers for multi-touch surfaces.
1.1.1 Assumptions
• Networking techniques are not studied in this research; the tables used are connected to display the same content to distributed users as described in Chapter 4
• Gender, age, and education level are not considered in the evaluation, although they are presented in results
• The implemented game is only used as an instrument for collaborative work. Other aspects of computer games, such as graphics, effects, or genres, are not considered in this research
1.2 Objectives
This section presents the objectives of this research which include finding out whether there is a significant difference in the mentioned HCI aspects between the co-located and the distributed conditions. Previous researchers have studied such differences [22, 140], however, the objective of this research is different in that it focuses on the HCI aspects within the context of multi-player games.
Differences in performance, collaboration, and usability between the co-located and distributed conditions are thoroughly analysed in addition to the differences in the relationships among the aforementioned areas. This shall give the evidence to support the conclusions presented at the end of the research, which might be considered by software engineers when designing similar collaborative software environments.
1.3 Approach
Repeated-Measures (within-subject) experimental design has been used in this research. This design is more economic and helps in minimising the sources of random variations [42, 78]. Thirty two (32) participants were used for the experimental sessions. Each participant is exposed to both experiment conditions: co-located (same table) and
distributed (two different tables). The order of conditions in which a group is playing
is randomised among the groups to counterbalance the effect of conditions order. The task (game) that is given in both condition is similar in complexity, details, and time
1.3 Approach
allowance. Data has been collected in each session from both conditions to be analysed and compared for similarities and differences.
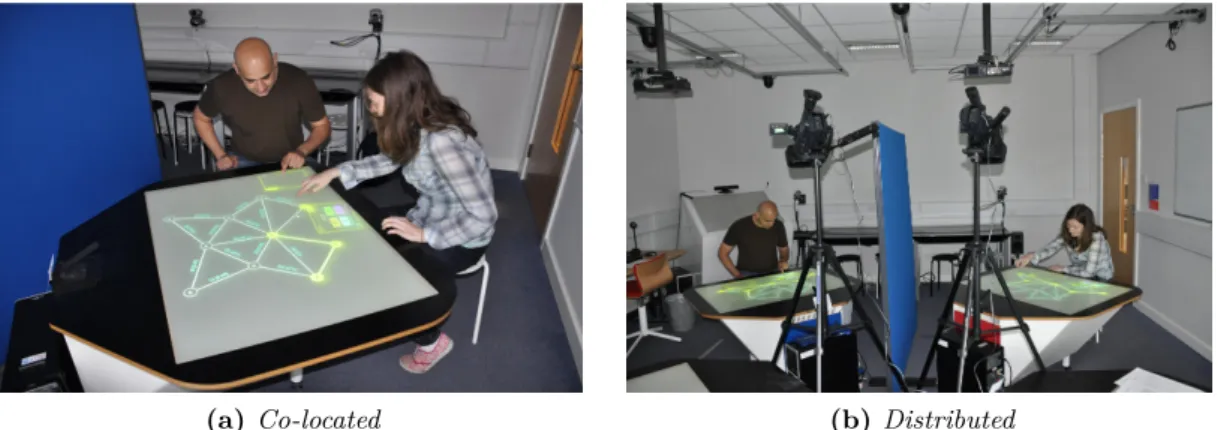
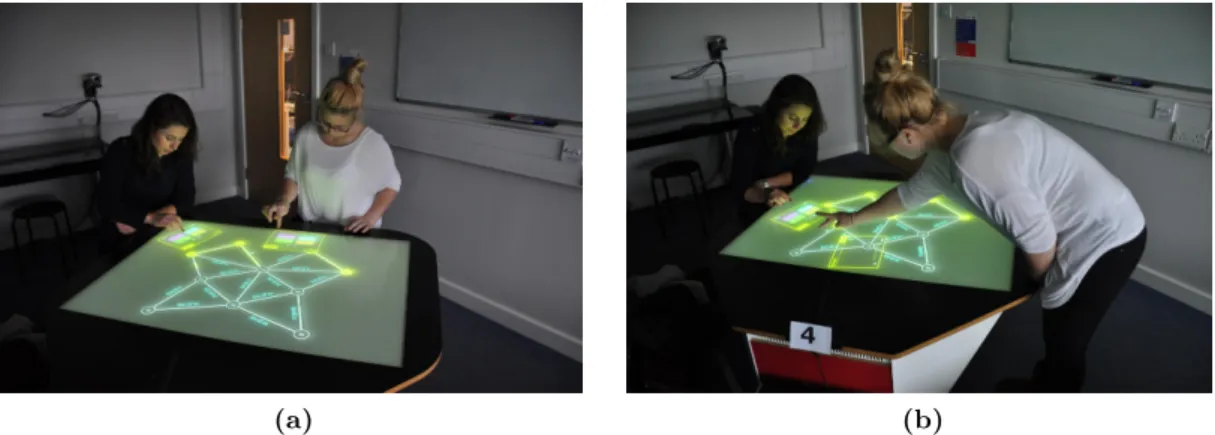
In co-located condition, the two players use the same table to play the game. They work together towards the same target and they are allowed to verbally communicate and discuss their plan and ask each other for help or offer help to each other (Figure 1.1a). On the other hand, in the distributed condition, the two players use physically separated tables connected together via the application. However, they are not allowed to verbally talk to each other nor to directly look to each other’s table. The application provides messaging mechanism for the players to communicate with each other by asking or offering help and by accepting or rejecting help (Figure 1.1b).
(a)Co-located (b) Distributed
Figure 1.1– Two different collaboration scenarios
The experimental session is video recorded in each condition, and the participants are asked to fill in a questionnaire after they finish each condition of the experiment. Another invaluable source of data is the system logs that capture all internal interactions with different parts of the game interface and the usage of the messaging communication system.
Chapters 3 and 4 shall present the methodology and system design for this research in greater detail.
1.4 Criteria for Success
In order for this study to succeed, the results of the experimental work is evaluated through statistical analysis. Statistical analysis methods2 require a set of hypotheses to be validated. These hypotheses are generated from the research questions which are important to be answered to reach the conclusions of this research. The proposed research questions are concerned with the HCI areas that were mentioned previously. These areas are:
1. User’s performance
a) Efficiency: a measurement of how fast a task can be completed; or, in other words, how long did it take a participant or a group to accomplish a given task
b) Accuracy: a measurement of how precise and effective are the results generated by the participants in a given task
2. Users collaboration
a) Styles: the collaboration styles that are adopted by the users during their group work
b) Communication: the factors that affect users’ communication during their group work
c) Contribution balance: a measurement of equity of participation between the users during their group work
3. System usability
a) Satisfaction: the user subjective satisfaction with the interaction experience b) Ease of use and learn: how easily the user can learn to interact with the new
system and to complete the given task
c) Physical and cognitive demand: the level of physical or cognitive requirements that the system exerts on users
For each area, a set of research questions with associated hypotheses are introduced, and will be answered and validated in later chapters (5 and 6). The following subsection briefs the proposed research questions3.
2 Discussed in Chapter 3.
1.4 Criteria for Success 1.4.1 Research questions
• RQ 1: Does group performance differ between the co-located and distributed
scenarios?
– RQ 1.1: Does efficiency differ between the co-located and distributed scenarios?
– RQ 1.2: Does accuracy differ between the co-located and distributed scenarios?
– RQ 1.3: Do correlations among performance sub-factors differ between the
co-located and distributed scenarios?
• RQ 2: Does participants collaboration differ between the co-located and distributed
scenarios?
– RQ 2.1: Do collaboration styles differ between the co-located and distributed
scenarios?
– RQ 2.2: Does participants communication differ between the co-located and
distributed scenarios?
– RQ 2.3: Does contribution balance differ between the co-located and distributed
scenarios?
• RQ 3: Does system usability differ between the co-located and distributed
scenarios?
– RQ 3.1: Does satisfaction differ between the co-located and distributed
scenarios?
– RQ 3.2: Does ease of use and learn differ between the co-located and
distributed scenarios?
– RQ 3.3: Does physical and cognitive demand differ between the co-located
and distributed scenarios?
– RQ 3.4: Do correlations among usability sub-factors differ between the
co-located and distributed scenarios?
• RQ 4: Do the internal relationships among the HCI aspects differ between the
co-located and distributed scenarios?
– RQ 4.1: Do the internal relationships among the sub-factors of performance
and collaboration differ between the co-located and distributed scenarios?
– RQ 4.2: Do the internal relationships among the sub-factors of performance
and usability differ between the co-located and distributed scenarios?
– RQ 4.3: Do the internal relationships among the sub-factors of collaboration
1.5 Thesis Outline
The thesis contains seven chapters, with this one being the first. Below is a briefing of what is expected in each chapter.
Chapter 2 (Literature Review): Provides an overview of the research literature related to human-computer interaction in multi-user environments as well as a briefing of the multi-touch technology and its potential in the computer supported collaborative work. Distribution effects on group work are also described and used as a building unit of this research. And finally, a high level review of multi-player games relevant issues are introduced with focus on the collaborative games.
Chapter 3 (Method): The methodology adopted for this research is presented, including a discussion of the study design, analysis approaches and techniques, and the data sources used. The analysis procedure is explained to show how the research questions introduced in the beginning of this research are going to be answered. Finally, this chapter shall also present the experimental design which was employed to build the environment and the software application that were used during the experiment sessions with participants.
Chapter 4 (System Design): Presents the design of the software used in this research. First, the game scenario is explained to set the objectives of the application. A high level architecture of the application is presented to show how the major components are put together. The user interface is discussed and the interactions needed with the application are also explained with a briefing of the services implemented to support that.
Chapter 5 (Data, Analysis, and Results): Presents the results produced by analysing the data that has been collected during the experimental work sessions. Results depend heavily on statistical analysis as the main source of supporting evidence of the research hypotheses. For each one of the study areas, a briefing of the findings is presented in the form of descriptive statistics, then the hypotheses related to the area are tested by comparing the relevant data in both scenarios. A correlation analysis is also carried out to find out the effect of the experimental condition on the internal relationships among the sub-factors of the research’s three areas.
1.5 Thesis Outline
Chapter 6 (Discussion): discusses the impact of physical position of participants (col-located
and distributed) on the HCI aspects introduced throughout this research. The
discussion is based on the findings presented in the previous chapter in order to draw conclusions related to the three areas of the research: Performance,
Collaboration, and Usability. The discussion structure shall be built around
the proposed research questions in order to answer them within the context of the research and its background of previous work.
Chapter 7 (Conclusions): Concludes the research and presents the contribution of the research including some potential implications on designing similar software applications in the future. It also measures the success of the research by checking the research questions answers. The limitations of the research are also presented, and finally a set of suggested future work is listed.
2
Literature Review
This chapter reviews previous research that have been done on the topics related to this thesis, mainly the HCI andCSCW. It starts by describing the major research areas in human-computer interaction (HCI). That shall include a brief coverage of the research background in HCI area, how the user interfaces evolved and how it is relevant to this study, and a description of the interaction styles that are followed when users interact with software user interfaces. The importance of system usability and how it is analysed and measured are presented to establish the basis for the main parts of this research. A briefing of the multi-touch tabletops technology and how it is used in the collaborative work scenarios is presented as well. Collaborative work is the main focus of this research, therefore, group work and computer supported collaborative work (CSCW) are described with their role in modern group-oriented frameworks. Because multi-player games were selected as the case to study the group collaborative work, computer games and how they aid in studying user engagement and collaboration are presented in this chapter. The distribution of users is the major input factor that this research is going to analyse its effects; therefore, previous studies of user distribution are also described considering the CSCW and multi-player games.
2.1 Human Computer Interaction (HCI)
Computers started to become more popular and available to most people in the early 1980’s when companies like Apple and Microsoft adopted more user friendly interaction methods with computers1. These methods were basically the implementation of Graphical
1 This is with reference to the start of the widespread of desktop personal computers. Technically, Xerox
PARC’s Alto computer (1973) can be considered as the direct ancestor of desktop computers with a basic GUI and a mouse, but it was not popular enough to consider its effects on the market.
2.1 Human Computer Interaction (HCI)
User Interface (GUI) and the introduction of the mouse as a means of input based on direct visual manipulation of objects on screen (Baecker et al. [9]). Computer designers and researchers are continuously investigating the interaction ways between computers and users. The most important objective of these efforts is to come up with best solutions for users/computers interaction. A new field of research emerged as a result of this, that is, the Human Computer Interaction, or simply HCI.
Research in HCI has been spectacularly successful and has fundamentally changed computing. One example is the graphical interface used by Microsoft Windows, which is loosely based on Apple Macintosh design that used interaction principles formulated at Xerox PARC, which in turn is based on early research at the Stanford Research Laboratory and at Massachusetts Institute of Technology (Myers [96]). Even the remarkable growth of the World Wide Web is a direct result of HCI research: applying hypertext interaction with text to web browsers allows one to traverse a link across the world with a click of a mouse [96].
The mass personal computer markets have meant that sales of computers are more directly tied to the quality of their interfaces than in the past. The result has been the gradual evolution of standardised interface architecture. Along with these changes, researchers and designers have begun to develop specification techniques for user interfaces and testing techniques for the practical production of interfaces (Hewett et al. [58]).
HCI studies both the machine side and the human side. From the technical machinery point of view, it arose as a field from intertwined roots in computer graphics, operating systems, ergonomics, industrial engineering, cognitive engineering, and the systems part of computer science. Computer graphics was born from the use of CRT and pen devices very early in the history of computers. This led to the development of several HCI techniques. Many techniques date from Sutherland’s Sketchpad PhD thesis in 1963 that essentially marked the beginning of computer graphics as a discipline (Sutherland [131]). Work in computer graphics has continued to develop algorithms and hardware that allow the display and manipulation of ever more realistic-looking objects. Computer graphics has a natural interest in HCI as "interactive graphics" (e.g., how to manipulate solid models in a CAD/CAM system). A related set of developments helped to come up with a number of important building blocks for human-computer interaction. Some of these building blocks include the mouse, bit-mapped displays, personal computers, windows, the desktop metaphor, and point-and-click editors. Work on operating systems, meanwhile, developed techniques for interfacing input/output devices, for tuning system response
time to human interaction times, for multiprocessing, and for supporting windowing environments and animation. This strand of development has currently given rise to "user interface management systems" and "user interface tool kits" [58, 9].
From the human perspective, HCI derives from the problems of designing equipment operated by humans. Many problems faced by those working on human factors had strong sensory-motor features (e.g., the design of flight displays and controls). The problem of the human operation of computers was a natural extension of classical human factors concerns, except that the new problems had substantial cognitive, communication, and interaction aspects not previously developed in human factors, forcing a growth of human factors in these directions [35, 144, 78]. Ergonomics is similar to human factors, but it arose from studies of work. As with human factors, the concerns of ergonomics tended to be at the sensory-motor level, but with an additional physiological flavour and an emphasis on stress [9]. Human interaction with computers was also a natural topic for ergonomics, but again, a cognitive extension to the field was necessary resulting in the current "cognitive ergonomics" and "cognitive engineering" (Veer [144]). Because of their roots, ergonomic studies of computers emphasise the relationship to the work setting and the effects of stress factors, such as routines of work, sitting posture, or the vision design of the displays.
Industrial engineering arose out of attempts to raise industrial productivity starting in the early years of the 20th century [58]. The early emphasis in industrial engineering was in the design of efficient manual methods for work (e.g., a two-handed method for the laying of bricks), the design of specialised tools to increase productivity and reduce fatigue (e.g., brick pallets at waist height so bricklayers didn’t have to bend over), and, to a lesser extent, the design of the social environment (e.g., the invention of the suggestion box). Interaction with computers is a natural topic for the scope of industrial engineering in the context of how the use of computers fit into the larger design of work methods (Orlikowski [105]).
Cognitive psychology derives from attempts to study sensation experimentally in the 1950’s, an infusion of ideas from communications engineering, linguistics, and computer engineering led to an experimentally-oriented discipline concerned with human information processing and performance. Cognitive psychologists have concentrated on the learning of systems, the transfer of that learning, the mental representation of systems by humans, and human performance on such systems (Landauer [76]). Basing interaction on pre-existing
2.1 Human Computer Interaction (HCI)
real world knowledge and skills may reduce the mental effort required to operate a system because users already possess the skills needed (Jacob et al. [66]).
HCI research helps in introducing new interface designs and interaction models, however, these research efforts cannot easily break through the market requirements. HCI researchers have developed and evaluated a variety of innovative novel interaction techniques but few have been adopted in the marketplace (Beaudouin-Lafon [16]). Two major barriers restrict wider spread of interaction research. First, although HCI researchers have created a variety of novel interaction techniques and shown their effectiveness in the lab, such experimental designs are insufficient. Software developers need models, methods and tools that allow them to transfer these techniques to commercial applications. Second, WIMP user interfaces (presented in Subsection 2.1.1.1) have been so stable and so universally adopted over the past three decades that the user’s cost of change is very high [16].
2.1.1 Towards GUI tabletop metaphor
Graphical User Interface (GUI) was not isolated from the evolution of the HCI research. Actually, it was a crucial part of it. With the added power and complexity of computer hardware, GUI came into the scene as a natural replacement for the old text-based interaction methods such as command line input, at least for the normal daily users (Eberts [35] and Beaudouin-Lafon [16]). A well designed GUI allows a computer user to smoothly move from application to application, as well as making an application easy, practical, and efficient to use (Jansen [68]). GUI is more intuitive when it comes to the user learning curve [9, 96]. It provides the user with several cues as to what options it provides simply by the way it looks. Most users become proficient with GUI utilities without ever having to read through their help files (Microsoft [84]). A GUI offers graphical icons, and visual indicators, as opposed to text-based interfaces, typed command labels or text navigation to fully represent the information and actions available to a user. The actions are usually performed through direct manipulation of the graphical elements; an important interaction style that will be discussed later in Subsection 2.1.2.1 of this review.
Jansen [68] stated that the goal of any GUI is to allow the user to work through the computer and application to concentrate on the primary cognitive task. The user should not be deeply concerned with the user interface as the attention devoted to the interface
may interfere with the main task. It is crucial that the GUI is consistent and predictable so that the user treats the interface as reality. A computer is a complex abstract system and so it is important to create the illusion that the system was organised enabling the user to use it with relative ease, and without having to remember a series of abstract rules (Shneiderman [128]). The main component used to do this was the creation of visual and functional metaphors, which included features like the trash can and the file folders. This assists what is known as "reactive cognition" where user understands how to use the computer through interacting with the interface. A successful metaphor should be simple and understandable without the user having to memorize or learn a series of commands (Kay [70]). A user interface metaphor is a collection of visuals and actions that utilise specific knowledge that users already have of other domains. The purpose of the interface metaphor is to give the user instantaneous knowledge about how to interact with the user interface (Yousef [156, 157]).
Metaphor is a term that is used in designing user interfaces to denote that a concept familiar to the intended set of users of a particular application is borrowed to represent, or re-frame, a computer operation at the software interface. A visual icon can be used to represent this computer operation; the image depicts a familiar concept. Interface metaphors act as cognitive shortcuts by helping users build on already existing mental models of familiar concepts when learning new systems (Yousef [157]) and (Jacob et al. [66]). The trash can icon is an example of an interface metaphor. The trash represents a computer function similar to the one for which people use an ordinary trash in their offices. A trash can is ideally used to discard unwanted objects. In software context, the trash icon allows the user to get rid of unwanted electronic files [37, 157].
Software designers usually select interface metaphors to simplify the user tasks by building on the user’s existing knowledge from a familiar concept. A metaphor can be regarded as a mapping between the source and the target domains, such as thedesktop metaphor (Green and Jacob [47]) and thetabletop metaphor (Müller-Tomfelde et al. [94]). The source domain is the one used to describe the new system and with which the users of the software are familiar. The target domain is the one that needs to be described and about which users know little (Saffer [117]) and (Erickson [37]). A semantically efficacious interface metaphor is one which users find comprehensible and are able to generate correct inferences about the intended purpose of the metaphor. Further, an efficacious metaphor is one with which users feel comfortable while using any function that is metaphor-supported (Yousef [156, 157]).
2.1 Human Computer Interaction (HCI)
One of the most popular user interface metaphors is the desktop which started to dominate the user interface designs in the 1980s (Green and Jacob [47]). It has been almost universally assumed that a desktop direct manipulation user interface is the best style of user interface for all applications. This point is supported by the facts that almost all user interface design and implementation support only this style of interaction, and that existing user interface style standards only address desktop user interfaces. Thus, the term post-WIMP (see Subsection 2.1.1.2) has been used to refer to any user interface style that is not based on the desktop metaphor (Beaudouin-Lafon [15]). In the desktop metaphor, the computer screen is treated as if it is a physical desktop, on which objects such as documents and folders of documents can be placed.
The obvious metaphor that is more related to the topic of this research is the use of
the tabletop term to describe the horizontal workspace area that a multi-touch screen
provide to its users (Besacier et al. [19]). People are used to work collaboratively around tables utilising the space of the horizontal table surface. Moving to the digital tables is considered a very natural transition given that a proper interface and interaction styles are implemented (Müller-Tomfelde et al. [94, 95]).
In the next two subsections, the two types of interfaces, WIMP and post-WIMP, are described with justification of why interfaces are transitioning to the latter one to overcome the limitations that WIMP interfaces suffer from.
2.1.1.1 WIMP interfaces
The acronym WIMP stands for Windows, Icons, Menus, and Pointing. It denotes a direct manipulation style of interaction using these four elements and usually accompanied with desktop metaphor. WIMP are visualised concepts that bring forth a certain action or an action space (Jansen [68]). WIMP interfaces have been dominant since the late 1980’s to the extent that the terms WIMP and GUI are usually used interchangeably in the HCI literature.
WIMP interfaces revolutionized computing, making computers accessible to a broad audience for a variety of applications (Beaudouin-Lafon [15]). Lisa computer (1983) and the Macintosh (1984) were the first mass-produced WIMP based machines. Moreover, with the rapid rise of Microsoft Windows, WIMP interfaces have become the de facto interface paradigm (Taylor [137]). WIMP interface uses a physical input device to
control the position of a cursor and presents information organized in windows. Available commands are grouped together in menus and can be executed through the pointing device.
In general, WIMP interfaces can be considered as a type of direct manipulation interface (see Subsection 2.1.2.1). However, a WIMP interface may just offer direct access to controls (buttons/menus) but not necessarily manipulate the objects of interest directly; the distinction can be subtle [137, 16]. For example, one may click a button to put an item in a shopping cart rather than dragging the item to the cart. Therefore, WIMP interfaces do not strictly follow the principles of direct manipulation. Instead, they introduce interface elements such as menus, dialogue boxes and scrollbars that act as
mediatorsbetween users and the objects of interest (Beaudouin-Lafon [15]). This matches
the experiences in the physical world; for example, people cook with pots and pans, open doors with handles, and turn off lights with switches. The interaction with the physical world is governed by the usage of tools. Direct manipulation of physical objects of interest occurs when they are brought into the current context of operation, before they are manipulated with the appropriate tools (Guiard [49], Beaudouin-Lafon [15]). WIMP Interfaces have a number of standard elements. Other elements are prevalent, but optional such as graphical displays and metaphors (Taylor [137]). For example, a WIMP can be implemented in a text-based system but graphical displays are often assumed. Metaphors do not have to be used, but often are.
Taylor [137] specified four standard WIMP elements, which are:
Windows: A window is usually a rectangular portion of the screen on a monitor that features some of the content (for example, a text file or an image) seemingly independent of the rest of the screen. That mimics the sheet of paper that presents the information in front of the viewer. Some of the popular features of a window include open, close, move and resize. Several windows can be opened and stacked or tiled which is a very useful feature in a multitasking application.
Icons: The icon is a small graphical representation of an object inside the WIMP interface. These objects can be files, programs, websites, or commands. Icons are a quick way to execute commands, open documents, and run programs. Icons are also very useful in exploring the system searching for different objects as they can be visually categorized according to the type of object they are representing.
2.1 Human Computer Interaction (HCI)
Menus: Menus allow the user to execute commands by selecting from a list of options. These commands are executed by selecting them with a pointing device in a GUI. Sometimes, a keyboard can also be used. The menus are convenient because they clearly show what commands are available in the software. Some of the most common types are the drop-down menus and pop-up menus. Toolbars and checkboxes are also special types of menus. A more sophisticated menu is based on the context menu, where the list of available commands changes depending on the status of the application.
Pointing: Pointing is a term used to denote the use of a pointing device to control a "pointer" on the screen. The pointer is used to manipulate others WIMP elements, for example, selecting a command from a menu. This pointer may have different graphical representations that provide a visual aid for the user. For instance, it is shaped like an index finger when it hovers over a hyperlink and shaped like an hourglass to indicate that a task is being performed. The pointing device that becomes the most dominant one is the mouse which became a crucial part of everyday computer usage. Other devices include light pen, trackball, and touchpad. WIMP style of interaction is intended to reduce the cognitive load to remember the possibilities available, reducing learning times. Other expected benefits of this style are its ease of use for non-technical personnel, both beginners and advanced users (Taylor [137]). Moreover, given the high consistency between applications interfaces, users can transfer their knowledge from one application to another easily because of the standardised WIMP interaction with interfaces (Van Dam [143]). GUI designers usually follow the guidance that the interface should display only what the user needs to perform the task in hand; empirical researchers show that limiting the information to that necessary for the user reduces errors and time to perform tasks (Jansen [68]).
When designing a GUI, designers should keep the objectives of the system in mind and should, generally, avoid needless complexity and useless innovations and concentrate on improvements that enhance performance [68, 15]. However, some types of common actions are not easily done in WIMP, for example, wildcard expressions are not directly supported [137]. Also, a badly designed WIMP interface may result in extreme inefficiency and poor work support. Van Dam [143] listed some of most important limitations of WIMP interfaces and shows how can the next generation of interfaces, known as post-WIMP, help to overcome such limitations; these are described in Subsection 2.1.1.2.
2.1.1.2 Post-WIMP interfaces
A post-WIMP2interface is one containing at least one interaction technique not dependent on classical WIMP elements (described in Subsection 2.1.1.1) such as menus and icons [47, 143, 66]. Ultimately it will involve all senses in parallel, natural language communication and multiple users. A post-WIMP interface assumes no menus, no forms, no toolbars, and heavily relies on gestures and utilisation of senses (Van Dam [143]), and they often draw upon users object manipulation skills (Jacob et al. [66]).
The leap from WIMP to newer post-WIMP graphical interfaces, which take advantage of novel interaction techniques, requires both new interaction models and corresponding tools to facilitate development (Beaudouin-Lafon [15]). An interaction model is a set of principles, rules and properties that guide the design of an interface. It describes how to combine interaction techniques in a meaningful and consistent way and defines the “look and feel” of the interaction from the user’s perspective. Properties of the interaction model can be used to evaluate specific interaction designs [15].
Some researchers, such as Beaudouin-Lafon [16], believe that WIMP interfaces have reached their limits in the face of three major challenges: (1) the exponential growth in the amount of information each individual user deals with; (2) the distribution of this information over multiple computers and devices; and (3) the growing range of computer users, with their wide variety of skills, needs and expectations.
Post-WIMP interfaces emerged as a new style of interaction to overcome the limitations that WIMP interfaces suffer from. These limitations are summarised below as mentioned by Van Dam [143] and Biström [20]:
• Interface becomes harder to learn as applications get more complex because of the widgets3 and features, each of which is individually easy to learn but in the aggregate creates complexity
• Users spend too much time manipulating the interface, not the application • WIMP GUIs, with their 2D representation objects, were designed for, and well suited
to, 2D applications such as word processing, media viewing, and spreadsheets. When
2
Or non-WIMP.
3
Widgets are basic visual building blocks which, combined in an application, hold all the data processed by the application and the available interactions on this data (Baecker et al. [9]).
2.1 Human Computer Interaction (HCI)
the information is more complex than 2D representation, the mapping between the information and 2D objects is much less natural
• Mouse and keyboard are not suited to all users; for example, users with disabilities and injuries may find it difficult to efficiently use the mouse and the keyboard • WIMP interfaces do not take advantage of all human senses other than the visual
sensory. Speech, hearing, andtouch can add a tremendous amount of interaction aids and feedback. It is difficult for us to communicate in the physical world without speech, sound, and touch as well, and that is why WIMP interfaces are considered less natural
Some examples of post-WIMP interfaces include gestural-based systems, haptic devices,
multi-touch tabletops, voice recognition devices, and eye tracking sensors. The RBI
(Reality Based Interaction) concept, introduced in Subsection 2.1.3, can work as a framework to analyse the design of post-WIMP interfaces (Jacob et al. [66]). That can help in assessing and evaluating the user interface designs of new applications that utilise these new paradigms in interaction design.
Green and Jacob [47] suggested the following five characteristics as the most important features of a post-WIMP interface:
1. High bandwidth input and output: contrary to classical WIMP interfaces where
there is, usually, one input event generated at a certain interval of time [20], most of the styles of post-WIMP interaction require high bandwidth for input and output to accommodate the synchronous multi-input sources and multi-output channels
2. Many degrees of freedom: post-WlMP user interfaces have a large number of degrees
of freedom in both the underlying application and the interaction devices
3. Real-time response: all of the post-WIMP interaction styles rely on real-time
response to the user’s actions
4. Continuous response and feedback: a post-WIMP user interface must be continually
responding to the user’s actions, since there isn’t the well defined notion of a
command that occurs in the WIMP user interfaces
5. Probabilistic input: since immediate response is very important, the user interface
may need to guess what the user is trying to achieve in order to produce timely feedback. Occasionally these guesses will be wrong, and the user interface will need to correct its mistakes
The previous list of characteristics suggests that post-WIMP user interfaces could be called highly interactive user interfaces. It is essential that the user’s set of interaction techniques with a post-WIMP interface should not be restricted, no matter what state the application is in, and that is why post-WIMP applications need to be truly interactive by considering those characteristics [47].
Post-WIMP interaction techniques help users to explore large quantities of visual data and make sense of it by simplifying the navigation among the different parts of the interface (Beheshti et al. [17]), and providing easy and direct ways to enter data and display outputs (Beaudouin-Lafon [15]). A key aspect here is the strong coupling between user actions and system response. Both navigation and input/output are usually multi-dimensional tasks: the user wants to control several dimensions simultaneously to navigate along different parts of the interface. This requires highly flexible navigation and input methods [15]. For example, a movable, rotatable, and resizeable user area that can be used by the user anywhere on the table surface and from any side of the table as well. The last example suggested an interaction feature that is very similar to the user’s panel used in the application built for this research (see Chapter 4).
Multi-touch tabletops represent a very good example of post-WlMP interfaces. Two-handed input studies shows that using a pair of touch-sensitive areas to interact with the interface can result in improved performance (Hinckly et al. [61, 23] and Kin et al. [73]). When working on a tabletop, there are many fundamental differences in the user input paradigm that challenge conventional WIMP assumptions. These differences are summarised by Shen [123] in the following points:
• The input area of any given user/point is larger, and a different shape, than the single pixel defined by a mouse pointer
• Windows/widgets may be rendered off-axis (i.e. rotated)
• A single user may be touching multiple UI-controls/screen points simultaneously • Multiple users may be touching the same UI-controls/screen points simultaneously • Multiple users may be touching different UI-controls/screen points simultaneously • Multiple users may be entering text from different keyboards (soft or hardware)
simultaneously
With these differences, the limitations of WIMP interfaces become more obvious which justifies the need for more innovative interaction styles that are found within the post-WIMP interfaces. Multi-touch tabletops inherently support multiple touches,
2.1 Human Computer Interaction (HCI)
multiple users, and rotating the digital artefacts on their interfaces [123, 152, 43]. Moreover, they support interaction by hand gestures, which is an intuitive and natural way of interaction that helps users to easily manage their artefacts without the need for additional external devices such as mice and styli (Kruger et al. [75] and Wigdor et al. [151]). There are even more promising studies that integrate multi-touch tables with sophisticated environments, such as controlling the tabletops in a classroom using body movements captured by Microsoft Kinect (Durham University [3]), and integrating direct manipulation interaction4 with 3D environment (Möllers et al. [86]).
Multi-touch tabletops have their own set of problems, though. For example, it is difficult to identify the user who touches the tabletop surface at any given time when multiple users are using the same table concurrently. One approach to overcome this problem is by assigning well defined areas on the interface for each user (Scott et al. [119] and Tuddenham et al. [140]), which is the approach used in this research’s application. Another common problem in most of the touch devices is the text entry. Virtual keyboards are the dominant method for text entry in touch screens, however, they suffer from inefficiency and inaccuracy (Edelmann et al. [36]), and can cause many troubles when multiple users try to use them at the same time (Isenberg et al. [64] and Basheri et al. [14]). Connecting physical keyboards to the tables (Tuddenham et al. [141]), or mixing physical and virtual keyboards (Kharrufa et al. [72]) could be possible solutions for such a problem.
2.1.2 Interaction styles
Interaction with computers has evolved from the first generation of command line, to the second generation of direct manipulation, to a new generation of emerging post-WIMP interaction styles (Jacob et al. [66]). The concept of interaction styles refers to all the ways the user can communicate or otherwise interact with the computer system. Shneiderman [128] defined the types of usual interaction styles as command language, form filling, menu selection, natural language, and direct manipulation. Interacting with the user interface using a touch screen (and hence the multi-touch tabletops) can be considered as a form of direct manipulation interaction (Shneiderman [127]). Actually, it is even more “direct” than other interaction techniques, such as mice and touch pads, because the user manipulates the desired user interface object directly by “physically”
touching it on screen by hand or stylus [127]. Direct manipulation interaction style is explained in more detail in Subsection 2.1.2.1.
Nacenta et al. [99] showed how the way that users interact with tabletop groupware systems can affect how they collaborate with each other. Their findings show significant differences across techniques in terms of conflicts, reaching patterns, object transfer, group performance, and user preference. The main result of this work is that no one interaction technique is best for all tasks and all tabletop situations. For example, direct-touch techniques such as drag-and-drop reduce resource conflicts, but at the price of being much less effective when used for reaching distant artefacts. Another example shows that miniature views such as the radar view were surprisingly effective for a game task, although in a design task the radar did not provide enough awareness information to be successful (Ha et al. [53]).
Three dimensions were specified to classify user interaction methods with tabletop surfaces as described by Nacenta et al. [99]:
1. Location of input: different interactions allow users to provide input from two possible locations: the local space or the shared space. The local space is the area near the user, and shared space is the area between users that is visible to all of them which may not be always easily accessible. Local and shared spaces may overlap depending on the position of different users. The relatively large surface area of the tabletop allows direct input into the workspace. Direct input can force group to share input space in order to manipulate objects on the table [99, 97]. 2. Location of feedback: visual information (feedback) provided by an interaction
allows users to adjust and correct their actions. This interaction feedback can be displayed through the shared space, local space, or both. Local feedback is used by miniature view techniques such as radar views, which allow users to interact with all surface objects. Miniature view techniques facilitate both the direct input and access to the entire work area; however, this view may not provide sufficient resolution to perform some tasks. Tabletops have the advantage that users can share representations of objects (Nacenta et al. [98]). An important note is that users do not need to use tabletops if they only want to provide private representations of workspace as multiple miniature views in personal displays would suffice. Consequently, tabletop miniature views should be used in combination with shared visual representation, which provides feedback both locally and shared [99].
2.1 Human Computer Interaction (HCI)
3. Embodiment: embodiment is a real or virtual representation of the user’s body in the system, and is a valuable mechanism for the representation of presence, location, and activity information. Embodiments can vary widely in form and size according to different forms of interaction. The two main aspects that make embodiments different are how literal the representation is, and how large. In shared input space, embodiment can be full-size with literal representations because of the use of physical bodies and arms (Ha et al. [53]). These techniques have intrinsic advantages of awareness as the system does not have to represent the users points of action, and the identities of different users are easy to determine. However, other techniques require virtual representation of embodiment, i.e. digital representations that are drawn in the workspace such as cursors. Although cursors can convey awareness, they are much smaller than physical arms, and the user-cursor relationship is not always clear. Colour is usually used to differentiate the groupware users cursors, and even richer representations such as photographs are also possible. Some representations go beyond that by drawing a line between the cursor and the user virtual place, providing a visual link between each cursor and its owner [99]. This linking technique is used in the application built for this research as described in Chapter 4.
In addition to the dimensions described above, interaction with user interface can be classified into interaction paradigms. Beaudouin-Lafon [16] suggested three primary interaction paradigms to be considered:
1. Computer as tool 2. Computer as partner 3. Computer as medium
The computer as tool paradigm extends human capabilities through a (very sophisticated) tool. Direct manipulation and WIMP interfaces fall into this category. The computer as partner paradigm embodies anthropomorphic means of communication in the computer, such as natural language, so that users can delegate tasks. Agent based interaction and speech based interfaces fall into this category. The computer as medium paradigm uses the computer as a medium by which humans communicate with each other. Email, chat and video-conferencing fall into this category. Human-Computer Interaction focuses on computer as tool, Artificial Intelligence focuses on computer as partner, and Computer Supported Cooperative Work focuses on computer as medium. Note that these paradigms rely on two sets of skills: the ability to create and use artefacts (computer as tool and
computer as medium), and the ability to communicate with each other through language (computer as partner and computer as medium). The unique challenge here is to create new tools that both augment and complement human capabilities (Beaudouin-Lafon [16]).
To enable software designers to use interaction techniques in their user interfaces, interaction styles are put into models (Carroll [25]). The purpose of an interaction model is to provide a framework for guiding designers, developers and even users to create interactive systems (Beaudouin-Lafon [16]). Interaction models can be evaluated along three dimensions:
1. Descriptive power: the ability to describe a significant range of existing interfaces 2. Evaluative power: the ability to help assess mult