2017 2nd International Conference on Artificial Intelligence and Engineering Applications (AIEA 2017)
ISBN: 978-1-60595-485-1
Short-term Wind Power Forecasting Algorithm
Based on Similar Time Period Clustering
WEN PENG, ZHIYUAN ZHANG and JINRUI WANG
ABSTRACT
Wind power has strong randomness and volatility, In view of this, a short-term wind power forecasting algorithm based on similar time clustering is proposed. As the rotation of the blade has inertia, giving the definition of similar period by analyzing historical data and the optimal length of similar period by experiment. On this basis, we use K-means algorithm to cluster similar time. In the prediction process, the similarity period is divided by calculating the distance between it and the center of each cluster, then the optimal similar time series is selected. Taking the set as the training sample, the Elman neural network model is established by using the power curve and the meteorological information. This model is employed to iteratively predict wind power in future periods. The actual cases show that our method is an effective expansion of idea based on forecast of similar day, which can effectively mining the valuable information contained in historical data and improve the short-term wind power forecast performance.
KEYWORDS
Wind power prediction, similar time period, Elman neural network, cluster; meteorological information.
INTRODUCTION
With the reduction of world energy, the research and utilization of renewable energy become top priority. Wind energy with renewable and non-polluting advantages, gradually becoming the most promising energy. But the natural wind is random and intermittent, large-scale centralized access of wind power will take threat to the safe and stable operation of the power grid, wind power forecast is an effective way to solve this problem [1, 2].
_________________________________________
Wen Peng, School of North China Electric Power University, Beijing, 102206, China; [email protected]
Zhiyuan Zhang, School of North China Electric Power University, Beijing, 102206, China; [email protected]
The prediction method based on similar date has achieved good results, but only the similarity analysis is made for the meteorological factors of the forecast day, and the effect of the power change trend on the wind power prediction is not taken into account. Ding Zhiyong Considering the similarity and continuity of wind speed, a SVM wind power forecasting method based on continuous period clustering is proposed [3]. But the length of the continuous period is set to half a month, too long to reflect the changes between historical and forecast data. According to the concept of "trend similarity", we select the similarity date. Although we consider the change of power curve, we do not analyze the relationship between forward change and backward trend. The selection of the trend k did not give a reasonable analysis [4]. Zhang Yiyang [5] divided similar day into "similar period". Firstly, looking for the similar wind power curve 12 hours before prediction time as a " reference period", and then find the similar wind power curve 12 hours after prediction time as " forecast section", to achieve the prediction in different level. However, when the model is established, only the correspondence between the similar daily powers is taken into account, and the influence of the reference power curve and the meteorological eigenvalue is not taken into account.
In view of this problem, this paper combines the power curve and meteorological information, and gives the definition of similar period based on similar day. The similarity time scale is designed to find similar samples by cluster method in the historical data, then constructing the Elman neural network model and finishing forecasting process iteratively.
THE DEFINITION OF SIMILAR TIME PERIOD
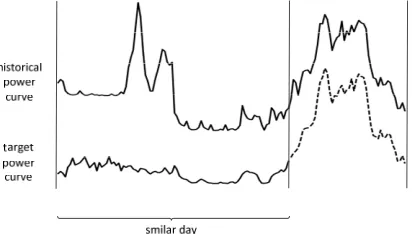
Be different from the photovoltaic and electricity load, the direct application of the traditional method based on similar day in wind power prediction, has low ideal effect. As shown in Fig. 1, if the data is analyzed in units of days, the upper power curve is ignored for a low degree of similarity to the target power curve, resulting in loss of information. But the appropriate shortening of the time period, you can tap the historical data contains valid information.
[image:2.612.190.396.573.690.2]By analyzing the history data of wind power, it can be seen that the power output at the current time depends not only on the meteorological data but also the data over a period of time. This is because the wind power generation is driven by the rotation of the rotor, and the rotation of the blade has certain inertia, will not stop immediately with the wind disappear.
Reference vector
…
Power vector
…
… …
Meteorological feature vector
After L hours Before L
[image:3.612.165.432.55.188.2]hours t
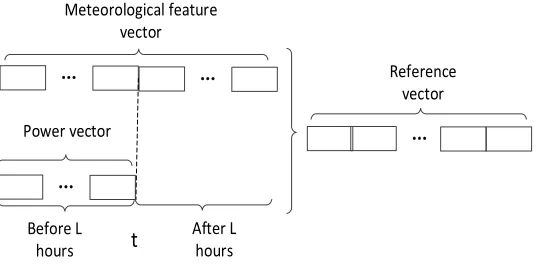
Figure 2. Schematic diagram of the reference vector.
The traditional prediction method is to find the sample set which is similar to the data in the forecast period, and then complete the forecasting process through different models. In this paper, the continuity of wind power output is considered, and the data of the forecasting period and before the forecasting time are more accurate when searching the historical sample data. L-hours meteorological feature vector before forecasting time. L-hours meteorological feature vector after forecasting time. L-hours power vector after forecasting time as reference vector, as shown in Fig. 2. In order to better describe data used in this paper, we define it as similar time periods.
Where t is the current time, L is the length of time, and the included data has three parts: meteorological forecast data Wf between time t and time t+L, meteorological forecast data Wb between time t and time t-L, and power data Pb between time t and time t-L. Thus, the length of the similar period is 2L.
THE LENGTH OF SIMILAR TIME PERIOD
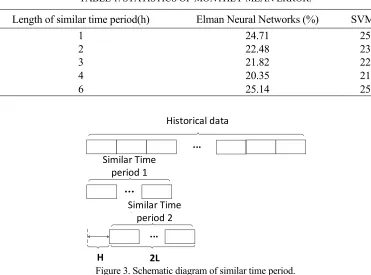
In this paper, a wind farm in Guizhou is used as the research object, Elman neural network and support vector machine are used as the prediction model respectively, and the power value (resolution 15min) is predicted for the next 24 hours. The similarity periods are set to 1, 2, 3, 4 and 6 hours respectively. Select the data from September 2015 to September 2016 as the training set, October to December as the test set, Table 1 is the prediction error of the two models of statistical results, the daily error is calculated as follows:
1 ˆ 1 Np
i i
MAPE
i
p cap
p p
N p
e
(1)Which pi is the actual power, ˆpi is forecast power,pcap is wind machine boot
capacity,Np and is the number of daily forecast data, the average error of the
forecast model as follows:
1
1 Mp
j MAPE j P
p
MA E e
M e
TABLE 1. STATISTICS OF MONTHLY MEAN ERROR.
Length of similar time period(h) Elman Neural Networks (%) SVM (%)
1 24.71 25.48
2 22.48 23.25
3 21.82 22.21
4 20.35 21.62
6 25.14 25.97
Historical data
Similar Time period 1
Similar Time period 2
H 2L
…
...
...
Figure 3. Schematic diagram of similar time period.
Which Mp is the number of predicted day. j MAPE
e Is the error of day j.
Table 1 shows that the prediction results of the two models are the best when the length of the similar period is 4h. The Elman neural network is lower than SVM, which indicates that the Elman neural network has better adaptability to the wind power value with strong volatility.
OPTIMAL SIMILARITY PERIOD SAMPLE SET SEARCH STRATEGY
The core of this method is to find the similarity period sample set which is closest to the target in the historical data, and then to establish the forecasting model. Based on the analysis of similar time data, combined with power curve and meteorological factors, a search method based on clustering - classification strategy is proposed.
The choice of meteorological feature vector
Due to the influence of terrain and climate, wind power is not only affected by wind speed, wind turbine capture power can be expressed as follows [9]:
3 1/ 2 p air wind
P C SV (3)
Which P represents output, Cp represents the wind turbine power factor, air
represents the air density, S represents the area of the fan blade sweep, Vwind and
represents the wind speed. From the formula (3), in addition to the wind speed, the wind machine output is also affected by wind direction, temperature, pressure and other factors, which the direction of wind determines the size of the wind swept. Temperature, humidity and pressure will change the air density. Therefore, the meteorological feature vector is:
i Vi i Pi Hi Ti
W , , , ,
Which Vi on behalf of the time of the wind speed, i is the wind angle, i on
behalf of the pressure, Hi on behalf of humidity, Ti on behalf of the temperature.
Similar times clustering
In order to improve the search efficiency of similar period, this paper uses K-means method to classify clusters of historical similar periods. In the clustering process, it is necessary to determine the distance between two similar periods, and a similar period is composed of two data sequences: the meteorological feature vector of 2L and the power vector of L. The meteorological feature vector is further developed, which can be expressed as the characteristic curve of five different factors in equation (4), plus the power curve, the distance of similar period can be converted into the weighted distance of 6 curves.
A common method of measuring the degree of similarity of a curve is to calculate the correlation coefficient or spatial distance between two vectors [6], but this approach lacks the description of local differences. In other words, the two groups of different vectors will have the same results. As shown in Fig. 1, the curve of the similar daily part is obviously different in the local trend, but the correlation coefficient of the two curves is calculated as 0.86, and the correlation is very large. In order to avoid such cases, consider the variance of the difference between the two curves.
When the K-means method [7] is used to cluster the similar sets of historical periods, the distance between two similar periods in the set is defined as:
5
1
( ), ( ) ( ), ( )
1 ( ), ( )
i j p i p j
k k
k i j
k
D S t S t d S t S t
d S t S t
(4)Which S tp( )i represents each power curve, ( )
k i
S t representing each
distance from the meteorological curve of the weight, k represents each
meteorological curve distance measurement results of the weight value, meet
5 1 =1 k k
, and use of gray correlation analysis method [8], The weight values are shown in Table 2:( )
d Represents the distance between the curves represented by the two sets of
data sequences, and the two curves i
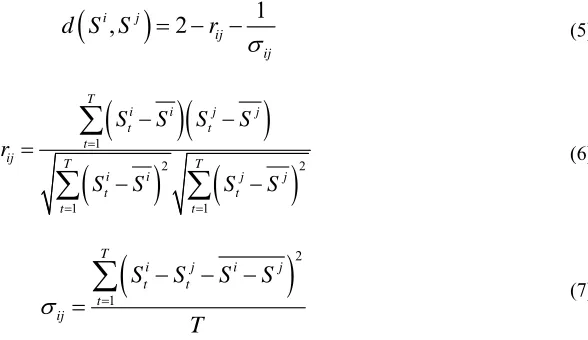
S and Sj are calculated as:
1, 2
i j
ij ij
d S S r
(5)
1
2
21 1
T
i i j j
t t
t
ij T T
i i j j
t t
t t
S S S S r
S S S S
(6)
21
T
i j i j
t t t
ij
S S S S
T
(7)Which rij is Pearson coefficients of Si and Sj, Si and Sjis the mean of Si and j
S , Sti and j t
S is the component of i
S and Sj, T is the length of the curve, ij is
the mean square of the difference between i
S and Sj.
When clustering, the number KM of cluster clusters has an important effect on
the clustering results. At present, most of the values are artificial. In order to select the values more objectively, this paper tests the values within a reasonable range, and selects the optimal clustering parameters by the classification effect.
Optimal similarity period selection
In the case of power prediction, it is necessary to construct a reference similarity period (which indicates the current time of the forecast) and determine the cluster of the class. Then, select a number of the closest elements in the cluster as the optimal similar time series. The concrete steps are:
(1) to construct S t L( , )0 as a similar time period of classification;
(2) Apply the formula (4) to calculate the distance S t L( , )0 from the cluster
[image:6.612.203.497.182.352.2]centroids of all clusters, and select the smallest cluster as the classification result.
TABLE 2. THE CORRELATION COEFFICIENT BETWEEN POWER AND EACH METEOROLOGICAL FACTOR.
(3) Calculate the distance S t L( , )0 from all the elements in the cluster, then
select the Nf elements with the smallest value after sorting, and get the optimal
similar time seriesCf .
WIND POWER PREDICTION MODEL BASED ON ELMAN NEURAL NETWORK
Elman Neural Networks
Elman neural network is a typical dynamic neural network, composed of input layer, hidden layer, receiver layer and output layer. The receiver layer is fed back by memorizing the output value of the hidden layer at the previous time, increasing the ability of the network to process dynamic information [10], and has good adaptability for handling wind power data.
Wind power prediction model
In this paper, the wind power prediction model is proposed. The input vector of the prediction model consists of two parts, the weather forecast information vector, including wind speed, wind direction, air pressure, humidity and temperature, before and after the forecast time of L hours and power vector before the forecast time of L hours. The output of the model is the power value of L hours after the predicted time.
In the short-term wind power forecast, the iterative way to predict the future L-hours power value. In the process of each iteration, we first find the best set of similar timeSf, and then use it as the training set to complete the establishment of
the prediction model. The Elman neural network is used to obtain the power value
of L hours after the prediction time, and the iteration is
L
24
times that can get one
day power value.
EXPERIMENTAL RESULTS ANALYSIS
The experimental data from September 2015 to December 2016 in Guizhou Province, a wind farm operating data, and weather forecast data from the NWP.
The Influence of the Number of Clusters on the Selection of Similar Periods
The classification criteria are defined as the average distance between the target sample X and all the samples Cluster in the cluster which it belongs. The formula
is:
1
1
( , )
N
j j
D d X X
N
(8)Which ( )d is the distance formula (4), j
X is the elements ofCluster, N and is
the total number of samples.
When the value is small, each other with low similarity is classified as the same cluster, resulting in the classification is not ideal. As the value increases, the results gradually improve, but increase to a certain value, too many clusters will interfere with the classification of the target sample, so that it cannot be accurately classified as belonging to the cluster. So, we define 12 as the number of kinds.
Analysis of the Influence of Meteorological Factors
Analysis of historical data shows that the same meteorological conditions, there are differences in the power curve. Different meteorological conditions may also get similar power curve. Therefore, this paper designs the similarity measure standard fusing power curve trend and meteorological factors (see equation (4)), in which is the weight coefficient. Still from October to December 2016 as the test phase, respectively, for the set of different values, repeat the process of similar period selection.
Considering only the effect of power curve is better than considering only meteorological factors, but neither is ideal. The main reason is that the power curve has a higher reference value than the meteorological factors when the similarity period is selected. We can get that the probability of the meteorological factors are similar when the power curves are similar more than the probability of the power curves are similar when the meteorological factors are similar. Therefore, when the power curve weight is large, the classification effect better. =0.7Is the best result in experiment?
Analysis of the influence of network model on forecasting results
TABLE 3. THE PREDICTION RESULTS OF DIFFERENT MODELS.
Forecasting model Average error (%) Worst error (%) Best error (%)
Elman-P 10.02 12.01 6.53
Elman-W 12.79 15.37 8.73
[image:9.612.90.506.71.125.2]Elman-PW 8.21 15.31 5.63
[image:9.612.91.506.320.408.2]Figure 4. Power forecast results.
TABLE 4. WIND POWER PREDICTION EFFECT OF DIFFERENT MODELS.
Prediction algorithm
Average error (%)
Dominant days (45) Average error (%)
Equal days (34) Average error
(%)
Behind days (13) Average error (%) Algorithm of
this paper 8.51 8.01 8.52 9.35 Algorithm of
literature[5] 9.15 10.32 8.53 9.17
Contrastive Analysis of Similarity Forecasting Algorithm
Different from the forecasting method based on similarity date, the research of this algorithm has a more flexible time scale for similar periods. In order to illustrate the effectiveness of the proposed algorithm, the prediction work is done independently by using the algorithm and the algorithm [5] for the same data set. The results are shown in Table 4.
This algorithm can excavate more regular information contained in historical data, and the accuracy is better than the forecasting method based on similar day.
SUMMARY
In view of the fact that wind power generation does not have obvious daily cycle, we can draw on the forecasting based on similarity date. In this paper, a short - term wind power forecasting model based on similar time clustering is proposed and validated by practical examples. The conclusion as following:
1) Similar time period can be used to dig out more valuable information from historical data than similar days.
3) Based on the clustering-classification of similar time selection strategy can quickly find the optimal set, with the accumulation of data can be considered to join the clustering process adaptive adjustment mechanism to more accurately filter the similar period.
4) The experimental data show that the predictive performance of the model is superior to the forecasting method based on similar day.
FOUNDATIONS
Project supported by the National Key Technology Research and Development Program of the Ministry of Science and Technology of China (2013BAA02B02) and Fundamental Research Funds for the Central Universities (2017MS034)
REFERENCES
1. Chi Yongning, Liu Yanhua, Wang Weisheng, et al. Study on Impact of Wind Power Integratio9n on Power System[J]. Power System Technology, 2007, 31(3): 77-81.
2. Hou Zherui, Zhang Xin, Zhang Song. Review on Development Status and Key Technologies of Wind Power[J].Smart Grid, 2014, 02: 22-27.
3. Ding Zhiyong, Yan Ping, Yang Xi, et al. Wind Power Prediction Method Based on Sequential Time Clustering Support Vector Machine [J]. Automation of Power Systems, 2012, (14):131-135+149. 4. Zheng Tingting, Wang Haixia, Lv Quan, et al. Short-Term Wind Power Forecasting Based on
Trend-Similar Days and Chaotic Time Series [J]. Power System and Clean Energy
5. Zhang Yiyang, Yan Huan. Multi-Step Wind Power Forecasting Based on Subsection and Layer Searching for Similar Day and Adaptive Ridgelet Neural Network [J]. Power System and Clean Energy, 2015, 04: 124-131.
6. Li Qi, Chen Zhong, Wang Yunbin, et al. Based on the ART2wNF Neural Network and K-means Algorithm of Photovoltaic Power Generation Power Curve Clustering [J]. Journal of Electric Power, 2014, (02): 119-123+155.
7. Hua Huiyou, Chen Qimai, Liu Hai, Zhang Yang, et al. Hybrid Kmeans with KNN for Network Intrusion Detection Algorithm [J]. Computer Science, 2016, 43(3): 158-162.
8. Zhang Xiaolian, Hao Sipeng, Li Jun, et al. Grey Correlation Based Analysis on Impacting Factors of Maximum Power Point Tracking Control of Wind Power Generating Unit [J]. Power System Technology, 2015, 39(2): 445-449.
9. Liu Xuan, Jia Yan, Ren Zhe, et al. Influence factors and quantitative indicators of small and medium-sized wind turbine [J]. Renewable Energy Resources.