SIMULTANEOUS ESTIMATION OF CEFUROXIME AXETIL AND
LINEZOLID IN PHARMACEUTICAL DOSAGE
FORM BY RP-HPLC AND HPTLC METHOD
Dissertation work submitted to The Tamilnadu Dr. M.G.R Medical University, Chennai in partial fulfilment for the award of degreeof
MASTER OF PHARMACY IN
Pharmaceutical Analysis
Submitted by PRASANTH A R
Reg. No: 261530656
Under the guidance of
Institutional Guide: Industrial Guide:
This is to certify that the dissertation work entitled “Method Development and validation for the simultaneous estimation of Cefuroxime axetil and Linezolid in pharmaceutical dosage form by RP-HPLC and HPTLC” is a bonafide work of Mr.PRASANTH A R carried out in Care keralam,koratty,Thrisur,kerala under my guidance and supervision of Dr.Tenson antony,Quality manager,for the partial fulfillment of the award of degree of Master of Pharmacy in Pharmaceutical Analysis, RVS college of Pharmaceutical Sciences, Sulur, Coimbatore, affiliated to The Tamilnadu Dr. M.G.R Medical University, Chennai.
Dr.W.D.SAM SOLOMON,M.Pharm,PhD
This is to certify that the dissertation work entitled “Method Development and validation for the simultaneous estimation of Cefuroxime axetil and Linezolid in pharmaceutical dosage form by RP-HPLC and HPTLC” is a bonafide work of Mr.PRASANTH A R carried out in Care keralam,koratty,Thrisur,kerala under the supervision of Dr.Tenson antony,Quality manager, and the guidance of Dr.W.D.Sam Solomon in the department of Pharmaceutical Analysis, for the partial fulfillment of the award of degree of Master of Pharmacy in Pharmaceutical Analysis, RVS college of Pharmaceutical Sciences, Sulur, Coimbatore, affiliated to The Tamilnadu Dr. M.G.R Medical University, Chennai.
Dr.R. VENKATANARAYANAN,M.Pharm,Ph.D
Date:
This is to certify that the dissertation entitled “Method Development and validation for the simultaneous estimation of Cefuroxime axetil and Linezolid in pharmaceutical dosage form by RP-HPLC and HPTLC” is a bonafide work done by Mr.PRASANTH A R ,RVS College of Pharmaceutical Sciences, Sulur,Coimbatore, for the partial fulfillment of the University rules and regulations for the award of Master of Pharmacy in Pharmaceutical Analysis under my guidance and supervision during the academic year 2016-17
Dr.W.D.SAM SOLOMON,M.Pharm,PhD
Dissertation title : “Method Development and validation for the simultaneous estimation of Cefuroxime axetil and Linezolid in pharmaceutical dosage form by RP-HPLC and HPTLC”
Name of the Candidate : Mr.PRASANTH A R
Course of study : Master of Pharmacy in Pharmaceutical Analysis
Institution Name : RVS college of Pharmaceutical Sciences, Sulur, Coimbatore
INTERNAL EXAMINER EXTERNAL EXAMINER
Date: Date:
The secret of success is undaunted ardour, motivation, dedication, confidence on self and above all the blessings of God. I bow in reverence to the Almighty for bestowing upon me all this kindness that has helped me throughout the journey of my life. Success is an outcome of collaborated efforts aimed at achieving different goals. I hereby take this opportunity to acknowledge all those who have helped me in the completion of this dissertation work.
work.
First and foremost I thank to my God for my successful completion of this
I sincerely acknowledge my deep sense of gratitude and hearty thanks to Dr. W.D. Sam Solomon, M.Pharm., PhD., Professor and HOD, Department of Pharmaceutical Analysis, RVS College of Pharmaceutical Sciences, Sulur, Coimbatore, for his valuable guidance encouragement and continued support throughout the course of this work.
I express my sincere thanks to Dr. Tenson Antony Quality manager,Care Keralam for providing the facilities to carry out my project work in this esteemed organization.
I am highly indebted to Dr. R. Venkatanarayanan, M.Pharm.,Ph.D., Principal, RVS College of Pharmaceutical Sciences, Sulur, Coimbatore, for providing necessary laboratory facilities, encouragement and continued support throughout the course of this work.
professor, Department of Pharmaceutical Analysis for their valuable advices,help and support during my academic and project work.
I express my sincere thanks to Mr. Gopalakrishnan.G General manager, Care Keralam for providing the facilities to carry out my project work in this esteemed organization.
I express my thanks to my friends for their help and moral support in the successful completion of this project work.
I convey my sincere thanks to all the staff members of RVS college of pharmaceutical Analysis who have contributed to my thesis work.
Words have no power to pay regards to my most beloved parents,who sacrificed a lot for my welfare and brought me up to this esteemed stage.I expressed my love and gratitude to my father and other family members for their endless love and sincere prayers through the duration of my studies
Sl.NO TOPIC PAGE NO
LIST OF TABLES LIST OF FIGURES
LIST OF ABBREVIATIONS 1. INTRODUCTION
1.1 Analytical chemistry 1
1.2 Importance of drug analysis 1
1.3 Relevance of analytical methods 2
1.4 Analytical methods 2
1.5 High performance liquid chromatography 3 1.6 High performance thin layer chromatography 10 1.7 Analytical method Development and validation 15 2. REVIEW OF LITERATURE
2.1 Literature Review 22
2.2 Drug Profile 30
3. AIM AND PLAN OF WORK
3.1 Aim and Objective 32
3.2 Plan of Work 32
4. MATERIALS & METHODS
4.1 MATERIALS AND METHOD FOR HPLC 33
1. INTRODUCTION
1.1. ANALYTICAL CHEMISTRY1-4
Analytical Chemistry is defined as “The science and the art of determining
the composition of materials in terms of the elements or compounds contained.”
This branch of chemistry, which deals with both theoretical, practical science and
practiced in a large number of laboratories in many diverse ways. Methods of
analysis are routinely developed, improved, validated, collaboratively studied and
applied. In analytical chemistry it is of prime importance to gain information about
the qualitative and quantitative composition of substances and chemical species
that is to find out what substance is composed and exactly how much. In
quantitative analysis the question is how much is present. The research work in
this thesis is based on this criterion. Pharmaceutical analysis deals not only with
medicaments (drugs and their formulations) but also with their precursors i.e. with
the raw material on which degree of purity and quality of medicament depends.
The quality of the drug is determined after establishing its authenticity by testing
its purity and the quality of pure substance in the drug and its formulations.
Quality is important in every product or service but it is vital in medicine as it
involves life. Unlike ordinary consumer goods there can be no “second quality” in
drugs. Quality control is a concept, which strives to produce a perfect product by
series of measures designed to prevent and eliminate errors at different stages of
production.
1.2. IMPORTANCE OF DRUG ANALYSIS
Medicines are key part of the health care system. Numerous medicines
are introduced into the world-market and also, that is increasing every year.These
medicines are being either new entities or partial structural modification of the
existing one. So, evaluation of quality and efficacy of these medicines are
important Right from the beginning of discovery of any medicine, quality and
efficacy of the same are checked by quantification means. Quality and efficacy
are checked by either observing effect of drug on various animal models or by
analytical means the option of animal models is not practically suitable for every
batch of medicine as it requires long time, high cost and more man-power. Later
1.3. Relevance of Analytical Methods5-7
1.4. Analytical methods
The analytical way deals with quality standards which are assigned for
products to have desirable efficacy of the medicines. Sample representing any
batch are analyzed for these standards and it is assumed that drug/medicine
complying with those standards are having desired effect on use. Quality control
is a concept, which strives to produce a perfect product by series of measures
designed to prevent and eliminate errors at different stage of production. The
decision to release or reject a product is based on one or more type of control
action. Due to rapid growth of pharmaceutical industry during last several years,
number of pharmaceutical formulations enter as a part of health care system and
thus, there has been rapid progress in the field of pharmaceutical analysis.
Developing analytical method for newly introduced pharmaceutical formulation is
a matter of most importance because drug or drug combination may not be
official in any pharmacopoeias and thus, no analytical method for quantification is
available. To check the quality standards of the medicine various analytical
methods are used. Modern analytical techniques are playing key role in
assessing chemical quality standards of medicine. Thus analytical techniques are
required for fixing standards of medicines and its regular checking. Out of all
analytical techniques, the technique which is widely used to check the quality of
drug is known as "chromatography‚.
Analytical methods which are a measure of quality of the drugs
play a very comprehensive role in drug development and follow up activities. It
assures that a drug product meets the established standard, is stable and will
continue to meet purported quality throughout its shelf life.These methods should
be selective and sensitive to monitor the known and unknown impurities and
have to be written in a format such that they can be reproduced over a period of
In analytical chemistry, it is of prime importance to gain information about
the qualitative and quantitative compositions of substances and chemical
species, that is, to find out what a substance is composed of and exactly how
much. In general terms, pharmaceutical analysis comprises of those procedures
necessary to determine the “identity, strength, quality and purity” of drugs.
1.5. High Performance Liquid Chromatography
packed in glass columns in 1903. High pressure liquid Pharmaceutical analysis is considered to determine the identity, strength, quality
and purity of drug samples.
Analytical methods are required to characterize the drug substances and
drug product composition during all phases of pharmaceutical development.
Early phase methods must support changes in synthetic routes and dosage form
and elucidate the structures and levels of impurities. In later phases, goals
change to the development of rapid and robust methods for release and stability
evaluation.
Analysis includes a wide range of simple and instrumental analytical
methods, but the most widely used methods for quality assurance are
spectroscopy and chromatography. Most quantitative analysis requires
measuring specified components in the presence of sample matrix and/or related
substances; therefore isolation or separation of the components are required
preceding such analysis. In such cases chromatographic techniques are used for
quantitative analysis. In case, where matrix interference is not observed
quantitative measurements are made using spectroscopic or titration methods.
Method validation is an integral part of method development. It is the
process of demonstrating that analytical procedures are suitable for their
intended use and that they support the identity, quality, purity, and potency of the
drug substances and drug products. Simply, method validation is the process
of proving that an analytical method is acceptable for its intended purpose.
The term chromatography meaning “color writing,” was first discovered by
Mikhail Tswett, a Russian botanist who separated plant pigments on chalk
Four major separation modes of HPLC are normal phase, reversed phase,
ion exchange chromatography, and size exclusion chromatography (gel
permeation and gel filtration chromatography.
Normal-Phase Chromatography (NPC)8-9
Reversed-Phase Chromatography (RPC)
chromatography was developed in the mid-1970’s andquickly improved with the
development of column packing materials and the additional convenience of
online detectors. In the late 1970’s, new methods including reverse phase liquid
chromatography allowed for improved separation between very similar
compounds. By the 1980’s HPLC was commonly used for the separation of
chemical compounds. Computers and automation added to the convenience of
HPLC.
Liquid chromatography (LC) is a physical separation technique conducted
in the liquid phase. Analyte is forced to flow through a column under high
pressure. Then it is separated into its constituent components by distributing
between the mobile phase (a flowing liquid) and a stationary phase (sorbents
packed inside a column).
NPC is the traditional separation mode based on adsorption/desorption of
the analyte onto a polar stationary phase (typically silica or alumina). In this
technique, nonpolar compounds travel faster and are eluted first because of the
lower affinity between the nonpolar compounds and the stationary phase. Polar
compounds are retained for a longer time because of their higher affinity
towards the stationary phase. Normal phase mode of separation is,
therefore, not generally used for pharmaceutical applications because most of
the drug molecules are polar in nature and hence take longer time to elute.
18,
[image:14.595.136.480.228.484.2]C8, C4 etc., (in the order of increasing polarity of the stationary phase).
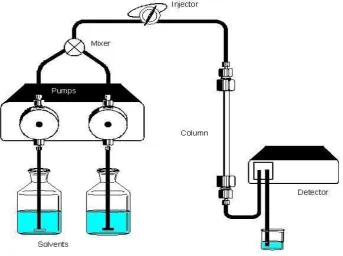
Fig 1: Principle pattern of a HPLC instrument
Two basic types of column packing used in LC are pellicular and porous
particles. In pellicular packing, spherical, nonporous, glass or polymer beads are allows the use of secondary solute chemical equilibrium (such as ionization
control, ion suppression, ion pairing and complexation) to control retention and
selectivity. The polar compound gets eluted first in this mode and nonpolar
compounds are retained for longer time. As most of the drugs and
pharmaceuticals are polar in nature, they are not retained for longer times and
hence elute faster.The different columns used are octadecylsilane (ODS) or C
Columns are the heart of HPLC. Liquid chromatographic columns are
usually constructed from smooth bore stainless steel tubing. Sometimes
made from heavy walled glass tubings and polymer tubings such as PEEK.
Guard columns are introduced before analytical columns to increase the life of
analytical columns, by removing not only particulate matter and contaminants
from solvents but also sample components that bind irreversibly to the stationary
phase. Analytical columns ranges from 5 - 25 cm long; inside diameter is
Columns for the bonded phase chromatography is prepared by surface
functionalization of silica. The surface of fully hydrolysed silica is made up of
chemically reactive silanol groups.
The most useful bonded phase coatings are siloxanes formed by the reaction
of the hydrolyzed surface with organochlorosilanes. For example,
Reaction of silanol group with organochlorosilane leads to formation of
siloxanes
Where R is an alkyl group or substituted alkyl group like C8, C18 Different types
of detectors used in HPLC are absorbance detectors, fluorescence detectors,
electrochemical detectors, refractive index detectors, conductivity detectors,
photo ionization detectors etc.
Method Development and Design of Separation Method10-13
Methods for analysing drugs in single or multi component dosage forms
can be developed, provided one has knowledge about the nature of the sample,
namely, its molecular weight, polarity, ionic character and the solubility
parameter. An exact recipe for HPLC, however, cannot be provided because used. A thin layer of silica, alumina, polystyrene – divinylbenzene synthetic resin,
or an ion – exchange resin was deposited on the surface of these beads. In the
typical porous particle packing of LC is composed of silica, alumina,
chromatography, when the compounds are hydrophilic in nature with many polar
groups and are water soluble.
The organic phase concentration required for the mobile phase can be
estimated by gradient elution method. For aqueous sample mixtures, the best
way to start is with gradient reversed phase chromatography. Gradient can be
started with 5-10 % organic phase in the mobile phase and the organic phase
concentration (methanol or acetonitrile) can be increased up to 100 % within
30-45 min. Separation can then be optimized by changing the initial
mobile phase composition and the slope of the gradient according to the
chromatogram obtained from the preliminary run. The initial mobile phase
composition can be estimated on the basis of where the compounds of interest
were eluted,namely at what mobile phase composition.
Changing the polarity of mobile phase can alter elution of drug
molecules. The elution strength of a mobile phase depends upon its polarity,
the stronger the polarity, higher is the elution. Ionic samples (acidic or basic)
can be separated, if they are present in undissociated form. Dissociation of ionic
samples may be suppressed by the proper selection of pH. The pH of the
mobile phase has to be selected in such a way that the compounds are not
ionized. If the retention times are too short, the decrease of the organic phase
concentration in the mobile phase can be in steps of 5%. If the retention times
are too long, an increase of the organic phase concentration is needed.
In UV detection, good analytical results are obtained only when the
wavelength is selected carefully. This requires knowledge of the UV spectra of
the individual present in the sample. If analyte standards are available, their UV
spectra can be measured prior to HPLC method development.
The molar absorbance at the detection wavelength is also an important
parameter. When peaks are not detected in the chromatograms, it is possible
that the sample quantity is not enough for the detection. An injection of volume
of 20 μL from a solution of 1 mg/mL concentration normally provides good
It is not always necessary to detect compounds at their maximum
absorbance. It is, however, advantageous to avoid the detection at the
sloppy part of the UV spectrum for precise quantitation. When acceptable
peaks are detected on the chromatogram, the investigation of the peak shapes
can help further method development.
The addition of peak modifiers to the mobile phase can affect the
separation of ionic samples. For examples, the retention of the basic
compounds can be influenced by the addition of small amounts of
triethylamine (a peak modifier) to the mobile phase. Similarly for acidic
compounds small amounts of acids such as acetic acid can be used. This
can lead to useful changes in selectivity. When tailing or fronting is observed,
it means that the mobile phase is not totally compatible with the solutes. In
most case the pH is not properly selected and hence partial dissociation or
protonation takes place. When the peak shape does not improve by lower (1-2)
or higher (8-9) pH, then ion-pair chromatography can be used. For acidic
compounds, cationic ion pair molecules at higher pH and for basic
compounds, anionic ion-pair molecules at lower pH can be used. For
amphoteric solutes or a mixture of acidic and basic compounds, ion-pair
chromatography is the method of choice.
The low solubility of the sample in the mobile phase can also cause bad
peak shapes. It is always advisable to use the same solvents for the preparation
of sample solution as the mobile phase to avoid precipitation of the compounds in
the column or injector.
Optimization can be started only after a reasonable chromatogram has
been obtained. A reasonable chromatogram means that more or less
symmetrical peaks on the chromatogram detect all the compounds. By sight
change of the mobile phase composition, the position of the peaks can be
The peak resolution can be increased by using a more efficient column
(column with higher theoretical plate number, N) which can be achieved by
using a column of smaller particle size, or a longer column. These factors,
however, will increase the analysis time. Flow rate does not influence resolution,
but it has a strong effect on the analysis time.
Unfortunately, theoretical predictions of mobile phase and stationary
phase interactions with a given set of sample components are not always
accurate, but they do help to narrow down the choices for method
development. The separation scientist must usually perform a series of trial and
error experiments with different mobile phase compositions until a satisfactory
separation is achieved.
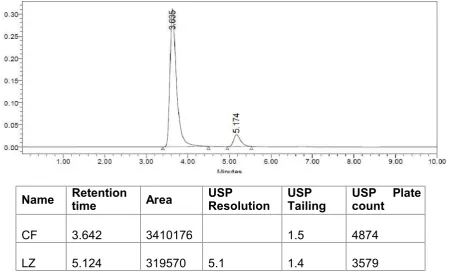
Fig 2: A HPLC chromatogram
The parameters that are affected by the changes in chromatographic conditions
are:
1. Resolution (RS).
2. Capacity factor (k‟).
3. Selectivity (α).
Quantitative Analysis in HPLC14
Two methods are generally used for quantitative analysis. They are the
external standard method, the internal standard method and the standard
addition method.
1. External standard method
The external standard method involves the use of a single standard or up to
three standard solutions. The peak area or the height of the sample and the
standard used are compared directly or the slope of the calibration curve
based on standards that contain known concentrations of the compounds of
interest.
2. Internal standard method
A widely used technique of quantitation involves the addition of an internal
standard to compensate for various analytical errors. In this approach, a known
compound of a fixed concentration is added to the known amount of samples to
give separate peaks in the chromatograms, to compensate for the losses of the
compounds of interest during sample pretreatment steps. Any loss of the
component of interest will be accompanied by the loss of an equivalent fraction
of internal standard. The accuracy of this approach obviously dependents on the
structural equivalence of the compounds of interest and the internal standard.
The internal standard should be added to the sample prior to
sample preparation procedure and homogenized with it. Response factor is used
to determine the concentration of a sample component in the original sample.
The response factor (RF) is the ratio of peak areas of sample component (Ax)
and the internal standard (AISTD) obtained by injecting the same quantity.
1.6. HIGH PERFORMANCE THIN LAYER CHROMATOGRAPHY15-19
application of the sample on the stationary phase, the mobile phase is allowed to
move through the stationary phase via capillary action. The separation of the
components in the sample takes place depended on the affinity of the
components towards the stationary phase and mobile phase. Organic solvent or
mixture of solvents are used as mobile phase to achieve a good resolution.
High performance thin layer chromatography (HPTLC) is a sophisticated
instrumental technique based on the full capabilities of thin layer
chromatography. The advantages of automation, scanning, full optimization,
selective detection principle, minimum sample preparation, hyphenation, etc.
enable it to be a powerful analytical tool for chromatographic information of
complex mixtures of inorganic, organic, and biomolecules. The term HPTLC is
used for the technique in which substances are accurately and precisely
assayed using high performance grades of silica gel. In HPTLC, the sorbent
material like silica gel G60 has finer particle size distribution than conventional
TLC material. It is a powerful, reliable and cost effective method for
qualitative and quantitative analysis. In HPTLC, the mobile phase moves
through the pre-coated stationary phase by capillary action or by gravity.
The position of any solute spot in TLC is characterized by its
retention/retardation factor Rf. It is
a fundamental qualitative value and is expressed
Distance travelled by solute from application line
Rf=
Distance travelled by solvent from application line
Rf values range from 1.0 for analyte migrating to the solvent front to 0.0 for
an analyte strongly retained at the point of application. The reproducibility of Rf
values depends on many factors, such as quality of the sorbent, humidity,
layer thickness, development distance, and ambient temperature. Overloading
Features of HPTLC:
1. Simultaneous processing of sample and standard under the same
conditions leads to better analytical precision and accuracy.
2. High sample throughput of similar or different nature of samples.
3. Simple sample preparation- handles samples of divergent nature.
4. No prior treatment for solvents like filtration and degassing.
5. Low mobile phase consumption per sample.
6. No interference from previous analysis - fresh stationary and mobile
phases - for each analysis – no contamination.
7. Entire spectrum can be seen at a glance.
8. Lower analysis time and less cost per analysis.
9. Low maintenance cost.
1. Selection of chromatographic layer:
Pre-coated plates with different support materials like glass, aluminium and plastic and with different sorbent layers are available. Commonly
used pre-coated plates are silica gel G 60F254, aluminium oxide,
cellulose, hybrid plates etc., plates in size of 10x10cm are usually used.
80 % of analysis: Basic substances, alkaloids and steroids - Silica gel G 60F254.
Amino acids, dipeptides, sugars and alkaloids – cellulose
Non polar substances, fatty acids, carotenoids, cholesterol – 2, RP-8 and RP-1RP-8.
2. Sample and standard preparation:
Proper sample and standard preparation is an important pre-requisite for the success of HPTLC. The choice of suitable solvent for a given analysis is
very important. For normal phase mode, non polar solvent should be used
for dissolving the sample and standard. For reverse phase mode, polar
solvent should be used for dissolving sample and standard.
3. Activation of pre-coated plates:
Freshly open box of plates do not require activation, plates exposed to high humidity or kept on hand for long time to be activated, by
placing in an oven at 110-120º C for 30 minutes prior to spotting,
Aluminum sheets should be kept in between two glass plates and placing in oven at 110-120º C for 15 minutes.
4. Application of sample and standard:
The selection of the sample application technique and device to be used depends on: Nature of the analytical work, sample volume, number of
samples to be applied, qualitative or quantitative work.
Sample application should be done either as spots or as bands.
5. Selection of mobile phase:
The mobile phase should be chosen taking into consideration the chemical properties of the analyte and adsorbent.
Trial and error.
One‟s own experience and Literature.
Composition is expressed by volume (v/v) and sum of volumes is usually 100.
Normal phase: Mobile phase is non-polar. Non-polar compounds eluted first because of lower affinity with stationary phase. Polar
compounds retained because of higher affinity with the stationary
phase. Stationary phase is polar.
Reverse phase: Mobile phase is polar. Polar compounds eluted first because of lower affinity with stationary phase. Non-Polar compounds
retained because of higher affinity with the stationary phase. Stationary
phase is non polar.
6. Pre-conditioning (Chamber saturation):
Unsaturated chamber causes high Rf values.Saturated chamber by
lining with filter paper for 30 minutes prior to development- uniform
distribution of solvent vapours- less solvent for the sample to travel
lower Rf values.
7. Chromatographic development and drying:
Ascending, descending and two dimensional are the most common methods of development. After the development, the plate
is removed from the chamber and dry. Twin trough chambers with
8. Detection and visualization:
Detection under UV light is first choice as it is nondestructive, spots of fluorescent compounds can be seen at 254 nm (short wave
length) or at 366 nm (long wave length), spots of nonfluorescent
compounds like Ethambutol, Dicylomine etc-dipping the plates in0.1 %
iodine solution. When individual component does not respond
to UV- derivatization required for detection.
9. Quantification:
Most modern HPTLC quantitative analysis are performed in situ by measuring the zones of samples and standards using a chromatogram
spectrophotometer usually called a densitometer or scanner with a fixed
sample light beam in the form of a rectangular slit. Generally,
quantitative evaluation is performed with the TLC Scanner III using
winCATS software. It can scan the chromatogram in reflectance or in
transmittance mode by absorbance or by fluorescent mode; scanning
speed is selectable up to 100 mm/s. Spectra recording is fast.
Calibration of single and multiple levels with linear or nonlinear
regressions are possible.
10. Documentation
Each developed plate is documented using digital documentation system under UV light at 254 nm, UV light at 366 nm, and white light. If
a type of light does not produce usable information, that fact must be
documented. If a plate is derivatized, images are taken prior and after
derivatization.
1.7. ANALYTIC METHOD DEVELOPMENT AND VALIDATION20-22
Analytic method development and validation are continuous and
interconnected activities conducted throughout the drug development
process. Analytical methods are required to characterize drug substance
development. Early phase methods must support changes in synthetic routes
and dosage form and elucidate the structures and levels of impurities. In
later phases, goals change to the development of rapid and robust
methods for release and stability evaluation that can be transferred to
quality units. Analytic methods are intended to establish the identity,
purity, physical characteristics and potency of the drugs that we use. Analytical
method validation is the process of demonstrating that the analytical
procedures are suitable for their intended use. According to FDA guideline,
analytic method validation is a matter of establishing documented evidence
that provides a high degree of assurance that the specified method will
consistently provide accurate test results that evaluate a product against its
defined specification and quality attributes. The validation process requires
quality method development. Whereas validation can be a time-consuming
process, methods should not enter the validation phase unless they are fully
developed. The relationship of validation and method development can be
Observed as:
When methods are properly developed, they can be readily validated. Validation does not make a method better or more efficient.
A validated method does not necessarily imply that it meets all criteria of a properly developed method.
Validation acceptance criteria should be based on method development experience.
Method Validation is required for the following reasons:
1. A new method is been developed.
2. Revision of established method.
3. When established methods are used in different laboratories and
different analysts etc.
Advantages of analytical method validation:
The biggest advantage of method validation is that it builds a degree of confidence, not only for the developer but also to the user.
Although the validation exercise may appear costly and time consuming, it results inexpensive, eliminates frustrating repetitions
and leads to better time management in the end.
Minor changes in the conditions such as reagent supplier or grade, analytical setup are unavoidable due to obvious reasons but the
method validation absorbs the shock of such conditions and pays for
more than invested on the process.
Guidelines from the following sources provide a framework for performing
validation.
United states pharmacopoeia (USP)
International conference on harmonization (ICH) Food and drug administration (FDA)
Validation according to ICH Guidelines
Typical validation parameters are:
i) Accuracy
ii) Precision (Repeatability, Intermediate precision and Reproducibility)
iii) Linearity
iv) Range
v) Specificit
vi) Robustness
vii) System suitability testing
(i )Accuracy:
Definition: It expresses the closeness of agreement between the value
which is accepted either asa conventional true value or an accepted reference
value and the value found. This is sometimes termed trueness.
The accuracy of an analytical method is the closeness of test results
obtained by that method to the true value. The accuracy of the method was
determined by recovery studies. The ICH document on validation methodology
recommends accuracy to be assessed using a minimum of nine determinations
over a minimum of three concentration levels covering the specified range.
Accuracy should be reported as percent recovery by the assay of known
added amount of analyte in the sample or as the difference between the mean
and the accepted true value.
(ii) Precision :
Definition: It expresses the closeness of agreement between a series of
measurements obtained from multiple sampling of the same homogeneous
sample under the prescribed conditions.
Precision may be considered at three levels: repeatability, intermediate
precision and reproducibility.
Repeatability: It expresses the precision under the same operating conditions
over a short interval of time. Repeatability is also termed intra-assay precision.
Repeatability must be tested from at least six replications measured at 100
percent of the test target concentration or from at least nine replications covering
the complete specified range.
Intermediate precision: It expresses variations within laboratories, such as
Reproducibility: It expresses the precision between laboratories. The objective of
reproducibility is to verify that the method will provide the same results in different
laboratories. The reproducibility of an analytical method is determined
by analyzing aliquots from homogeneous lots in different laboratories with
different analysts.
(iii) Linearity:
Definition: Linearity of an analytical procedure is its ability (within a given
range) to obtain test results that are directly proportional to the concentration of
analyte in the sample.
It may be demonstrated directly on the drug substance (by dilution of a
standard stock solution) and/ separate weighing of synthetic mixtures of the drug
product components, using the proposed procedure.
( iv) Range:
Definition: Range of an analytical procedure is the interval from the upper to
the lower concentration (amounts) of analyte in the sample for which it has been
demonstrated that the analytical procedure has a suitable level of precision,
accuracy and linearity. For the assay of a drug substance or a finished (drug)
product: normally from 80 to 120 percent of the test concentration should be
tested/checked for range.
(v) Specificity:
Definition: It is the ability to assess unequivocally the analyte in the presence of
components, which may be expected to be present. Typically, these might
include impurities, degradants, matrix, etc.
(vi) Robustness:
Definition: It is a measure of its capacity to remain unaffected by small, but
deliberate variations in method parameters and provides an indication of its
(vii) System suitability testing:
(viii)Limit of detection and Limit of quantitation:
The detection limit of an individual analytical procedure is the lowest
amount of analyte in a sample, which can be detected but not necessarily
quantitated as an exact value.
The quantitation limit of an individual analytical procedure is
the lowest concentration of analyte in a sample, which can be quantitatively
determined with a suitable level of precision and accuracy.
Several approaches for determining are possible, depending on whether the
procedure is a non- instrumental or instrumental.
Based on visual evaluation Based on signal-to-noise
Based on the standard deviation of the response and the slope.
The LOD and LOQ were estimated from the set of 5 calibration curves
used to determine method linearity. Limit of detection and Limit of quantitation
can be calculated by the following equation.
LOD = 3.3 (σ/S), LOQ = 10 (σ/S)
Where,
σ= Standard deviation of y-intercepts of regression lines
Definition: The tests, based on the concept that the equipment, electronics,
analytical operations and samples to be analyzed constitute an integral system
that can be evaluated as such. System suitability test parameters to be
established for a particular procedure depend on the type of procedure being
Data Elements Required for Assay Validation
There are various analytical methods for the examination of pharmaceutical
materials. Not all the characteristics referred above will need to be considered in
all cases. Analytical method may be broadly classified as per WHO as follows.
Class A: tests design to establish identity, whether of bulk drug
substances or of a particular ingredient in a finished dosage form.
Class B: Methods designed to detect and quantify impurities in a bulk
drug substance or finished dosage form.
Class C: methods used to determine quantitatively the concentration of a
bulk drug substance or of a major ingredient in a finished dosage form.
Class D: method used to assess the characteristics of finished dosage
forms, such as dissolution profiles and content uniformity.
Table 1:Validation parameters that should be considered for different
types of analytical procedures
Parameters Class A
Class B
Class C Class D Quantitative
tests
Limit
tests
Accuracy * * *
Precision * * *
Robustness * * * * *
Linearity & Range * * *
Selectivity * * * * *
LOD * *
2.1 Literature Review
1. A Validated High Performance Liquid Chromatographic (HPLC)
Method for the estimation of Cefuroxime axetil P Santhosh Kumar
et al.23
2. Development and validation of HPTLC Method for the estimation of
Cefuroxime axeti -N J Shahet al.24
A rapid and reproducible High Performance Liquid Chromatographic method has been developed for the estimation of Cefuroxime axetil in its pure form as well as in pharmaceutical dosage forms. Chromatography was carried out on an ODS C18 column (150 x 4.6 mm x 5 μm length), using a mixture of methanol and
0.01M potassium dihydrogen orthophosphate buffer (pH-2.0±0.05) (60:40 v/v) as the mobile phase at a flow rate of 0.8 mL/min and the detection was done at 248 nm. The method was developed and fully validated for the determination of Cefuroxime axetil. The retention time of the drug was 3.693 min. The method produced linear responses in the concentration range of 0.45 to 80 μg/mL of Cefuroxime axetil. Developed HPLC method was sensitive with LOD= 0.26 μg/mL and LOQ= 0.58 μg/mL. The method was successfully validated in accordance to ICH guidelines and was found to be reproducible for analysis of the drug in parenteral preparations.
3. HPTLC Determination of Cefuroxime axetil and Ornidazole in Combined Tablet Dosage Form25
4. Development and validation of analytical method for the simultaneous estimation of Cefuroxime sodium and Potassium clavulanate in bulk and combined dosage form
- J D Modiet al.26
- Poonam N Ranjane et al.
A new simple High-Performance Thin Layer Chromatographic method for determination of Cefuroxime axetil and Ornidazole in combined tablet dosage form is developed and validated. The separation is carried out on Merck precoated silica gel aluminium plate 60 F254 using toluene : n-butanol :
triethylamine (8.5:2:0.5, v/v/v) as mobile phase. Quantitative determination of drugs is carried out by densitometric scanning of plates at 285 nm. The retention factor for Ornidazole and Cefuroxime axetil is found to be 0.51 ± 0.007 and 0.67 ± 0.009, respectively. The method is validated with respect to linearity, accuracy, precision, and robustness. Response is found to be linear in the concentration range of 100–500 ng/band for both Cefuroxime axetil and Ornidazole. The method has been successfully applied for the analysis of drugs in pharmaceutical formulation. The % assay is found to be 102.36 ± 0.775 and 101.00 ± 1.192 for Cefuroxime axetil and Ornidazole, respectively.
A Stability indicating RP-HPLC was developed and validated for determination of Cefuroxime sodium (CEF) and Potassium clavulanate (PCA). The RP-HPLC has shown adequate separation for Cefuroxime sodium and Potassium clavulanate from its degradation products. The separation was achieved on Hypersil BDS C18 column (250x4.6 mm, 5 µm particle size) using a mobile phase composition
The mean recovery was found to be 100.08±0.68% and 99.95±0.67% for Cefuroxime sodium and Potassium clavulanate respectively The limit of detection was 0.34μg/ml and the limit of quantification was 0.112μg/ml for Cefuroxime sodium and the limit of detection was 0.097μg/ml and the limit of quantification was 0.292μg/ml for Potassium clavulanate.
5. Development and validation of UV simultaneous estimation of
Cefuroxime axetil in bulk and Pharmaceutical dosage form.
- Md Rezowanur Rahman et al27
6. Simultaneous estimation of Cefuroxime axetil and Potassium clavulanate – analytical method development and validation
- Pramod L I et al28
A rapid and sensitive UV-Visible spectroscopic method was developed for the estimation of Cefuroxime in pure and its pharmaceutical formulations. The method was based on the measurement of absorbance of Cefuroxime active moiety of Cefuroxime tablet at 277 nm using methanol as solvent. The absorbance was found to increase linearly with increase in concentration of Cefuroxime which was corroborated by correlation coefficient values. The standard solution of Cefuroxime obeyed Beer„s law over the concentration range of 9.20– 27.60 μg/mL. The method is linear (from 9.20-27.60 μg/mL) with an R2 of 0.999, accurate (% recovery 100.56%) and precise (% RSD 0.316%). The method is specific and robust for Cefuroxime.
7. Spectrophotometric determination of Cefuroxime axetil from bulk and
in its tablet dosage form
M V Shindeet.al29
axetil and Potassium clavlanate in tablet dosage form.
- Mahima R Set. al30
9. Simultaneous determination of Cefuroxime axetil and Potassium
clavulanate in pharmaceutical dosage form by RP- HPLC
- Pramod L Iet. al31
Simple, rapid spectrophotometric method has been developed for estimation of Cefuroxime axetil from bulk drug and tablet dosage form by using 1-nitroso-2-napthol and Sodium hydroxide. The method is based on the formation of yellow-orange coloured complex with 1- nitroso-2-napthol having absorbance maxima at 424 nm. The Beer„s Law is obeyed in the concentration range of 10-50 mcg/ml of the drug. The result of analysis of tablet formulation gave the percentage of label claim ±standard deviation as 99.17±1.57.
8. RP-HPLC method for the simultaneous determination of Cefuroxime
A simple, specific, accurate and precise RP-HPLC method for analysis of Cefuroxime axetil and Potassium clavulanate had been developed. Separation of drug was carried out on JASCO HPLC system with Hypersil Gold C18 column (250 mm×4.6 mm id) using 0.01 M Potassium dihydrogen
phosphate: methanol (60:40 v/v) as mobile phase. Quantitation was carried out at a wavelength of 225 nm. Results were found to be linear in the concentration range of 5-50 mcg/ml for Cefuroxime axetil and 5-30 mcg/ml for Pot. clavulanate. Mean retension times for Pot. clavulanate and Cefuroxime axetil were found to be 2.573 and 8.293 respectively. Intra day variation as % RSD was 0.328 for Cefuroxime axetil and 0.382 for Potassium clavulanate. Inter day variation, as %RSD was 0.545 for Cefuroxime axetil and 0.552 foe Pot. clavulanate. The percentage assay was found to be 100.976±0.439 for Cefuroxime axetil and 101.053±0.423for Pot. Clavulanate.
was validated according to the ICH guidelines with respect to specificity, linearity, accuracy, precision and robustness. The regression value for both the drugs was found to be 0.996 and 0.992, the SD and RSD values were found to be well within the acceptable limit of 2.0%
10. Development and validation of UV spectrophotometric method for the estimation of Linezolid in bulk and pharmaceutical formulation. 18
- P Prasanthiet al.32
11. Method development and validation of spectrophotometric
method for the estimation of Linezolid in pure and tablet dosage form.
- Sushama Set al.33
with UV detection at 230 nm. The retention time for Cefuroxime axetil and Potassium clavulanate were 2.46 and 3.33 minutes respectively. The method
A simple, accurate, precise and sensitive UV spectrophotometric method was developed for the determination of Linezolid in bulk and pharmaceutical dosage form. The solvent used was 20% methanol and the wavelength corresponding to maximum absorbance of the drug was found at 251nm. Beers law was observed in the concentration range of 2-16μg/ml with correlation coefficient 0.999. The linear regression equation obtained by least square regression method was y=0.072X- 0.065, where y is the absorbance and x is the concentration of the pure drug solution. The method was validated for several parameters like accuracy, precision as per ICH guidelines.
12. RP-HPLC method development and validation for the analysis of
pharmaceutical drugs – Linezolid.
- V G Patelet al.34
13. A validated stability-indicating LC method for the separation of
enantiomer and potential impurities of Linezolid using polar organic
mode
- Satyanarayana Raju Tet al.35
A simple, selective, linear, precise and accurate RP-HPLC method was developed and validated for rapid assay of Linezolid. Isocratic elution at a flow rate of 1.2 ml/min was employed on a symmetry C18 column at ambient
temperature. The mobile phase consisted of acetonitrile: 0.1 M acetic acid 50:50 (v/v). The UV detection wavelength was at 254 nm. Linearity was observed in the concentration range if 100-140 ppm. Retension time for Linezolid was 3.3 min.
14. Spectrophotometric method development and validation for the estimation of Linezolid in tablet dosage Form
- Gadhiya D T, Bagada H L 36
15.Spectrophotometric method for the simultaneous estimation of
Cefixime trihydrate and Linezolid in tablet dosage form
- Patel S Aet al37
The method is based on the simultaneous equations for analysis of both the drugs using
16. Development and validation of stability indicating HPLC method for
simultaneous estimation of Cefixime and Linezolid
- Nidhi S Pet al 38
For RP-HPLC , the separation was achieved by Phenomenex Luna C18(250×4.6 mm), 5 µm column using phosphate buffer(pH 7):methanol(60:40 v/v) as mobile phase with flow rate 1 ml/min. The wavelength selected for quantitation for Cefixime and Linezolid were 276 nm. The retention time of Cefixime and Linezolid were found to be 3.127 min and 11.986 min respectively. During forced degradation, the drug was exposed to hydrolysis (acid and base), H2O2, thermal and photo degradation. The percentage
degradation was found to be 10-20% for both Cefixime and Linezolid in the The difference absorption spectra of equimolar solution of Linezolid in 0.1M hydrochloric acid in sample cell relative to 0.1M sodium hydroxide in reference cell were taken. Absorption maxima was found 258.27 nm. The drug followed a linear relationship in the range of 4-20μg/ml; while the correlation coefficient was 0.999. The recovery was 100.01% ±0.17 the relative standard deviation for repeatability, intraday and interday was found to be less than 2%. These methods are found suitable for day to day analysis of linezolid in tablet dosage form.
17.Stability indicating RP-UPLC method development and validation for
assay and content uniformity test of Linezolid with PDA detector.
- Jebaliya H et al.39
A method for the determination of content uniformity has been developed and validated for reducing analysis time and maintaining good efficiency. An isocratic separation of Linezolid was achieved on water Acquity BEH C18, 50×2.1 mm id, 1.7µm particle size column with a flow rate of 0.25 ml/min and using photodiode array detector to monitor the elute at 245 nm. A mobile phase consisting of methanol: water (50:50 v/v) to achieve good resolution and retention. The
detector linearity was established by concentrations range of 1.5-80 µg/ml with a LOD and LOQ of 0.4 and 1.5 µg/ml respectively.
18. Development and validation of method for simultaneous estimation of Cefuroxime and Linezolid by
HPLC Kinjal a patel40
e
2.2. DRUG PROFILE
2.2.1.
CEFUROXIME AXETILMolecular structure: Molecular formula Molecular weight CAS No. Melting point Boiling point Density Flash point Phase
: C20H22N4O10S : 510.475 g/mol
: 64544-07-6
: 1730C. : 804.20C : 1.76 g/cm3
440.20C. : Solid (STP).
Appearance
Storage temperature
Solubility in water
: White to almost white crystallin
: -200C freezer. : Insoluble in water
powder.
Solvent solubility
Drug category
Brand names
: Soluble in methanol, acetone,chloroform
: Anti Microbial
: oractil, Ceftum, altacef, cefuronat, ceftil, forcef IUPAC Name:1-acetyloxyethyl
2.2.2.
LINEZOLID16Molecular structure:
IUPAC Name :
Moleculer formula :
Molecular weight :
CAS No :
Melting point :
Phase :
Appearance :
Pka and pH :
Solubility in water :
Solvent solubility :
Stability :
Shelf life :
Drug category :
Brand names :
N yl C 33 16 18 S C pka S S St 4 A lin N-((3-(3-fluoro-4-morpholinophenyl)-2-oxo yl)methyl)acetamide
C16H20
FN
3O
4 337.351 g/mol165800-03-3
181.5-182.50C. Solid (STP).
Crystalline ,white to off white powder
pka is 1.8 with Ph 4
Soluble.
Soluble in Chloroform and alcohol, Insoluble
Stable, incompatible with strong oxidising a
4 years.
Anti Microbial
linzomac,linospan,lizbid,megazolid,ozolid,lin
oluble in ether.
ing agents
olid,linsomed,lizolid N-((3-(3-fluoro-4-morpholinophenyl)-2-oxooxazolidin-5-yl)methyl)acetamide
3.1 AIM AND OBJECTIVE
As per the literature review, there is no analytical methods reported for the
Hence,there is a need for suitable RP-HPLC and HPTLC Method for routine
analysis of Cefuroxime axetil and Linezolid in the combined formulation.
The work was an attempts to develop simple, rapid, and sensitive analytical
methods for the simultaneous estimation of Cefuroxime axetil and Linezolid in the
combined formulation in accordance with ICH Q2B guidelines and to extend the
method for routine analysis.
method for the simultaneous estimation of Cefuroxime axetil and Linezolid in the
combined tablet dosage form by RP-HPLC and HPTLC method.
STEP-1: Study of physiochemical properties of the drug
STEP-2: Selection of chromatographic condition
estimation of Cefuroxime axetil and Linezolid in combined pharmaceutical dosage
form by HPTLC. Various publications are available regarding the UV simultaneous
estimation and RP-HPLC method development of Cefuroxime axetil and Linezolid,
either alone or in combination with other drugs in pharmaceutical dosage form.
3.2 PLAN OF WORK
Present work is to develop and validate a new simple, rapid, and sensitive
Wave length,mobile phase,column,flow rate )
STEP-3: Optimization of the method
STEP-4: Study of the system suitability parameters
4. MATERIALS AND METHODS
S.NO. NAME MANUFACTURER GRADE
1. Cefuroxime axetil
2. Linezolid
working standard Chemisol
-3. Oratil LZ Macleods
pharmaceuticals. Ltd
-4. Potassium dihydrogen
phosphate Merck GR
5. Sodium perchlorate Merck GR
6. Perchloric acid Merck GR
7. Ortho phosphoric acid Merck GR
8. Methanol Merck HPLC
9. Acetontrile Merck HPLC
10. Water Merck HPLC
11. 0.45 µm Nylon filter Axivia S0761009
4.1. MATERIALS AND METHODS FOR- HPLC
4.1.1. Chemicals and reagents
Table No.2: List of Chemicals and reagents
Jivanta life sciences -working standard
12.
4.1.2. Equipment/Instrument details
Table No.3: List of Equipment/Instrument details
S.NO. INSTRUMENT NAME MODEL
1. HPLC system
Agilent 1220 Infinity LC(G4288C)
2. Analytical balance Shimadzu
3. pH Meter Thermo electron corporation orion 2 star
4. Sonicator Ultrasonic cleaner power sonic 420
5. Vacuum oven Wadegati
6. Constant temperature water bath Thermolab GMP
4.1.3. Analytical method development for the simultaneous estimation of
Cefuroxime axetil and Linezolid by RP-HPLC.
A. Selection of wavelength
A solution of 100µg/mL of Cefuroxime axetil and Linezolid were prepared in methanol.
The resulting solutions were scanned individually from 190 to 400 nm in UV-Visible
spectrophotometer. Spectrums obtained are shown in Fig.No.9-11.
B. Selection of chromatographic condition
Proper selection of the method depends up on the nature of the sample (ionic/
ionisable / neutral molecule), its molecular weight and solubility. The drugs selected in
C. Initial separation condition
The mobile phase selected to elute the drug from the stationary phase was acetonitrile
and phosphate buffer, because of its favorable UV transmittance, low viscosity and low
back pressure.
D. Effect of buffer
Potassium di-hydrogen phosphate buffer was selected because better and higher
intensity of response was obtained.
E. Effect of pH
The mobile phase pH was optimized using different pH, ranging from 2.0 to 3.0 (pH is
adjusted with Ortho phosphoric acid), at a flow rate of 0.5 mL/min and symmetry
Xterra C18 column as the stationary phase. The peak shape and resolution was
observed at different pH.
F. Effect of ionic strength
The phosphate buffer was prepared in different strengths such as 0.01M, 0.025M,
0.05M of Potassium di-hydrogen phosphate at pH 2.8. The retention time was
decreased by increasing the buffer strength. For the present study, the optimized
mobile phase composition phosphate buffer of pH 2.8: acetonitrile (35:65v/v) was
selected, because of the retention times of Cefuroxime axetil and Linezolid were
effected due to slight change of ionic strength during analysis.
G. Effect of nature of stationary phase
The following stationary phases were used and the chromatograms were recorded.
1. Agilent zorbax SB C18 (4.6 x 150mm, 5m)
3. Symmetry C8 (4.6 x 100mm, 5m)
4. Symmetry XterraC18 column.
With Agilent zorbax SB C18 and Phenomex-kinetex-XDB-C18 the results obtained
were not satisfactory because peak tailing was observed and also the resolution
between the peaks was comparatively lesser than that with symmetry XterraC18. With
XterraC18 column the peak shape and resolution observed were good. Therefore,
Xterra C18 column was used for further studies.
Preparation of Placebo:
The amount of powdered inactive ingredient supposed to be present in 10 tablets were
accurately weighed and transferred in to 100 ml volumetric flask, 70 ml of diluent was
added and shaken by mechanical stirrer and sonicated for about 30 minutes by
shaking at intervals of five minutes and was diluted up to the mark with diluent and
allowed to stand until the residue settles before taking an aliquot for dilution. 0.6 ml of
upper clear solution was transferred to a 100 ml volumetric flask and diluted with
diluent up to the mark and the solution was filtered through 0.45 m filter before
injecting into HPLC system.
Preparation of Phosphate buffer:
7.0 grams of KH2PO4 was weighed into a 1000ml beaker, dissolved and diluted to
1000ml with HPLC water. The flask was shaken until the particles get dissolved and
volume was made up to the mark with W ater. The pH was adjusted to 2.8 with ortho
TRIALS
Trial 1:
Method development for the drugs was initiated based on the individual chemical
charecteristics and their methods given in individual journals.
Mobile phase: Methanol : Acetonitrile (50:50v/v)
Diluent:methanol
Chromatographic conditions
Flow rate : 1.5 ml per min
Column : Agilent zorbax SB C18(4.6 x 150mm, 5m) Detector wavelength : 284 nm
Column oven : Ambient
Injection volume : 20l
Fig.No.3: Chromatogram for Trail 1
Observation: Theoretical plates were less and the system suitability was failed. The
Chromatogram for trial 1 is shown in Fig.No.6.
Result: Separation occurred below 6 min. System suitability was failed. Fronting of
Trail 2:
Inorder to improve resolution and remove fronting of the peak and avoid unwanted
peaks interfering, column and mobile phase was changed and again the same
experiment was performed.
Mobile phase: Phosphate buffer (pH 3.5): Methanol (50:50v/v)
Diluent: Methanol
Chromatographic conditions
Flow rate : 1.5 ml per min
Column : Phenomex-kinetex-XDB-C18 (4.6 x 100mm, 5m) Detector wavelength : 284 nm
Column oven : Ambient
Injection volume : 20l
Fig.No.4: Chromatogram for trial 2
Observation: Resolution was less and the system suitability was failed due to the
poor column performance. The Chromatogram for trial 2 is shown in Fig.No.7.
TRIAL-3
Inorder to avoid poor resolution column was changed and flow rate was decreased.
Mobile phase: Phosphate buffer (pH 2.8): Methanol (50:50v/v)
Diluent: Methanol.
Chromatographic conditions
Flow rate : 1.00 ml per min
Column : Symmetry C8(4.6 x 100mm, 5m)
Detector wavelength : 284 nm
Column oven : Ambient
Injection volume : 20l.
Fig.No.5: Chromatogram for trial 3
Observation: peaks were eluted but with less resolution, hence column was again
changed. The chromatogram for trial 3 is shown in Fig.No.8.
Result: peaks were eluted but with less resolution, hence column was again
OPTIMIZED METHOD
Optimized method for the simultaneous estimation of Cefuroxime axetil and Linezolid
by RP-HPLC was finally achieved by using the following chromatographic conditions.
Chromatographic conditions
Flow rate : 1 ml per min
Column : C18 Symmetry (4.6 x 150mm, 5m, Make:Xterra) .
Detector wavelength : 284 nm
Column oven : Ambient
Injection volume : 20l
Run time : 10 min
Procedure
Preparation of mobile phase: Mixture of above buffer 350 ml (35%) and 650 ml of
acetonitrile HPLC (65%) were mixed and degassed in ultrasonic water bath for 5
Preparation of standard solution (Mixed standard) : 10 mg of Cefuroxime axetil
and 10mg of Linezoild working standards were accurately weighed and transferred
into a 100ml clean dry volumetric flask add about 70ml of diluent was added and
sonicated to dissolve it completely and the volume was made up to the mark with the
same solvent. (Stock solution) Further 1.2ml of Cefuroxime axetil & 3ml of Linezolid
was pippeted from the above stock solution into a 10ml volumetric flask and diluted up
to the mark with diluent.
Preparation of sample solution
10 Tablets of Cefuroxime axetil and Linezolid were weighed and powdered in glass
mortar. The powder equivalent to the amount of active ingredient present in 10 tablets
(156.8mg) was transferred into a 100 ml clean dry volumetric flask, 70 ml of diluent
was added to it and was shaken by mechanical stirrer and sonicated for about 30
minutes by shaking at intervals of five minutes each and was diluted up to the mark
with diluent and allowed to stand until the residue settles before taking an aliquot for
further dilution (stock solution). 0.6ml of upper clear solution was transferred to a 10 ml
volumetric flask and diluted with diluent up to the mark and the solution was filtered
through 0.45 m filter before injecting into HPLC system.
Test Procedure
20 µl of the standard, sample, blank and placebo preparations in duplicate were
injected separately into HPLC system and the peak responses for Cefuroxime axetil
and Linezolid were measured. The quantities in mg of Cefuroxime axetil and Linezolid
were calculated per tablet taken.The developed RP-HPLC method for the
XterraC18, 150 mm × 4.6 mm, 5 m column in isocratic mode using mobile phase
composition of phosphate buffer (pH 2.8 with ortho phosphoric acid) : acetonitrile [35 :
65, v / v] with flow rate of 1 ml / min at 284nm. The asymmetric factor was found to be
1.58 for Cefuroxime axetil and 1.47 for Linezolid
Calculation: The amount of drug present was calculated by using the following
formula:
AT WS DT P Avg. Wt
Assay % = --- x --- x --- x --- x --- X 100
AS DS WT 100 Label Claim
Where
AT = average area counts of sample preparation.
As = average area counts of standard preparation.
WS = Weight of working standard taken in mg.
P = Percentage purity of working standard
LC = Label claim of drug in mg/ml.
The individual chromatograms of Cefuroxime axetil and Linezolid, standard,
sample, blank chromatograms for optimized method are shown in
Fig.No.12-16.Results are tabulated in Table .No.5.
4.3. METHOD VALIDATION
The objective of validation of an analytical procedure is to demonstrate that it is
1. Specificity.
2. Linearity.
3. Accuracy.
4. Precision.
5. Limit of detection.
6. Limit of quantification.
7. Robustness.
8. System suitability.
1. SPECIFICITY
A) Cefuroxime axetil and Linezolid identification
Solutions of standard and sample were prepared as per test procedure and injected
into the HPLC system. The recorded chromatograms are shown in Fig.No.17 and 18.
Acceptance criteria
Chromatogram of standard and sample should be identical with near retention time.
B) Placebo interference
A study to establish the interference of placebo was conducted. A sample of placebo
was injected into the HPLC system as per the test procedure. The chromatogram of
placebo is shown in Fig.No.19.
Acceptance criteria
Chromatogram of placebo should not show any peak at the retention time of analyte peak.
C) Blank interference
A study to establish the interference of blank was conducted. Diluent was injected into
HPLC system as per the test procedure. The chromatogram of blank is shown in
Fig.No.20.
Acceptance criteria
Chromatogram of blank should not show any peak at the retention time of analyte
peak. There is no interference due to blank at the retention time of analyte. Hence the
method is specific.
2. LINEARITY
Preparation of stock solution
10 mg of cefuroxime axetil and 10mg of linezolid working standards were accurately
weighed and transferred into a 100ml clean dry volumetric flask and about 70ml of
diluent was added and sonicated to dissolve it completely and the volume was made
up to the mark with the same solvent.
Preparation of Level – I (4ppm of Cefuroxime axetil and 10ppm of Linezolid)
0.4ml and 1 ml of stock solution was taken in 10ml of volumetric flask diluted up to the
mark with diluent.
Preparation of Level – II (8ppm of Cefuroxime axetil and 20ppm of Linezolid)
0.8ml and 2 ml of stock solution was taken in 10ml of volumetric flask diluted up to the
mark with diluent.
Preparation of Level – IV (16ppm of Cefuroxime axetill and 40ppm of Linezolid)
1.6ml and 4 ml of stock solution was taken in 10ml of volumetric flask diluted up to the
mark with diluent.
Preparation of Level – V (20ppm of Cefuroxime axetill and 50ppm of Linezolid
2.0ml and 5 ml of stock solution were taken in 10ml of volumetric flask diluted up to the
mark with diluent.
Procedure
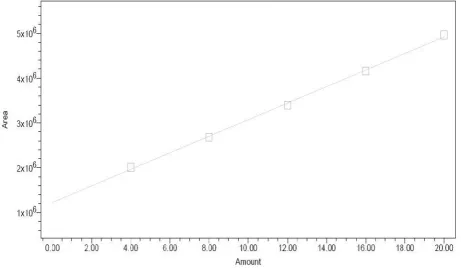
Each level solution was injected into the chromatographic system and the peak area
was measured. A graph of peak area versus concentration (on X-axis concentration
and on Y-axis Peak area) was plotted and the correlation coefficient was calculated.
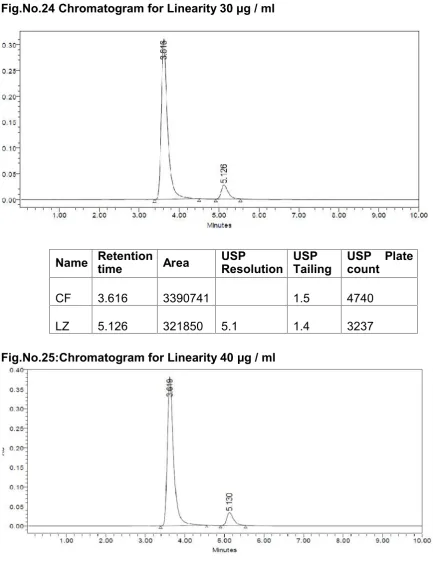
The linearity of the method was demonstrated over the concentration range of 10-50 µg /
ml. Aliquots of10, 20, 30, 40 and 50 µg / ml were prepared from sample solution and
labeled as solution 1, 2, 3, 4 and 5 respectively. The solutions were injected in to HPLC
system as per test procedure. The Chromatograms are shown in
Fig.No.21-25.Acalibration curve was plotted for concentration v/s peak area and is shown in the
Fig.No.26 and 27.The results are tabulated in Table No. 6 and 7.
Acceptance criteria
Correlation Coefficient should be not less than 0.9990.
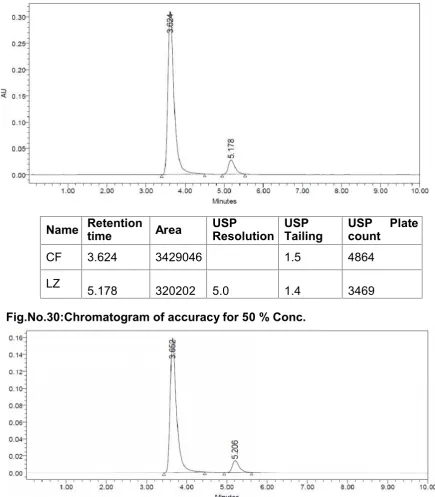
% RSD of peak area‚s for Solution 1, 2, 3, 4 and 5 should be not more than 2.0 %. 3. ACCURACY
Assay was performed in triplicate for various concentrations of cefuroxime axetil and
linezolid equivalent to 50, 100, and 150 % of the standard amount was injected into